
Abstract
Background
Diet monitoring has been linked with improved eating habits and positive health outcomes such as prevention of obesity. However, this is often unsustainable as traditional methods place a high burden on both participants and researchers through pen and paper recordings and manual nutrient coding respectively. The digitisation of dietary monitoring has greatly reduced these barriers. This paper proposes a diet application with a novel food recognition feature with a usability study conducted in the real world.
Methods
This study describes the development of a mobile diet application (MyDietCam) targeted at healthy Malaysian adults. Focus group discussions (FGD) were carried out among dietitians and potential users to determine ideal features in a diet application. Thirty participants were recruited from a local university to log their meals through MyDietCam for six days and submit the Malay mHealth Application Usability Questionnaire (M-MAUQ) at the end of the study.
Results
The findings from the FGD led to the implementation of the main features: individualised recommendations, food logging through food recognition to reduce steps for data entry and provide detailed nutrient analyses through visuals. An average overall usability score of 5.13 out of a maximum of seven was reported from the M-MAUQ which is considered acceptable.
Conclusion
The development of a local (Malaysian) mobile diet application with acceptable usability may be helpful in sustaining the diet monitoring habit to improve health outcomes. Future work should focus on improving the issues raised before testing the effectiveness of the application for improving health outcomes.
Keywords
Introduction
Diet is a key modifiable factor in lowering the risk of contracting non-communicable diseases (NCDs). 1 The Malaysian National Health and Morbidity Survey (NHMS) 2019 reported that one in two Malaysian adults were those who were overweight or affected by obesity. 2 Obesity has been proven to be associated with NCDs such as diabetes, 3 cardiovascular diseases, 4 and cancer, 5 which significantly depreciate one's quality of life. Diet monitoring may potentially improve individuals’ understanding of their dietary patterns, 6 eventually leading to improved diet quality, lower rates of obesity, and, ideally, a lower risk for developing diseases. 7
However, traditional methods of manually reporting diet through pen and paper records may be inaccurate, cumbersome, and time-consuming. 8 Manual diet monitoring requires not only a high level of motivation to carry an additional food journal to list their daily food intake but also places a high burden on researchers and practitioners to manually analyse the nutrient content from the list of foods provided. Manual nutrient estimations by different researchers and practitioners may also lead to variations in nutrition data. 9 Other issues faced in diet monitoring are related to data inaccuracy due to over- or under-estimation of portion size, recall bias, or social desirability bias by the users. 10
Recent research in the dietary assessment field focused on minimising these shortcomings by developing mobile applications using smartphones.11,12 The availability of smartphones and their advanced features have played a significant role in reducing the burden of dietary monitoring. The convenience of device portability, the ability to store and search for information in online servers, high-resolution cameras, and the possibility of personalisation options have driven the development of mobile diet applications that are favoured by consumers.13,14 Recent technological advances in dietary monitoring are beginning to investigate on the possibilities of food recognition technology through deep learning. Deep learning is a subset of artificial intelligence that consists of a multilayered structure of algorithms that learn from a vast amount of data to improve their performance. 15 The idea of diet monitoring through image recognition technology was in line with current trends of capturing food images before meals which aid in eliminating recall bias and minimising social desirability bias. 16 Furthermore, previous diet applications with image capture capabilities have been reported to improve the accuracy of data through automatically coding or passively capturing food intakes and facilitating portion size estimations. 13 One of the real-world examples would be FoodAI, a deep learning-based image recognition mobile food journal. 17 It has been deployed through several organisations and universities, allowing for an efficient and effective diet monitoring tool to overcome the aforementioned limitations.
Recent popular diet applications have also incorporated several features to support behaviour change and promote self-efficacy through tracking diet, leading users to achieve goals and positive health outcomes. 7 In comparison to manual dietary monitoring through pen and paper, mobile diet app users from previous studies reported lower calorie intake,18,19 increased consumption of fruits and vegetables, 20 and reduced consumption of sugar-sweetened beverages and takeout meals in adults, 14 which are ideal behaviours in combating obesity. Carter et al. 21 also reported that mobile app users had a higher adherence rate of dietary reporting than computer-based, web-based or conventional pen and paper methods. It is also worth mentioning that even when mobile health (mHealth) interventions produce outcomes similar to traditional approaches, the advantage of being able to reach a broader audience makes it an unparallel instrument altogether. 14
Based on existing literature and with the advantages that mHealth brings, this paper aimed to describe the development of a novel mobile diet application equipped with a combination of food recognition through deep learning and diet quality scores to ease the burden of diet monitoring further. MyDietCam would guide the Malaysian adult population in making healthier diet-related choices to reduce the risks of obesity and NCDs. This would be the first Malaysian diet application that uses food recognition technology in addition to providing both nutrient and food group-based nutrition analyses.
Methods
The MyDietCam project adopted a multidisciplinary approach involving a collaborative team of researchers from the field of dietetics, behaviour change, and artificial intelligence. The project was conducted in five phases based on the agile software development lifecycle22,23 as shown in Figure 1. The initial phase involved gathering information regarding mobile diet applications and food recognition technologies. The second phase comprised organising the collected information and preparing for the development of the application. Next, the development phase was where coding and initial lab testing of the food recognition system were conducted. Features for behaviour change strategies determined from a separate study (unpublished data) were also incorporated in this phase. The fourth phase focused on pilot testing the prototypes in the real world to obtain feedback. The last phase would be the incorporation of feedback and rectification of errors from the testing before deployment. In any instance that an issue or an error was discovered, the process of the app development returned to the development phase, as shown by the dotted arrows in Figure 1.
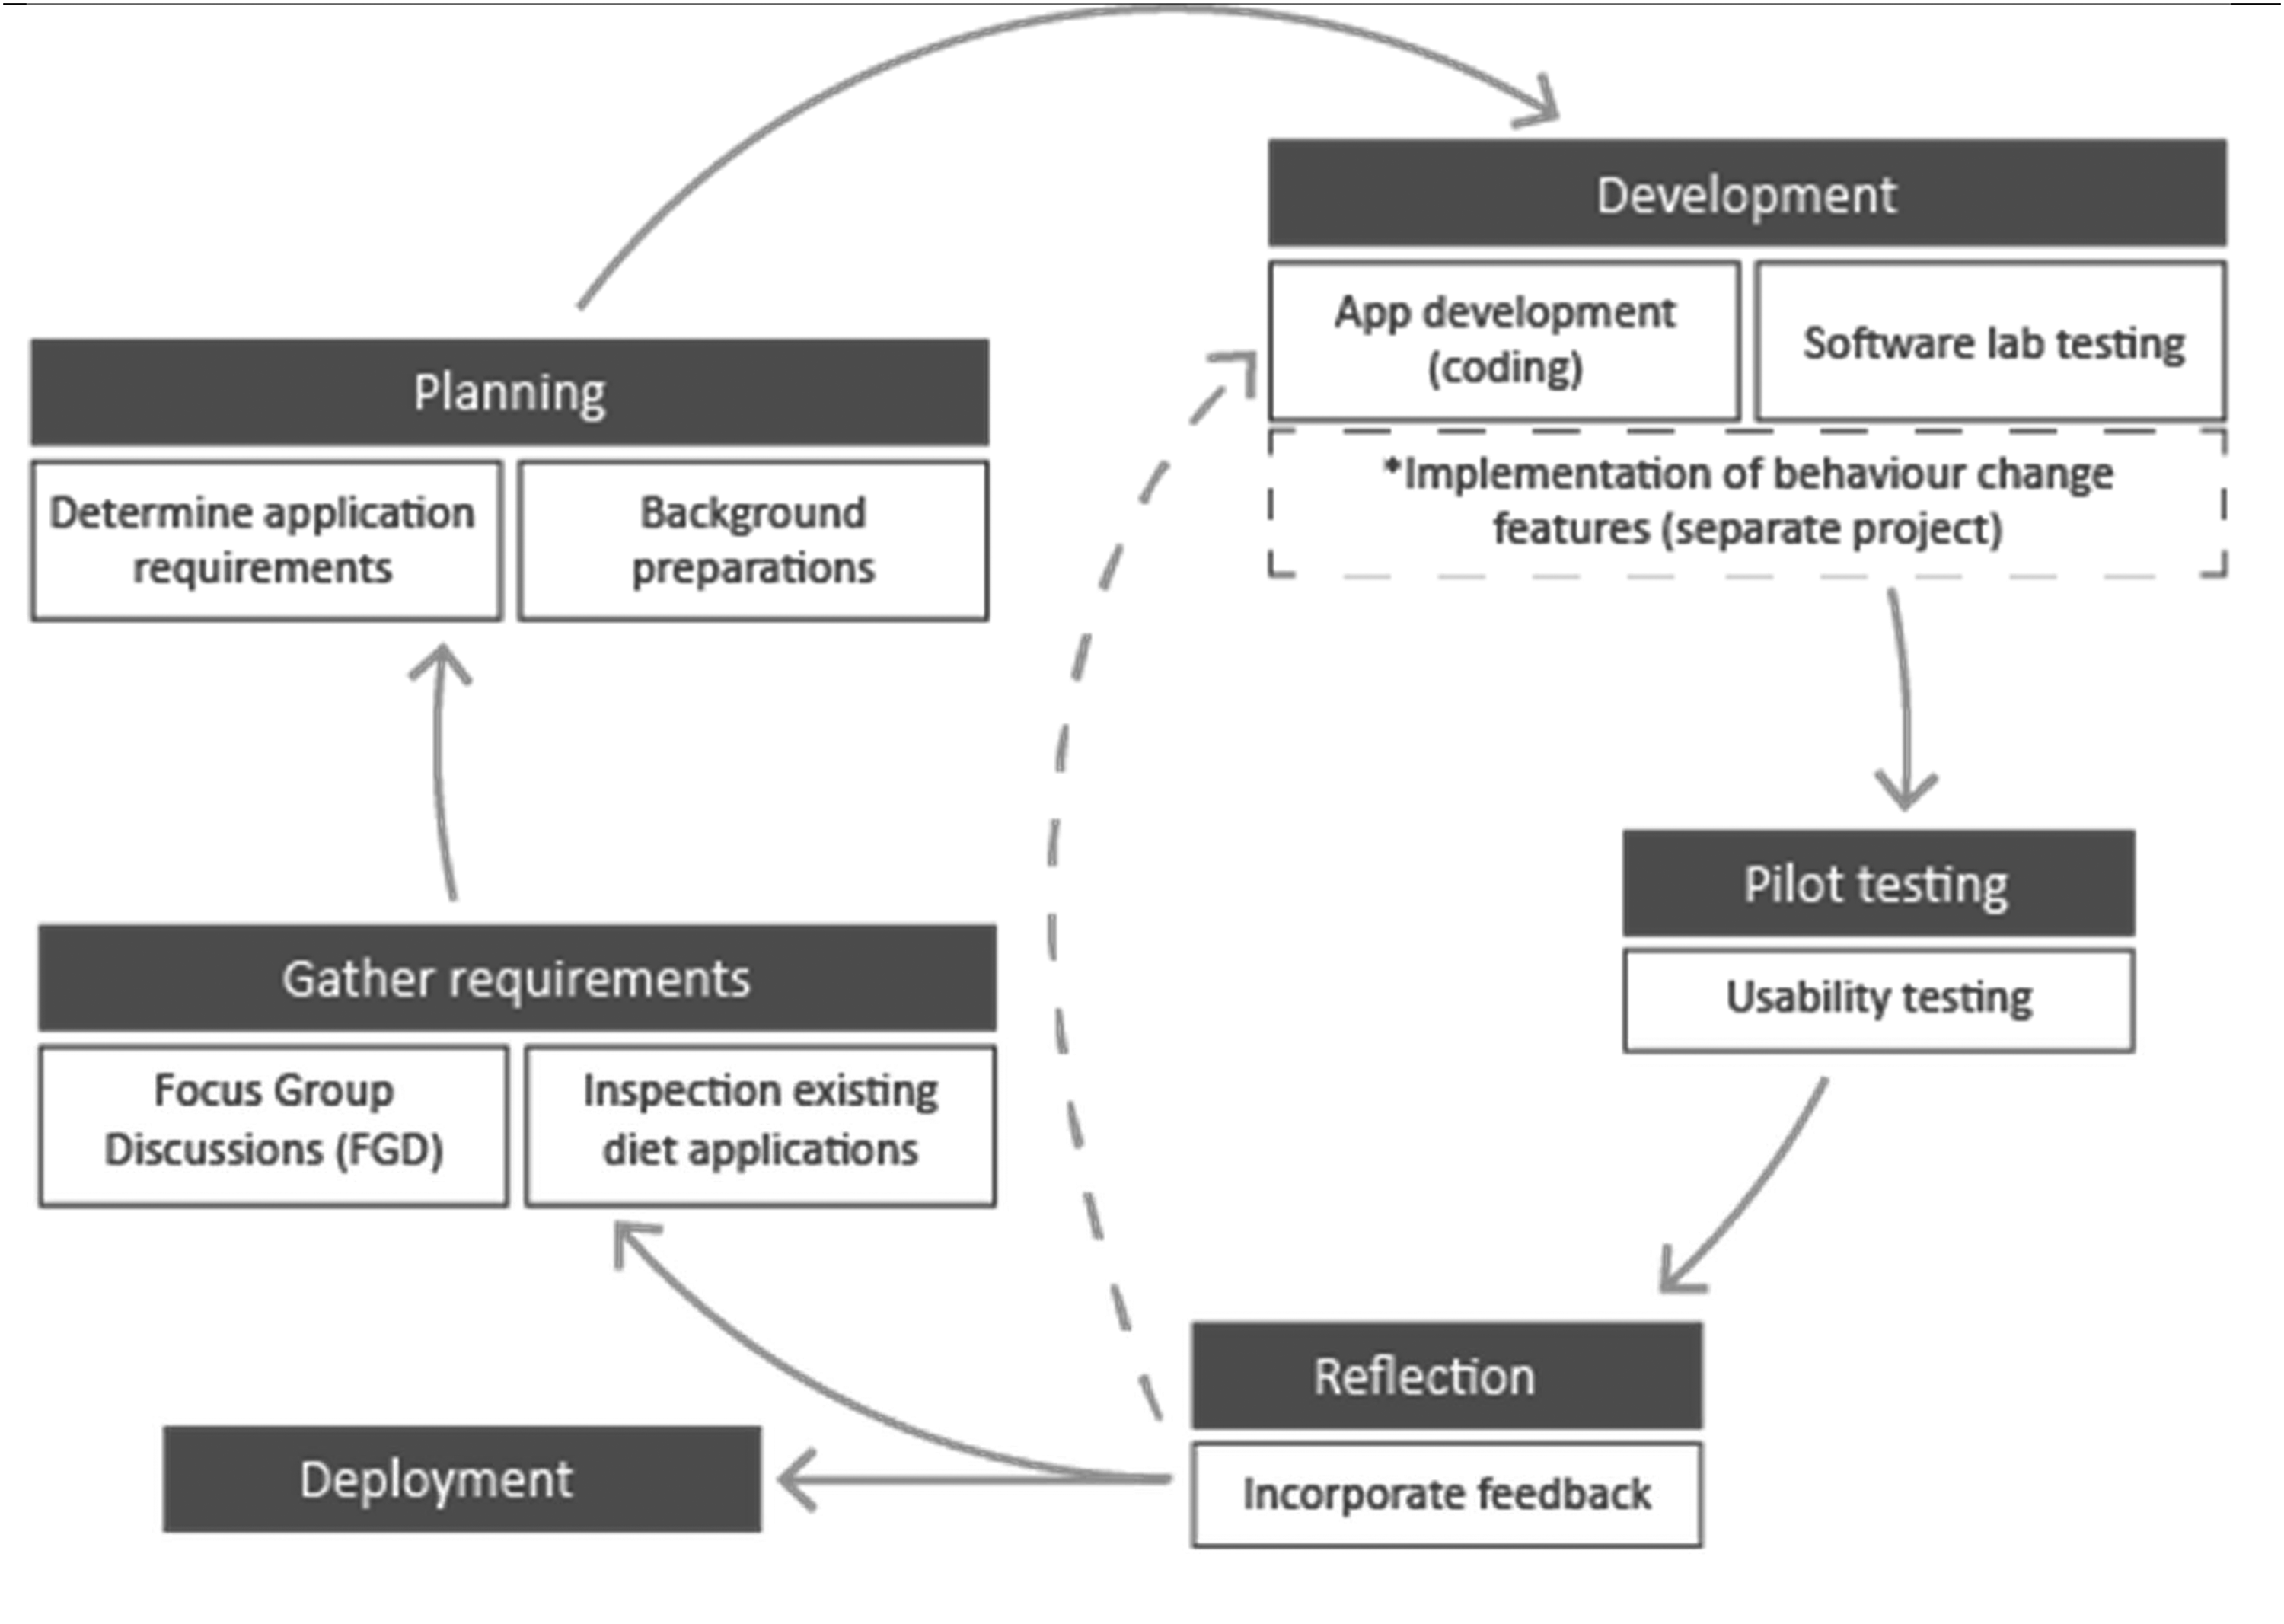
Study flow of MyDietCam development. 23
Gather requirement phase
Focus Group Discussions (FGD). Focus group discussions were carried out among dietitians involved in dietary assessment research and potential users who were healthy Malaysian adults. Six FGD sessions were conducted in total, where the first three were conducted among dietitians while the other three were conducted among potential diet app users.
Two trained research assistants were assigned to conduct and transcribe all six interviews under the supervision of an expert in qualitative research. The discussions were centred around mobile diet applications. Participants were prompted with questions regarding ideal features and issues found in current diet applications and their past experiences using diet-related mobile applications. All sessions were audio recorded and later analysed using thematic analysis with the NVivo software. The findings of the FGD were then used as a guide during the second phase of the study, which is the planning phase, to determine the ideal features to be included in MyDietCam.
Inspection of existing diet applications. Simultaneously, an online search of the literature and existing digital diet assessment and monitoring tools focused on image recognition was conducted. Apps were searched from the two most widely used app stores, which were the Google Play Store and the Apple App Store. Among the keywords used during the search were diet, nutrition, weight loss, calorie tracker, and food recognition. Apps discovered from the app stores were downloaded and the features were compared. However, premium features in certain diet applications that require subscriptions were not examined. Applications or food recognition systems developed through research were mostly unavailable in the app stores. Thus, the features were only documented based on the screenshots and documentation published in the literature. A list and table of comparison among the evaluated apps are shown in Table 4.
A few simple tasks were carried out while comparing the features of these applications. The first task was to sign up and create a user profile. From this step, we could note the availability of some personalisation options, such as goal setting. Next, tests were done by logging meals on the diet apps using the various logging methods and portion size estimation options offered. Subsequently, the type of nutrient analyses provided in the app was assessed through (but not limited to) the display of the progress of calorie intakes, interpretations of macronutrients and micronutrients, options to view and edit past intakes, and trend graphs. On top of that, non-diet-related features were also looked at, such as the ability to link to wearables to track activity. Lastly, apps were checked for their availability on multiple platforms including iOS, Android, or web-based.
Planning phase
Determine application requirements. The steps carried out in the ‘gather requirement’ phase helped to determine the main features of MyDietCam. Personalised recommendations were provided based on the user's gender, age, and physical activity level (PAL) data that were collected upon signing up. Nutrient and calorie recommendations provided were based on the recommended nutrient intake (RNI) Malaysia 2017 24 to accommodate the local population demographics. This latest available guideline comprised recommended intake for energy (kcal) and 29 nutrients. 24
Among the various food logging methods suggested during the FGD, the food recognition method was selected due to the current trends of taking food images before meals. This means that meals would be logged in real-time which eliminates recall bias. At the same time, reducing social desirability bias in contrast with typing or manually recording food intake in a written journal.
Based on our findings from the previous phase of this study, where users question the credibility and localisation of the food database used in diet applications, we have incorporated the national food database, Malaysia Food Composition Database (MyFCD) 25 into MyDietCam. Currently, MyFCD comprises three separate databases, namely ‘1997, ‘current’ and ‘industry’. The ‘1997’ database contains 783 food items with 19 nutrients. The newer ‘current’ and ‘industry’ databases were an updated version of ‘1997’ which is still under development and comprised 1100 food items categorised into 34 specific food groups at the time of writing. Food and nutrients from a locally published book entitled ‘Atlas of Food Exchanges and Portion Sizes’ were also added. 26 We further supplemented the database with food and nutrient data from the Food Composition System Singapore (FOCOS) 27 which contains 2400 food items classified into 25 food groups considering the similarity of cuisines between Malaysia and its neighbouring country, Singapore.
Through the inspection of previous applications, existing applications have yet to provide users with a direct measure of diet quality, as shown in Table 4. Most applications only provided fruit and vegetable intake measures, which were used as a proxy for diet quality. A diet quality score would give an easier understanding of their overall eating habits. Thus, we have equipped MyDietCam with a diet quality score generated from the Malaysian Healthy Eating Index (M-HEI). 28 It measures the degree of compliance of the users with dietary recommendations in the Malaysian Dietary Guidelines (MDG) 29 and the Malaysian Food Pyramid 2020. 30 This index is one of the local indexes of overall diet quality, based on both nutrients and food groups. It comprises seven food groups (cereals and grains; vegetables; fruits; meat and meat products; fish and seafood; legumes; and milk and dairy products) and two nutrients (fat and sodium). The calculation of the M-HEI score can be found in a separate publication. 31 A final score of less than 51% represented a poor diet, while a score ranging from 51% to 80% indicated a diet requiring improvement, and lastly, a score of more than 80% implied a good diet quality. 31
Background preparations. Basic preparations were carried out, such as deciding on the name and logo of the application, designing the interface, and determining the navigations of each function. To launch the novel food recognition feature in the real world, lab training and testing of the system had to be carried out. Standard benchmarks such as FOOD101, 32 UECFOOD100, 33 UECFOOD256, 34 and Pittsburgh Fast-food Image Dataset (PFID) were used. 35 These datasets contain various real-world food images from different sources. To adapt it to the local Malaysian setting, the list of food items from MyFCD was used to crawl images of food items from the internet to train and test the food recognition machine. The action of crawling images refers to using an internet bot to navigate through the world wide web to collect data which is useful in machine learning. 36 A detailed explanation of the development of the food recognition feature used in MyDietCam has been published separately.37,38 The initial lab testing of the food recognition accuracy from these datasets ranged between 74% and 100%.
As for the implementation of M-HEI, 28 the list of food items and meals from the food database were manually assigned to their respective M-HEI food groups based on their classifications in MyFCD. Next, as regular meals typically consist of a combination of food items from multiple food groups, composite dishes were manually coded based on the main ingredients of each dish. Meals that comprise food items from the same food group will remain unchanged. For instance, if a user logs a slice of ‘white bread’ which consists of a single food item from a single food group, scores will be calculated according to the MyFCD grouping which is the ‘cereal and grains’ group. If it was an ‘egg sandwich’, the key ingredients of this dish would be bread and eggs. Thus, the carbohydrate content for the amount entered for this dish would be logged as ‘cereals and grains’ while the amount of protein would be logged under the ‘meat, poultry, and eggs’ group. Alternatively, if it was an ‘egg and prawn sandwich’, the main ingredients would be bread, eggs, and prawn where there is one carbohydrate-based ingredient and two protein-based food items. The carbohydrate content will still be logged under the ‘cereals and grain’ group while an estimated fixed ratio will be applied where ¾ of the total amount of protein logged will be counted under ‘meat, poultry, and eggs’ group and the remaining ¼ of protein will be counted under ‘fish and seafood’ group. Fat and sodium content were included for all the food items in the calculations. Food items with minimal nutritional value such as herbs and spices were omitted from the calculation of the diet quality scores in MyDietCam. It is important to note that these ratios are estimations based on standard portions available in Malaysia. Furthermore, since the calculation of M-HEI is mainly based on food groups, the weight of nutrients provided in MyFCD and FOCOS were converted into serving sizes through fixed equations. The calculation for one serving of each of the seven food groups is shown in Table 1.
Serving size calculations used for m-HEI in MyDietCam. 29

M-HEI: Malaysian Healthy Eating Index. 28
Development phase
Application development. The information gathered and planning of the features implementation led to the development phase. MyDietCam was written in the Kotlin programming language for the Android platform by the artificial intelligence team.
Software lab testing. Once the prototype was ready, initial lab testing of all the features and navigations was done through an Android emulator. The emulator was used to mimic multiple scenarios of using MyDietCam from the various brands of Android devices, Android versions, screen resolutions, and phone models. Testing on Android applications is challenging as many brands of smartphones are running on the Android operating system in the market. Multiple factors may affect how an application operates on an Android device, leading to ‘crashing’ issues. Among the common issues were that the application did not support the version of Android on the device, the version of the application installed was outdated, weak internet connection, or the application did not have access to enough system memory due to limited storage space on the device. 39 Thus, an application can operate differently even when running on the same Android version and identical hardware components if it was a different device. Lab testing was also important to identify if any of the implemented features did not operate as intended.
Pilot testing phase
Usability testing. In a software development process, testing is an unending process because of the many variables that may affect the performance of an application. Through testing in the real world, we were also able to collect data on how the application performed in the hands of different users, brands and specifications of Android devices. Once the software development team deemed the food recognition accuracy to be acceptable and ready for the real world, usability testing was conducted among 30 students from a local institution. These participants were required to log their meals for a total of six days through MyDietCam. Participants were provided with a step-by-step tutorial in a PDF document for each feature upon signing up. At the end of the six days, participants were required to fill in the Malay mHealth application usability questionnaire (M-MAUQ)40,41 along with two additional questions requesting their feedback and experiences while using the application.
The mHealth application usability questionnaire (MAUQ) was developed by Zhou et al. 41 in 2019 to assess the usability of mHealth apps. There were four versions of the MAUQ according to the type of the app (interactive or standalone) and the target users (patient or provider). The standalone patient version of the MAUQ used in this study comprises 18 items and is grouped into three domains ease of use, interface and satisfaction, and usefulness. The M-MAUQ used in this study is a translated version of the standalone patient version in the Malay language and has been validated among Malaysian adults by Mustafa et al. 40
Statistical Package for Social Sciences version 23.0 software (SPSS) was used to analyse the descriptive statistics used in reporting the demographic characteristics of the sample as well as the usability (M-MAUQ) scores. The diet quality (M-HEI) scores were also reported through descriptive statistics. Data collected from the issues and suggestions brought up by participants were grouped and tabulated in Microsoft Excel.
Reflection phase
Incorporate feedback obtained from testing. Throughout the testing phase, issues, and suggestions regarding any aspect of the usage of the application were collected and grouped. Discussions with the technical team were carried out regarding the feasibility of incorporating the suggestions while considering the study objectives and target population.
Ethics
Ethical approval from the University of Malaya was applied and approved under the reference number: UM.TNC2/UMREC–824.
Results
Gather requirement phase
Focus Group Discussion. The first three FGDs conducted among the dietitians had 6, 5, and 8 participants per session. The remaining three FGDs were conducted among potential users with 6, 6, and 5 participants per session. The majority of participants comprised Chinese females. Table 2 presents the demographic of the FGD participants.
Demographic of FGD participants.
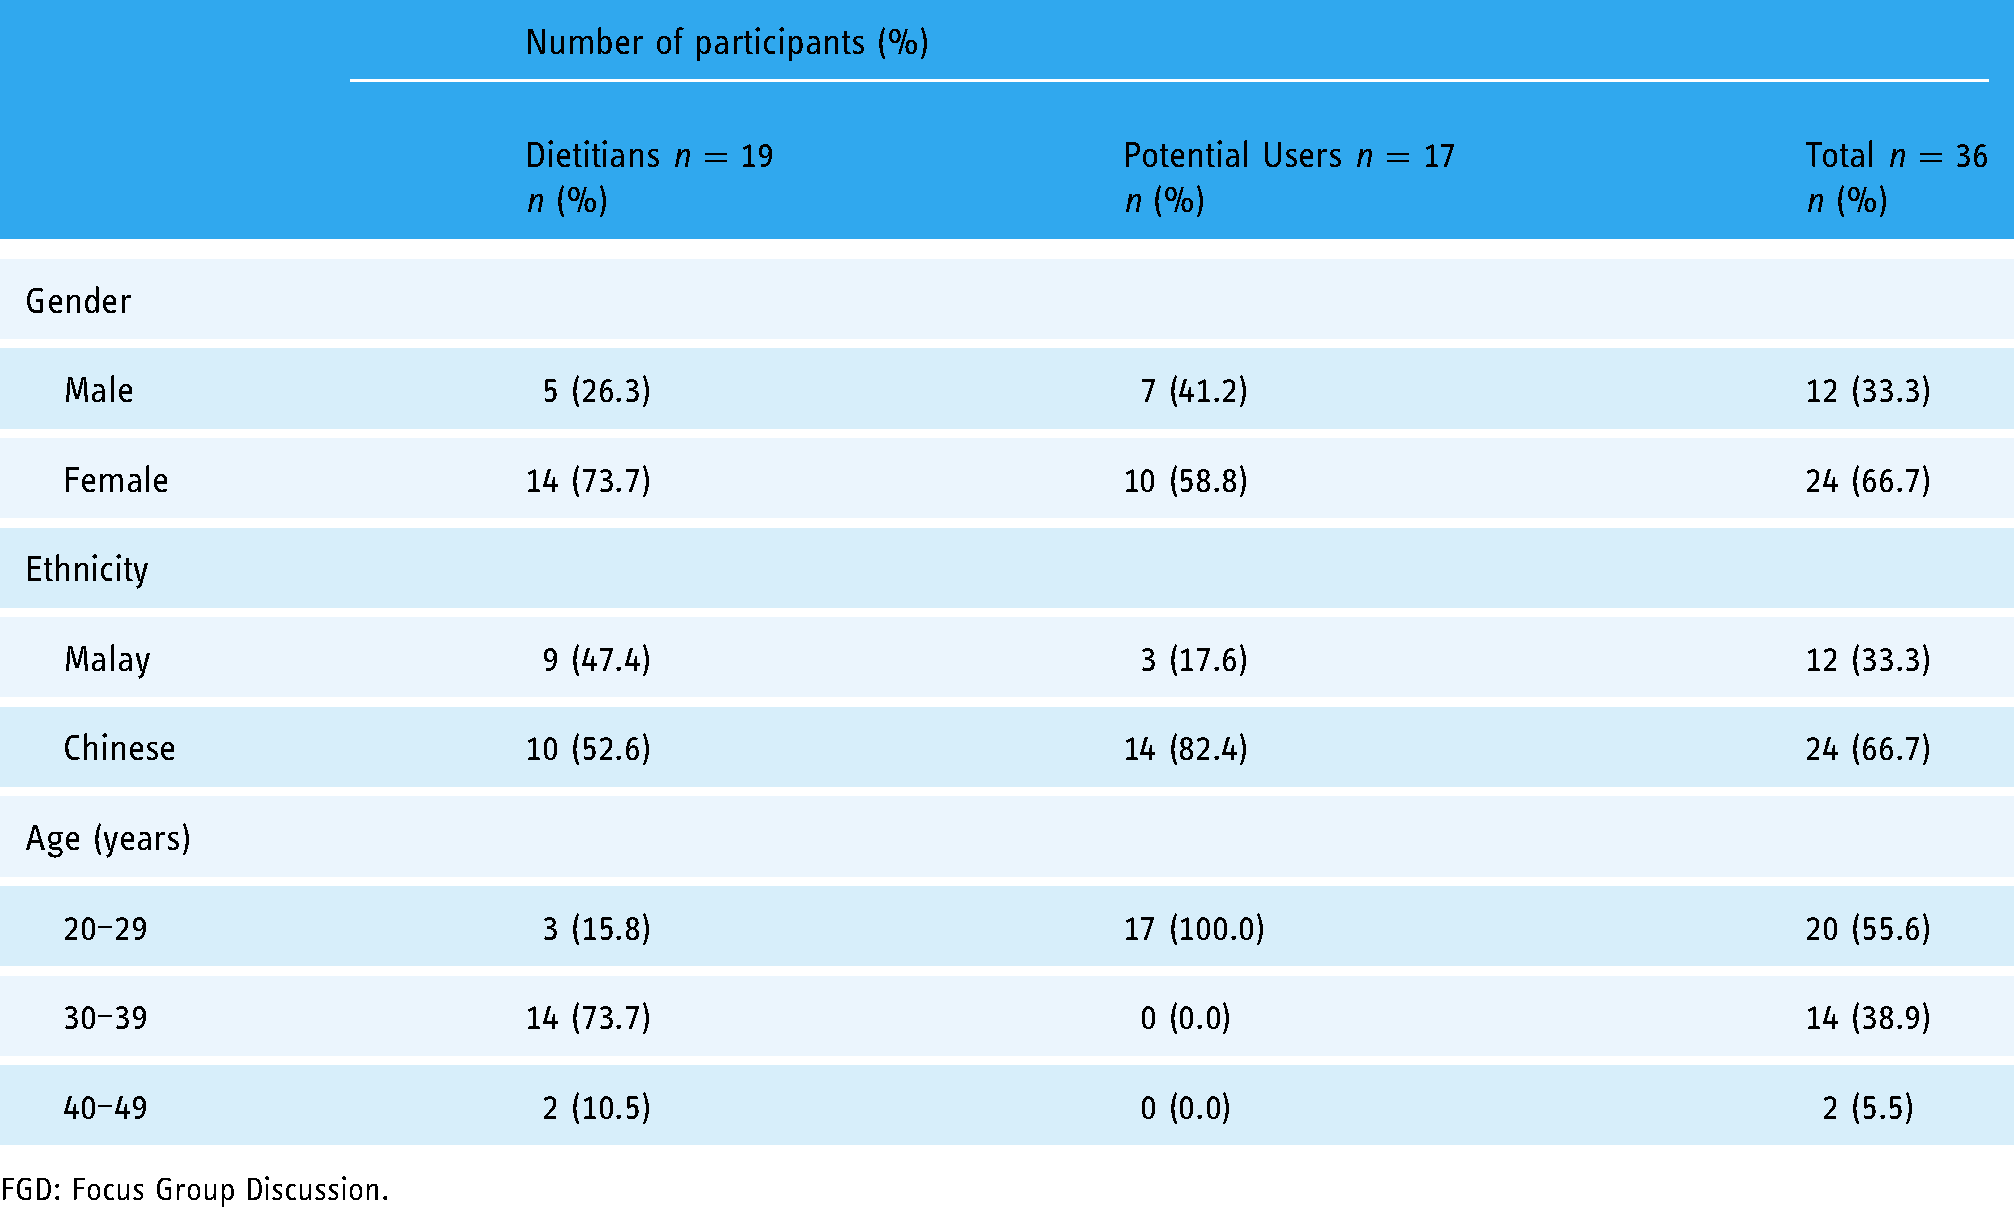
FGD: Focus Group Discussion.
Five main themes emerged from the discussions (a) personalised recommendation options, (b) methods for food logging, (c) food database and portion size estimations, (d) nutrient summaries, and (e) general and technical issues. Table 3 summarises the findings from the six FGDs.
Findings from the FGDs on needs in a mobile diet application.

*Suggestions that were not incorporated into MyDietCam; FGD: Focus Group Discussion.
Personalised recommendations
During FGDs, participants were asked about ideal features of a diet application. The most common answer was providing individualised dietary recommendations such as recommended daily calorie and nutrient intakes and the link between users’ biochemical data with their dietary intake. Dietitians suggested providing users with health tips relevant to their current diet intakes. In contrast, potential users requested to reduce notification frequencies through the freedom to set the timing and frequencies of the alert as compared with currently available diet applications.
Food logging methods
Participants were quite fond of using newer methods of food logging (apart from the regular text entry). Ideally, users would prefer if calories and nutrients of the foods could be automatically measured from a single photo. While this suggestion greatly reduces the burden of diet monitoring, no one has yet to implement this feature in the real world successfully. Other suggestions for food logging methods include speech recognition, a list of commonly consumed foods, location-based monitoring, and barcode scanners.
Food database and portion size estimations
Regarding the food database used, dietitians and potential users preferred the diet app to contain a comprehensive food database that includes localised data and nutritional supplements. On top of that, dietitians suggested allowing researchers to update the food and nutrient databases whenever required. As for portion size estimations, most participants agreed that portion size guides should be provided to ease the portion size estimations and offer end users the freedom to select their portions in terms of grams or household measures instead of fixed standardised portions.
Nutrient summary
During the interviews, participants were asked to discuss the types of nutrient summaries and analyses to be provided. Participants predominantly requested for visual breakdown of key nutrients, including calories, macronutrients, and micronutrients. Suggestions were also given to limit micronutrient information as it may seem overwhelming to users who are just getting started, but potential users also suggested presenting information using the traffic light system instead of numbers. The dietitians proposed to provide interpretations of reference and recommended values to guide users in understanding the nutrition data better. Lastly, the ability to refer or view what the users had consumed in the past would also be a pleasant feature to be added.
General and technical issues
Participants expressed a need for diet applications to utilise large, clear, and neat icons with minimal word usage in addition to provide users with a tutorial guide. Dietitians voiced out about current diet applications containing misleading information, while potential users talked about the inconvenience of having to key in every single meal. Potential users prefer a more pleasant user experience through minimal delays, crashes, and offline availability. The outcomes from the FGDs in Table 3 under the ‘gather requirement’ phase were used to guide the features that would be incorporated in MyDietCam.
Inspection of existing applications. Of the ten apps that were surveyed through literature and the two main app stores (Apple App Store and Google PlayStore), Healthy365 (Food AI), 17 Im2Calories, 42 DietCam, 43 and Snap-N-Eat 44 were the few discovered through the literature, while MyNutriDiari 2, MyFitnessPal, FatSecret, Lose It!, Calorie Mama, and DietCamera AI were apps found from the app stores as shown in Table 4. These apps were chosen as the focus because they had food recognition capabilities. Apps found through the literature were not tested as they were mostly unavailable in the app stores of the authors’ region. This explains the features labelled as ‘unclear’ in Table 4 as the features were only determined through app screenshots or documentation in published literature. Certain features in DietCamera AI were also labelled as ‘unclear’ due to the language barrier of the app being in the Korean language. The focus of research-based apps was mostly on the novelty involved and not the other features of a typical diet application. This explains the reporting of the number of food items that can be recognised by the food recognition system accurately as shown in Table 4. As for DietCam, the uniqueness is the instant generation of estimated calories and nutrients of a dish from a single video. If this feature is done accurately and covers an extensive list of food items in the real world, it would remove a huge barrier in dietary monitoring from manually estimating food portions of each food item in a dish.
Comparison of available features between diet applications.

*Applications from app stores; ✓ available; ✗ unavailable; ○ unclear; iOS: iPhone operating system; aNutrition Division, Ministry of Health Malaysia; bMyFitnessPal, Inc.; cFat Secret; dFitNow, Inc.; eAzumio Inc.; fDoingLab Inc.
Alternatively, for commercially available apps in app stores, it is mainly developed by private app development companies. It may not be necessarily developed by experts in the field and that may result to provision of inaccurate information in the app as highlighted by the dietitians during the FGD (Table 3). These apps usually contain more features compared to research-based applications, which is evident from the personalisation options and nutrient analyses in Table 4. Every commercial app allows for at least a personalisation option and is available on the two main app stores (Apple App Store and Google PlayStore). These apps also contain more detailed nutrient analyses that are either freely available or made available through a premium user subscription. All the commercial apps inspected allow users to log food items through text input and alternative options. MyFitnessPal, FatSecret, and Lose It! provide users with a barcode scanner which is very effective for retail items. Besides, their food recognition features are also still in the early stages, requiring human input to confirm the detected food items and manual portion size entries. Regarding the domains featured, none of the other inspected applications provided a diet quality score or any other measures to help users understand or summarise their daily nutrient data in a way that is easier to understand. Table 4 summarises the available features and the differences between apps found through literature searches and apps from app stores.
Planning phase
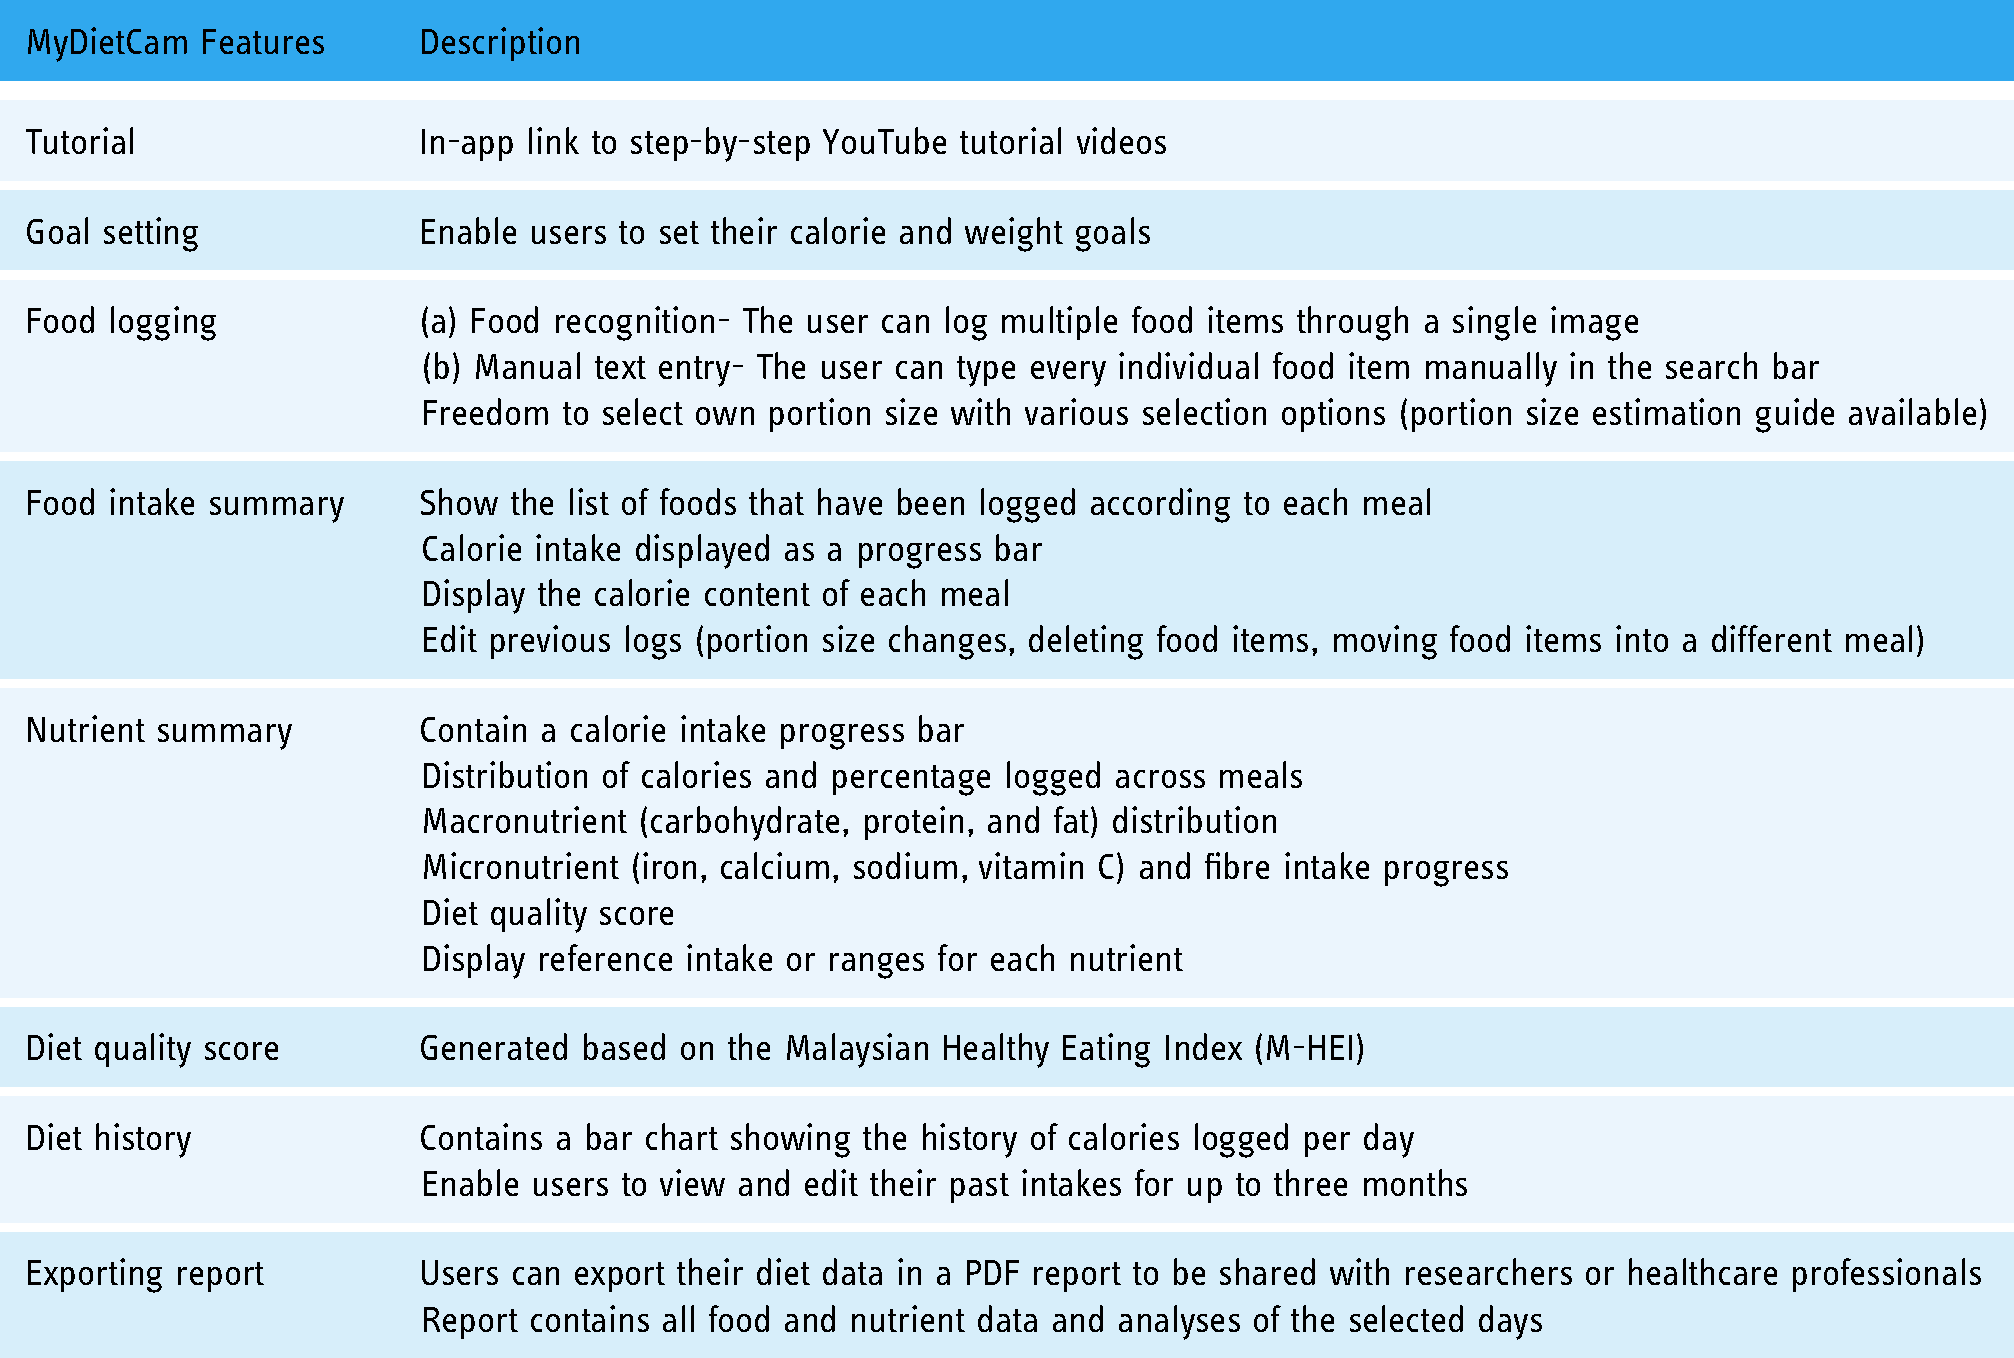
Based on the findings from previous phases and discussions with the research team, features of MyDietCam were determined in line with our research objectives and target population. The list of decided features and brief descriptions for MyDietCam are listed in Table 5.
List of features with descriptions in MyDietCam.
Development phase
The MyDietCam features presented in this section are results from the development phase. The development of the goal-setting features that allow users to set their calorie and weight goals resulted in two main screens named ‘User Profile’ and ‘User Goal’. Figure 2(a) shows the ‘user profile’ screen where users enter their gender, age, weight, height, and activity level. This would partially determine the calorie group they will be placed in. Figure 2(b) shows the ‘user goal’ screen for users who intend to lose or gain weight through calorie modifications. Users will be able to select their weight goal, the intensity of their calorie modifications, and the estimated target date to achieve their weight goal.

Mydietcam screenshots of user profile and user goal.
As for the food logging process, Figure 3 shows the steps to log foods through the food recognition feature in MyDietCam (a) user selects one of the six meals from the dashboard; (b) tap on the camera icon; (c) tap on camera shutter button after ensuring food item is in the frame; (d) image will be sent to an online recognition server where the user will be presented with the top three predictions. User selects the correct prediction; (e) adjust portion size and save food item at the bottom of the screen.
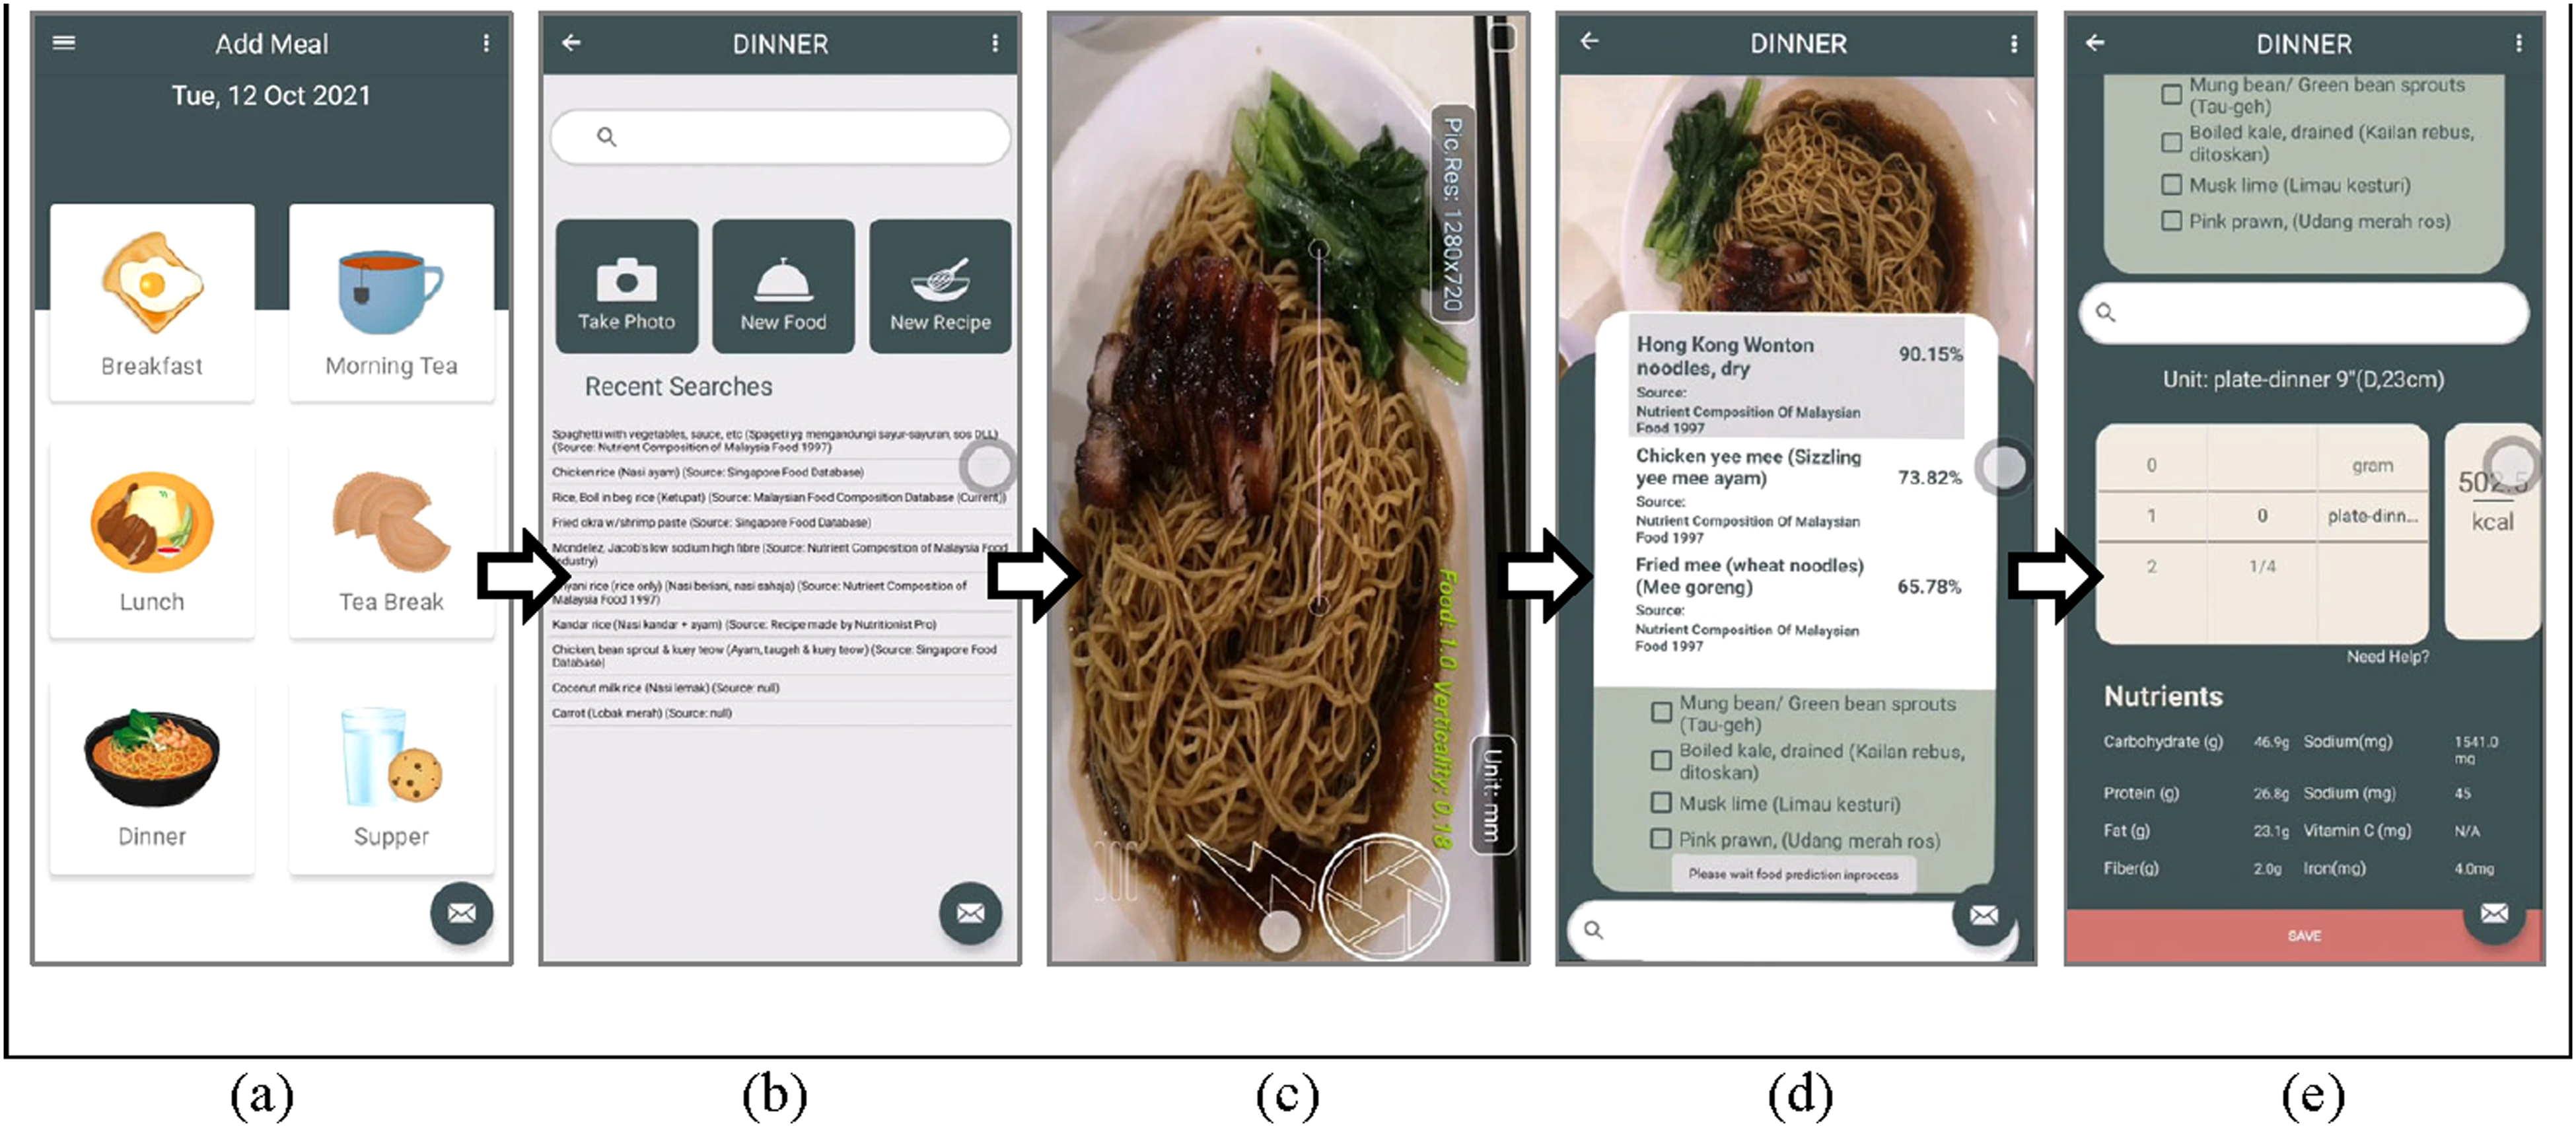
Flow of MyDietCam food logging process through image recognition.
Lastly, Figure 4 presents the nutrient summary features in four different screens. Figure 4(a) shows the food intake summary (Food Diary) screen where users can see their calorie intake progress. The bar will turn red if calorie intake exceeds the calorie goal. The list of food items and their calorie values for each meal is presented on this screen. From here, users can click on any food item to modify the log by deleting the food, changing the portions, or moving the item to a different meal. Figure 4(b) is the nutrient summary where colour-coded pie charts illustrate the distribution of calories across the different meals of the day and the macronutrient (carbohydrate, protein, and fat) distributions. Recommended values are also shown on the screen for the user's reference. Information on micronutrients (sodium, calcium, iron, and vitamin C) and fibre are presented in a table that shows their current intake, reference goal, and the difference between the values. The diet quality screen (Figure 4(c)) shows the breakdown of the intake progress of each food group and nutrient required for M-HEI calculation. Lastly,Figure 4(d) shows the diet history that displays the user's past 7-day calorie intake by default. Users can enter a customised date range to change the bar chart display. The bottom of the screen shows the calculated values of the highest, lowest, and average calorie intake for the selected date range.
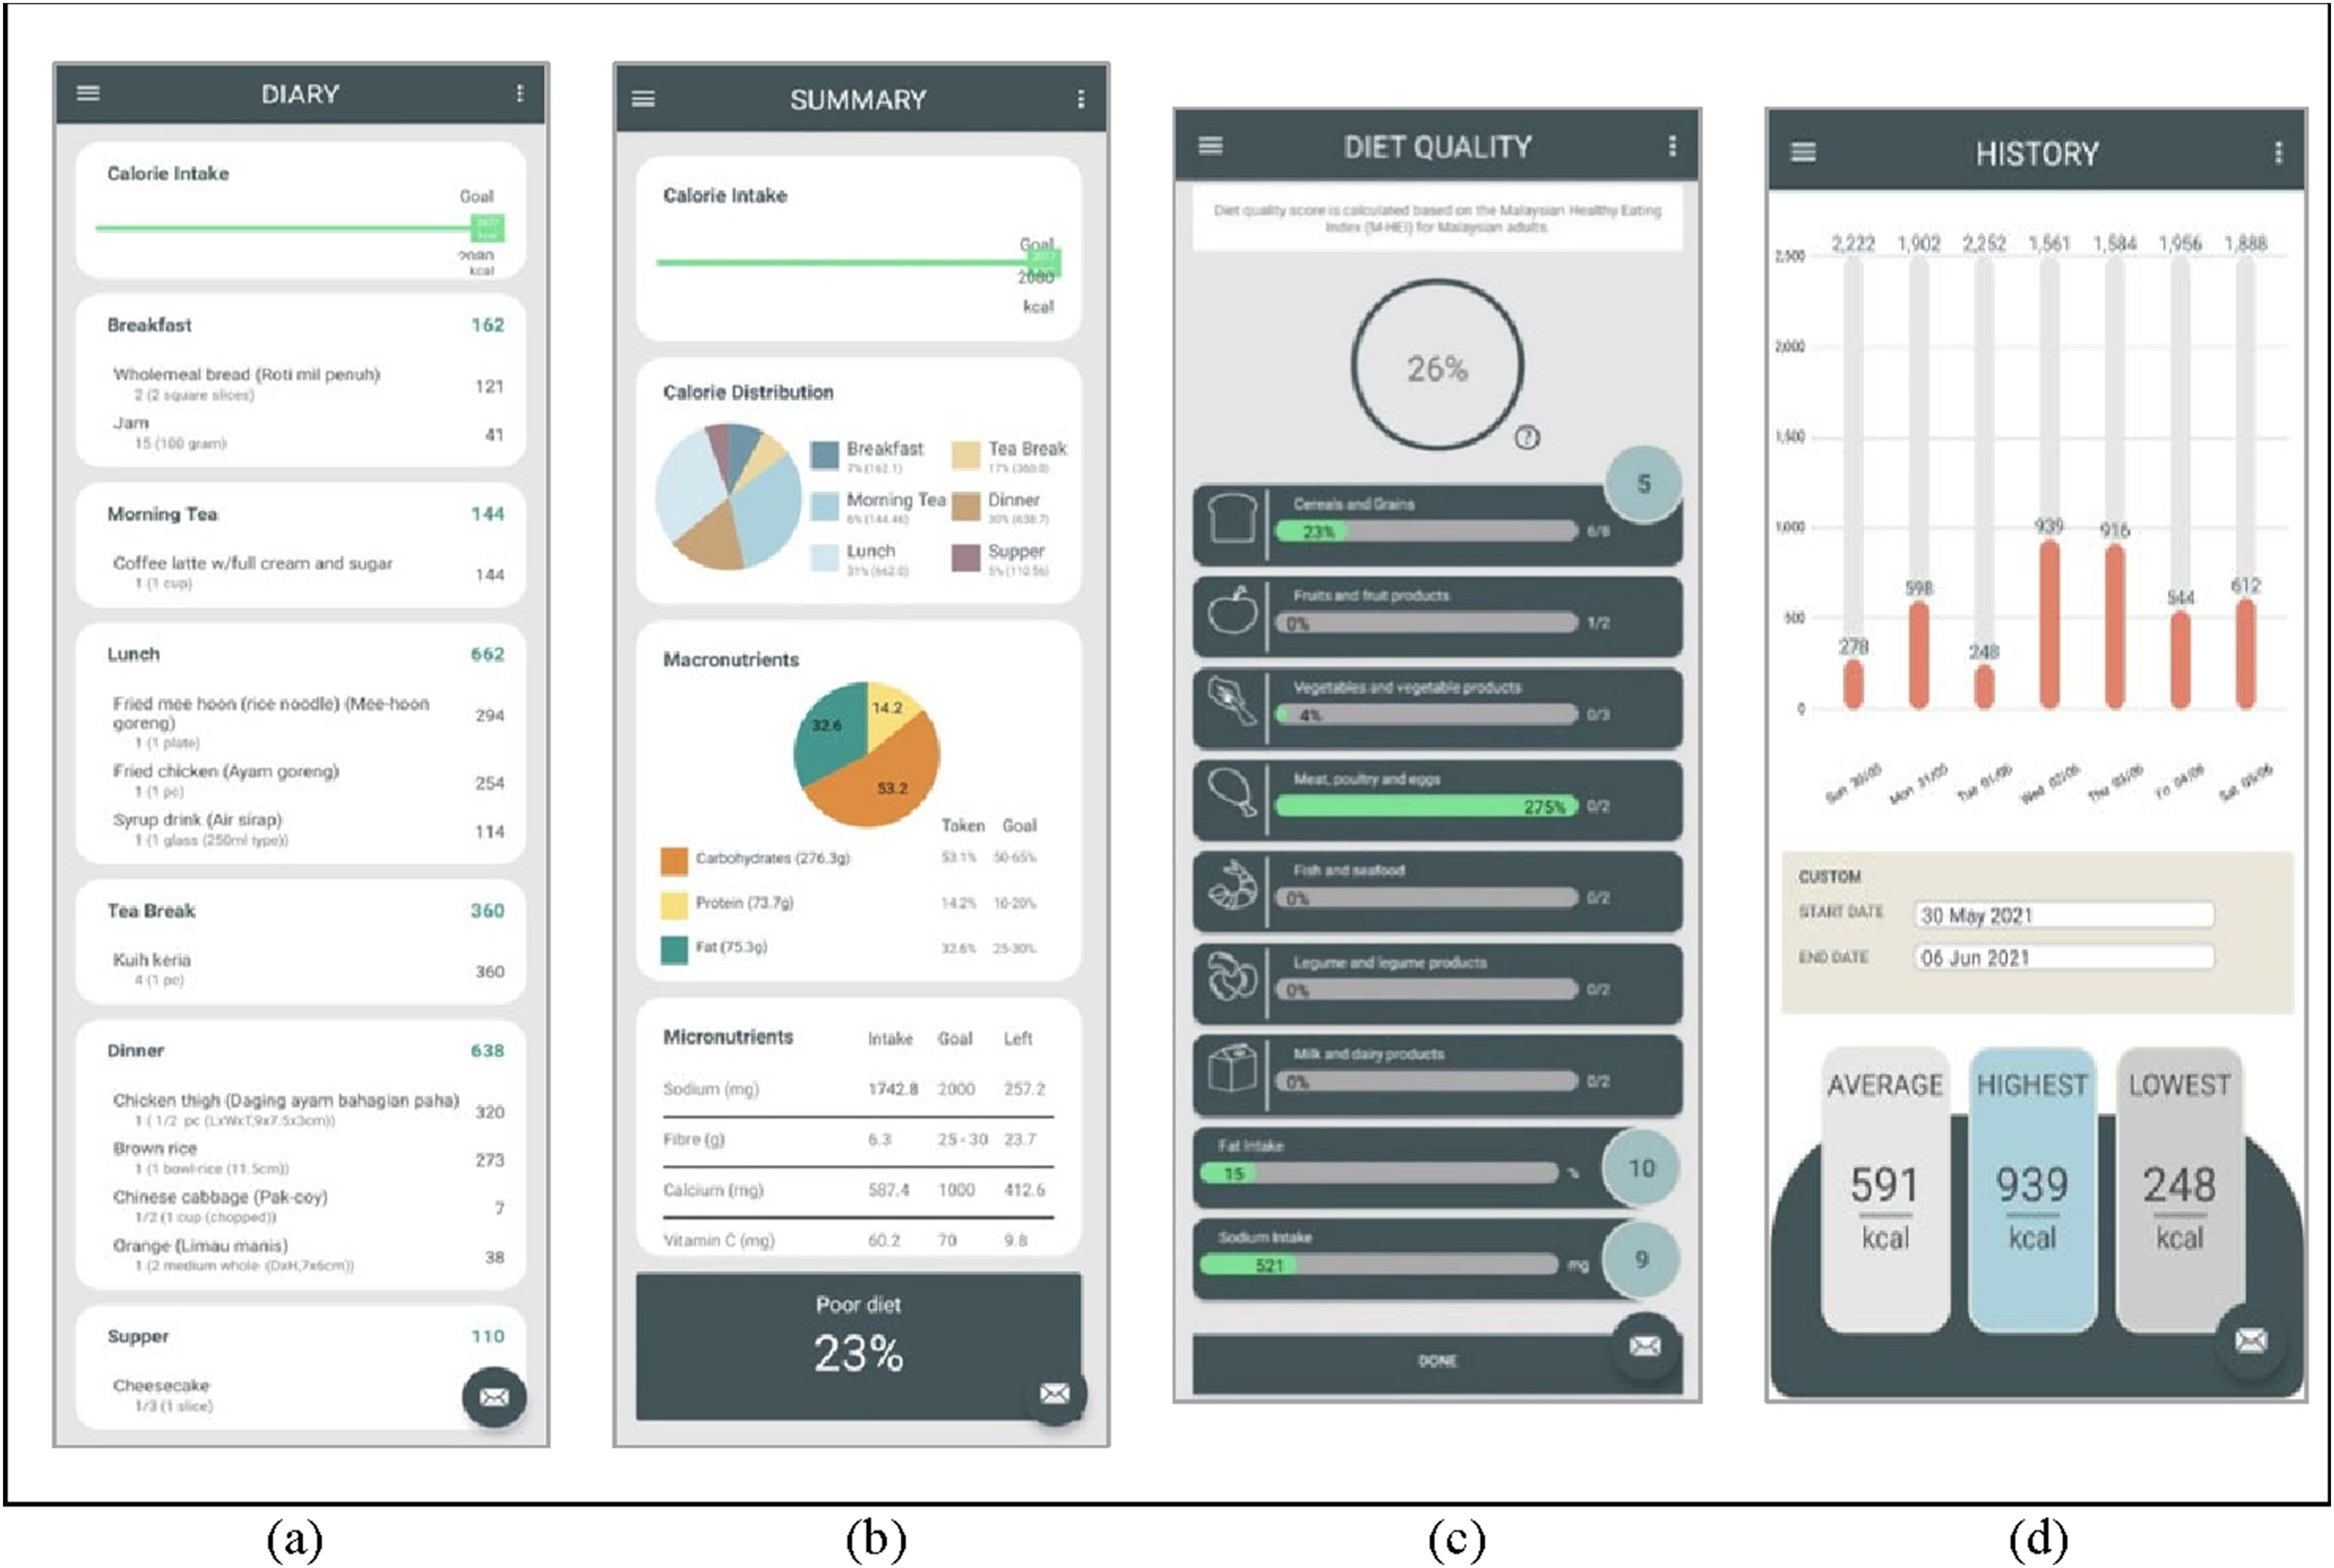
Mydietcam screenshots of (a) food diary (b) nutrient summary (c) diet quality and (d) history.
Pilot testing
Usability testing. A total of 30 students from a local institution were recruited for the usability testing. The majority of participants were between the ages of 21 to 25 (43%), females (70%), Chinese ethnicity (60%), currently pursuing their bachelor's degree (73%), and staying off-campus (73%) (Table 6).
Demographics of participants from usability testing.

Table 7 shows the breakdown of the M-MAUQ scores by domain and of each statement (in English). The Malay version of the statements used in the study is attached as a supplementary file. Mustafa et al. 40 stated that a M-MAUQ score of more than four is deemed to be user-friendly. An overall usability score of 5.13 ± 1.15 out of a maximum score of seven was reported, with the highest scoring domain being Domain 3: Usefulness (5.17 ± 1.17) followed by Domain 1: Ease of Use (5.14 ± 1.19) and lastly Domain 2: User Interface and Satisfaction (5.10 ± 1.22). The 13th statement, ‘The app would be useful for my health and well-being’ scored the highest at 5.93 ± 1.36 while the 17th statement, ‘I could use the app even when the Internet connection was poor or not available’ scored the lowest at 4.3 ± 1.6.
Mean M-MAUQ scores.

M-MAUQ: Malay mHealth Usability Questionnaire; ascores range from 1(low usability) to 7 (high usability), scores above 4 are considered acceptable usability; 40 mHealth: mobile health.
The key issues and suggestions from the usability testing are reported in Tables 8 and 9, respectively. The main issues identified by the users were the constant crashing and lagging while using the application (40%) and limited food items in the database (30%). One of the lowest reported issues was the inability to use the application without an Internet connection (10%) and the absence of in-app reminders to log food items (10%). Likewise, the main suggestion was to expand the available choices in the food database (30%) followed by suggestions to improve and ease the portion size estimations, especially for foods eaten at restaurants (20%).
Key issues identified from usability testing.

Frequency % is calculated based on the number of participants (n = 30).
Suggestions provided through usability testing.

Frequency % is calculated based on the number of participants (n = 30).
Discussion
Summary of main findings
To our knowledge, MyDietCam is the first diet application in Malaysia to be incorporated with the food recognition feature in addition to the instant generation of diet quality scores. Individualised recommendations, food logging through food recognition to reduce steps for data entry and provide detailed nutrient analyses through visuals were the main features developed for MyDietCam based on the ‘gather requirement’ phase. An average overall usability score of 5.13 out of a maximum of 7 was reported from the M-MAUQ demonstrated that MyDietCam was usable.
Mydietcam features
This article describes the process of developing MyDietCam and provides a detailed explanation of each feature that was decided based on FGDs and inspection of previous applications. One of the issues brought up by the potential users during the FGD was the high user burden of having to record foods for every meal. This cannot be avoided due to the intra-variability of consumption among individuals. Previous researchers have tried to overcome this through passive monitoring by inventing wearable devices such as eButton. 45 It requires users to wear a chest device that photographs foods every 2 seconds during eating occasions to track their intake and provide nutrient estimations after. However, issues concerning privacy, obstruction of normal daily activities and the unpleasantness of the wearable design remain. Thus, with all these considerations and technological advancements, we could only try to lessen the barriers of dietary monitoring by developing a diet app with a food recognition feature with acceptable usability.
The most important part of dietary monitoring would be the logging of food items. From the FGDs, dietitians and potential users suggested various methods of food logging, including food photos and automated food recognition, automated portion size estimations, barcode scanners, speech recognition, and location-based food recommendations. While all these were good suggestions, it can be challenging to incorporate all of these into a single application. With current resources, capabilities, and trends of capturing food images before meals, we focused on implementing an automated food recognition feature that provides instant calorie and nutrient analyses in a mobile application where most people already carry a smartphone with them every day. Additionally, the field of image recognition is still relatively new especially in food recognition. As stated by Turner et al.,46,47 novelty may play a role in reinforcement learning and reward processing which could improve adherence and engagement in a weight loss intervention.
In comparison, previous image-based applications only enable users to upload or save food images in the app without the food recognition feature. This means that food items are not labelled and provided with nutrient data. Some applications get feedback from online crowdsourcing or diet coaches which require waiting time. 48 More recent applications can now provide the automation of generating nutrient data which standardizes the data collection process and eliminate the manual coding process. 49 Martin et al. 50 even tried automating an additional step which is the portion size estimations by preparing a dataset of food images with various portion sizes for each food item. However, the preparation of a myriad of food photos with various portions beforehand would take a lot of manpower before it can be practical in the real world. Results from existing studies developing food recognition systems reported the ability to identify 15–250 types of foods accurately.44,51,52 Although this seems like a remarkable achievement in the field of artificial intelligence, dietary assessment research studies indicate that it is still impractical for use in the real world.12,53 MyDietCam aims to be able to visually recognise 775 different food items accurately upon deployment. 38 As the user base grows, leading to more food images being uploaded to the server, it will continue to help and train the machine to recognise more foods collectively. A high accuracy of food recognition in the real world will also serve as a stepping stone to implementing the automated portion size estimation feature.
Currently, features in MyDietCam are only available in English due to manpower, validation, and time constraints. However, most food items’ names are available in both English and Malay due to the national food database (MyFCD) being used. In the future, our team is interested in translating the whole app into the Malay language which is the national language of Malaysia to improve accessibility and provide alternatives for the users. As for the inclusion of nutritional supplements in the food database, there is currently no local data on the list of available supplements with their nutrient contents. The suggestion to track water intake was omitted as it will only add to the initial burden of increasing frequencies of daily logging.
Subsequently, there were a few suggestions for incorporating educational elements into MyDietCam as listed in Table 9. Both researchers and users would prefer if diet-related disease information were provided and suggested collaborations with other health-related applications to offer rewards as well as educate about other health measures beyond calories and nutrients such as blood pressure, blood glucose, physical activity, and stress levels. On top of that, potential users suggested labelling foods with certain health risks such as foods with high purine content, high phosphate, and high glycaemic index, and providing cooking-related information such as healthy recipe modifications. Most of the suggestions were focused on the diseased population, which is not MyDietCam's target population. It is crucial to stay on track with the agreed application outcomes designed for the target population. 23 At the same time, too much information in a single application may cause information overload among the users which leads to frustration and stress while using the application. This will then lead to reduced usage of the applications. 54
Lastly, there were also recommendations to provide two-way communication between healthcare professionals through the application. Although evidence has shown that there have been positive outcomes through online communication with healthcare practitioners, 55 there are still issues relating to manpower and collaboration.
Pilot testing
The overall average usability score calculated from the M-MAUQ is 5.13 ± 1.15 out of a maximum of 7, which is considered usable. All three domains scored similarly, with the third domain (usefulness) scoring the highest at 5.17 ± 1.17. This shows that the app serves its intended purpose of tracking and monitoring food intake. The M-MAUQ was used in this study instead of other scales such as the mobile app rating scale (MARS) 56 or the user mobile app rating scale (uMARS), 57 as the MARS was developed to target experts in the field to identify high quality apps in their field. While the uMARS was developed for the general population, both MARS and uMARS were not specifically designed to study usability with end users of the applications. 41 Another common tool used in usability studies is the System Usability Scale (SUS). 58 As the name suggests, this tool was developed to test desktop systems and applications and not specific to mobile health applications. 41
More improvements can still be made to enhance the ease of use, user interface and satisfaction before deployment. None of the team members had past experience in user interface design which led it to be the lowest scoring domain during testing. User interface plays a big role in the usability of an application as it affects user experience and adherence. 59 A more pleasant user interface accomplished by highly skilled developers would lead to better usability and vice versa. Developers from research institutions usually have less experience in user interface design as compared to developers from private app development companies which may lead to poorer usability experience. 60 It was also impossible for the application to be used without the internet as all the information was stored in online servers. The application will take up too much storage space if stored in the device which is less desirable.
Based on the feedback, users’ primary concern was that the application crashed too frequently (40%). This issue has been expected because of the various Android devices that may affect the compatibility of the applications. We have managed to solve most of the errors causing the app crashes. Participants who joined later in the study no longer face crashes as frequently. Another main concern was the limited food database. However, this may be due to issues relating to the search feature where the exact spelling of the food item in the database has to be typed for the results to appear. Consequently, as mentioned in the suggestions by the users in Table 9, a recipe builder will be incorporated in the future to enable users to log their own food items that are not available in the database. A dietitian or a trained professional will be assigned to monitor the data added before being made available to the other users in the existing database. As for easing portion size estimations, a more detailed guide will be provided that includes the volumes of each household measure to have a better picture of the size of the mentioned household equipment.
Strengths and limitations
In addition to the technological advances over traditional pen and paper methods, one of the major strengths of MyDietCam is that it is the first Malaysian mobile diet application incorporated with food recognition technology aimed at general healthy adults. The instant generation of an overall diet quality score is also one of the main novelties of this application. This study is also among the few studies that implemented the food recognition feature in real-world studies. The usability testing results from this study have also shown that the initial prototype of the application is above the cut-off scores of being usable.
The limitations during the development process include the study participants from the FGD where it was a small sample conducted in a university setting. Although the age range of the participants covered MyDietCam's targeted age groups, the participants all comprised highly educated individuals with a nutrition background. Additionally, participants were all residing in the Klang Valley, and thus do not generalise to residents from other regions in Malaysia where different cultures and cuisines are observed. Besides, premium or paid features from commercial-based applications were not examined during the inspection of previously available applications. In terms of the application, it requires a stable internet connection to log food items as it is connected to an online server. The food and portion options from the food database may be outdated but it is currently being updated. As reported previously, keeping food databases updated is an ongoing challenge, especially with the rate of new commercial food products.61,62
Future implications
One of the main considerations for the future based on the suggestions from the usability testing would be to expand the food database to include more food items. A wide variety of food choices enables users to log their diets more accurately instead of logging items closest to what they have consumed. Based on our findings, it is recommended for the food database to be updated and tested in a diversified population with different age groups and education levels. The food recognition accuracy has to be further improved through more training and testing especially in the local context.
Conclusion
With an overall initial usability score of 5.13 out of 7.00, the development of MyDietCam may be able to reduce the barriers to dietary monitoring through the use of technology for the intended population. The selected available features may also guide users to make more informed choices regarding their food intake. The application may be useful in monitoring diet quality and weight control and, preventing the development of diet associated chronic diseases.
Supplemental Material
sj-docx-1-dhj-10.1177_20552076221149320 - Supplemental material for MyDietCam: Development and usability study of a food recognition integrated dietary monitoring smartphone application
Supplemental material, sj-docx-1-dhj-10.1177_20552076221149320 for MyDietCam: Development and usability study of a food recognition integrated dietary monitoring smartphone application by Nadine Alvina Kong, Foong Ming Moy, Shu Hwa Ong and Ghalib Ahmed Tahir, Choo Kiong Loo in Digital Health
Footnotes
Acknowledgements
The authors would like to thank all the research assistants and participants from the University of Malaya for their contributions and participation in this study. We would also like to acknowledge the guidance in FGDs by Dr Ng Lee Luan.
Author contributions
All authors were involved in the conceptualisation and the study design, mobile app design and features.
Declaration of conflicting interests
The author(s) declared no potential conflicts of interest with respect to the research, authorship, and/or publication of this article.
Ethical approval
Ethical approval was granted from the University of Malaya Ethics Committee (Reference number: UM. TNC2/UMREC–824).
Funding
The author(s) disclosed receipt of the following financial support for the research, authorship, and/or publication of this article: This work was supported by the Impact Oriented Interdisciplinary Research Grant, (grant number IIRG 002A-19HWB)
Guarantor
MFM
Informed consent
Consent was obtained from all participants through Google Forms prior to data collection.
Supplemental material
Supplemental material for this article is available online.
References
Supplementary Material
Please find the following supplemental material available below.
For Open Access articles published under a Creative Commons License, all supplemental material carries the same license as the article it is associated with.
For non-Open Access articles published, all supplemental material carries a non-exclusive license, and permission requests for re-use of supplemental material or any part of supplemental material shall be sent directly to the copyright owner as specified in the copyright notice associated with the article.