
Abstract
Men and women worked with 25 naturalistic photos of females representing varied physiques. Similarity judgments of the photos were analyzed using multidimensional scaling analysis to produce composite maps for male and female participants. A comparison of the maps showed gender similarities and differences. Both genders used almost identical attributes in judging similarities and identified almost identical body types, but men were more inclusive in identifying ideal females; men included curvaceous females that were rejected by women. Women identified very thin females that were rejected by men. Men were affectively most positive toward female ideals; women were most positive to near-ideals.
Keywords
This article demonstrates a methodology that is useful in studies of body perception and is importantly different from other approaches previously appearing in the literature. We illustrate that methodology here in a comparison of men’s and women’s perceptions of female bodies, focusing on female ideals. Previous studies of body perception are constrained by three related methodological limitations. First, most of those studies used body stimuli that are unnatural, artificial, standardized, or virtual. Those stimuli lack ecological validity and work against achieving a full understanding of body perception as it occurs in the natural environment (Gardner and Brown, 2010; Henss, 2000). In this article, while acknowledging the challenges that are inherent in the use of naturalistic body stimuli, we suggest that body stimuli depicting real human bodies, in real poses, and in real settings are an essential component in the arsenal of stimulus materials used by body perception researchers, and we demonstrate that an analysis of data gathered using naturalistic body stimuli produces meaningful, interpretable results. Second, most contemporary studies of body perception use a relatively small number of body stimuli (typically nine or less; Gardner and Brown, 2010) that cannot possibly represent the full diversity of the human physique. Including a larger number of more diverse body stimuli enabled us to study body perception broadly, not just the perception of ideal bodies. Third, most studies of body perception focus on identifying the ideal female or the ideal male body type from small stimulus collections. In contrast, we view body perception as an example of categorical perception (Harnard, 2005). Accordingly, much of human perceptual development involves identifying the naturally and culturally defined stimulus categories that exist in the environment and learning the critical features or dimensional coordinates that define membership in those perceptual categories (see the following authors regarding cultural impact on ideal bodies: Frederick et al., 2007; Pope et al., 1999; Stephen and Perera, 2014; Swami et al., 2006, 2007, 2009a, 2009b; Swami and Tovée, 2006, 2007, 2009). Categorical perception is functional because it eliminates the need to learn how to deal separately with each and every stimulus encountered; individuals perceive and respond to all stimuli belonging to the same perceptual category in pretty much the same way (Schwartz and Krantz, 2016). Although each perceptual category, including the categories of ideal male and female bodies, is represented by a composite or prototype, there is more to understanding body perception than identifying the category prototypes. Consistent with this view, we describe a methodology for exploring body perception that focuses more on body categories than on category prototypes and that uses a large number of diverse body stimuli allowing multiple body categories to emerge, not just the ideals.
Stimulus materials in body perception studies
The stimuli used in many studies of body perception are limited to a fairly small number of non-naturalistic body stimuli (see Figure 1 for examples). These include figural outlines (Frederick et al., 2007; Singh, 1993; Swami et al., 2010), filled-in silhouettes (Anderson et al., 1997), action figures (Pope et al., 1999), three-dimensional (3D) computer-generated images (CGIs) that can be rotated (Crossley et al., 2012; Swami and Tovée, 2013), two-dimensional (2D) photos of humans taken under standardized conditions (standardized typically for clothing, body posture, and background; Harris et al., 2008; Koscinski, 2013; Swami et al., 2008, 2009a, 2009b; Swami and Tovée, 2012), standardized 2D and 3D CGIs of humans that can be manipulated by study participants (Stephen and Perera, 2014; Urdapilleta et al., 2010), and 2D pictures of real humans that have been manipulated by computer to adjust ratios of body part measurements (Henss, 2000). If one’s purpose is to study perceptions of the human body, it is difficult to justify the use of stimuli that only faintly resemble the human body, yet only two body perception studies published since 2005 used 2D naturalistic photographs (Danilova et al., 2013; MacNeill and Best, 2015). Henss (2000) argued that more body perception research needs to replace figural drawings with images of actual humans.
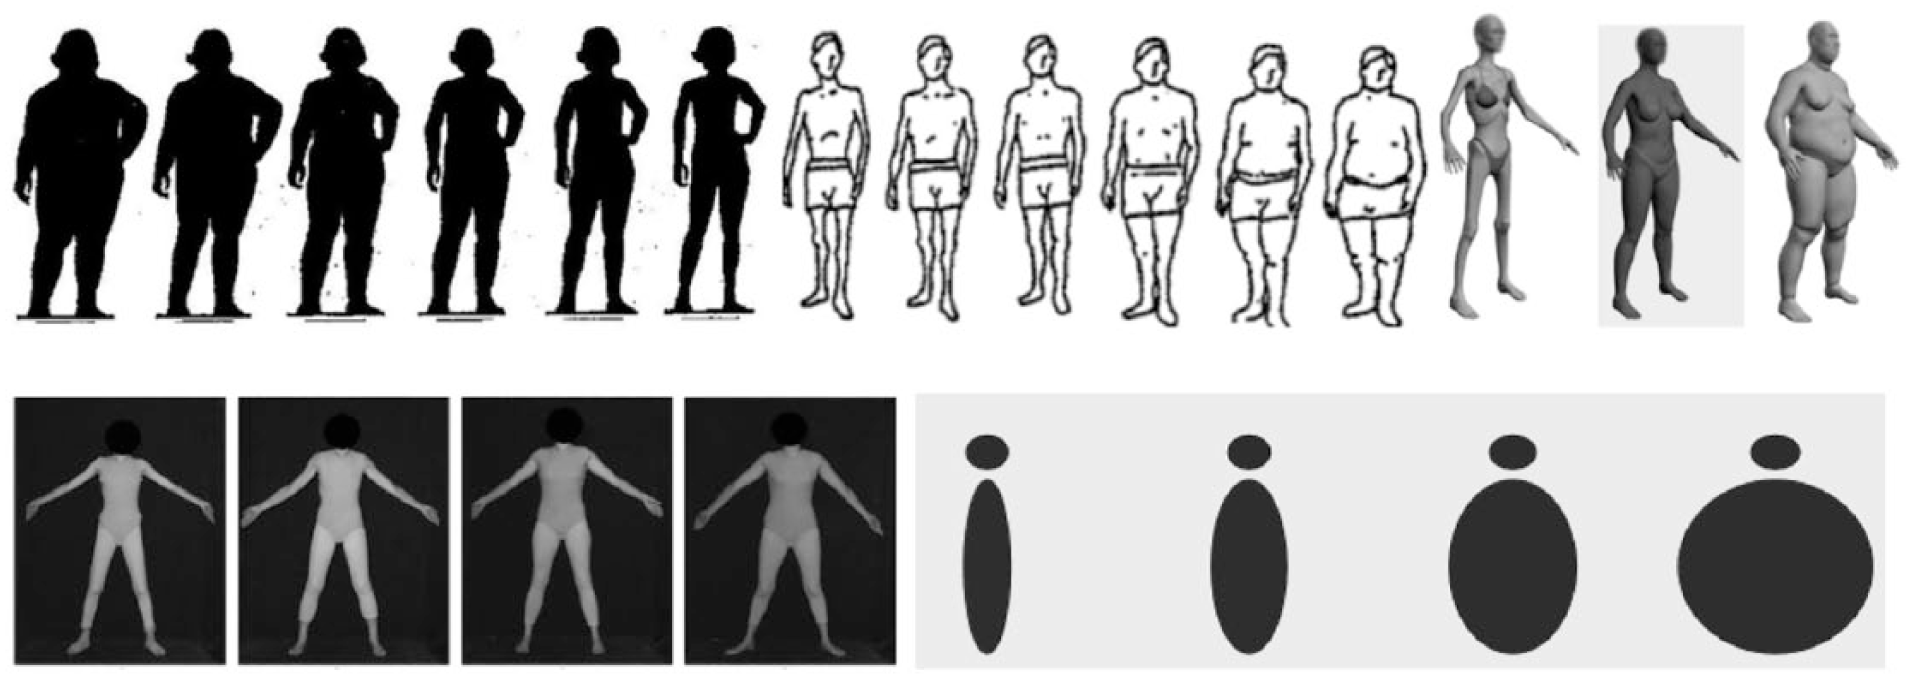
Examples of non-naturalistic body stimuli. Various types of body stimuli have been used in studies of body perception. Top row, from left: body silhouettes (Anderson et al., 1997: 303), figural outlines (Stunkard et al., 1983: 119), computer generated images (Stewart et al., 2009: 69). Bottom row, left to right: standardized photographs (Swami et al., 2008: 1755), and geometrical shapes (Segura-Garcia et al., 2012: 221).
Two-dimensional and 3D CGIs used in body perception studies have the advantage of offering observers a nearly unlimited variety of body stimuli that closely approximate the human figure, but CGIs are still recognizable as non-human. Furthermore, researchers who used CGIs have acknowledged that the software offers only limited control over the images (Ferrer-Garcia and Gutierrez-Maldonado, 2008; Rowe et al., 2005; Stewart et al., 2009). The subtle details—muscle definition, the curvature of a single body part, the sizes of individual muscles—cannot be controlled, especially by research participants who lack extensive training in the use of the software (see Swami and Tovée, 2008, for a description of participants who focused on the muscularity of the arms more than the torso). Ironically, as CGIs increasingly resemble actual human beings, there comes a point called the “uncanny valley,” at which positive affective reactions toward the images are replaced with feelings of eeriness and revulsion (MacDorman and Chattopadhyay, 2016, 2017; MacDorman and Ishiguro, 2006). That is not an effect that is helpful in research on physical attractiveness! Even stimulus collections consisting of photos of actual humans taken under standardized conditions are extremely limited. Typically, the models are artificially and unattractively posed and are clothed in a manner that gives few cues as to muscle definition (e.g. Harris et al., 2008; Stephen and Perera, 2014; Swami et al., 2008, 2012). These standardized photographs do not provide a close approximation to the human figure as it is encountered in the real world.
Gardner and Brown (2010) offered the following suggestions regarding the use of figural drawing scales in studies of body image. We find that their suggestions apply more broadly to all stimulus materials used in body perception studies. They suggested (a) using test–retest reliability to assess the reliability of observers’ reactions; (b) eliminating facial features and clothing cues that shift the participant’s focus away from what is being studied (see also Swami and Tovée, 2008); (c) keeping separate those body perception studies using participants with body perception distortions (e.g. anorexia, muscle dysmorphia) and studies using participants who may merely be dissatisfied with their appearance; (d) choosing body stimuli that are age appropriate to the participants; (e) providing the stimuli in an unordered array and not in an ascending order, because ordered stimuli lead to spuriously high test–retest values and bias participants toward the left (thinner) images; and (f) placing each stimulus on a separate card and presenting them randomly. Insofar as possible, we have attempted to follow their recommendations in our choice of study participants and body stimuli in this study.
It seems self-evident that if we wish to learn more about how we naturally perceive the human body, we should not avoid the use of naturalistic stimuli just because they are not easily quantifiable, are unstandardized as to clothing, pose, and background, and are generally “messier” to work with. As Mook (1983) stated, “If our purpose in conducting an experiment is to predict real-life behavior in the real world, then issues of ecological validity confront us full force” (p. 381). Naturalistic body stimuli not only provide ecological validity but also offer the advantages of abundance, low cost, and are not so overly processed as to be susceptible to the criticism that they “ … maximize researchers’ chances of demonstrating a significant effect rather than necessarily to be representative of the real world” (Want, 2014: 32). We are not suggesting that research using non-naturalistic body stimuli should be abandoned, but rather that researchers interested in investigating perceptions of the human body would be well served to include photographs of real humans in real settings in their studies.
Ideal male and female or ideal males and females?
With the exception of Danilova et al. (2013), participants in recent studies of male and female body ideals are instructed to select or computer-generate the one stimulus that is “ideal.” That method forces one to conceptualize the ideal body as a single stimulus and makes no more sense than speaking of the ideal painting or the ideal melody. All of these ideals are perceptual categories, represented by multiple examples that vary somewhat from one to the next. The ideal is an exemplar or prototype, the centroid in a cluster of similar ideals, a perceptual schema. It is a creation in the mind of the perceiver, a composite that is abstracted from many examples of the stimulus category (Harnard, 2005). However, understanding the prototypes is not the entirety of understanding the categories which the prototypes represent.
Once body perception is recognized as a form of categorical perception, it seems insufficient to identify the prototypes and more important to investigate the characteristics of the perceptual categories that those prototypes represent. How many body perception categories do observers use naturally as they view a diverse assortment of body stimuli? How wide are the categories and where are the boundaries? What are the critical features that define membership in the categories, including those containing male or female body ideals? What are the salient perceptual dimensions along which body categories are arranged that enable assigning specific body stimuli to categories? These are not questions that are likely to be asked in studies that begin with the premise that there is a single ideal body and provide observers with a limited number of stimuli to work with that only approximate the human form. They are questions that can be addressed if participants are asked the right questions as they work with the right stimulus materials.
Method
Participants
Women and men aged 18–45 were recruited from a university population to participate in this study using an introductory psychology subject pool, announcements in psychology and sociology classes, flyers posted across campus, including at a university wellness center, and word-of-mouth. This age range was selected to roughly match the apparent age range of the stimulus photos used in the study (Gardner and Brown, 2010). Since those grayscale photos (Figure 2) were ambiguous as to race/ethnicity, but were all relatively light-complexioned, only data from participants who self-identified as similarly light-complexioned (i.e. Caucasian, Asian, Latino/Hispanic, Native American) were analyzed (Swami and Tovée, 2007, 2008, 2013). Participants provided informed consent and all study materials and procedures were approved by the appropriate institutional review boards. Responses were discarded if large amounts of data were missing (e.g. whole sections of the data packet were left blank), respondents clearly did not follow instructions (e.g. indicated that the same stimulus photo belonged in more than one category pile or assigned identical attribute ratings to widely diverse stimulus photos), or intra-rater reliability was low. Intra-rater reliability was assessed by asking participants to re-rate a subset of 10 rating scale items included in the study. The correlation between the first and second ratings provided a measure of intra-rater reliability. Low-reliability outliers were well defined by a cutoff value of r < .50. Consequently, that cutoff was used to identify and eliminate unreliable data. Approximately 25 percent of the responses we received were ultimately discarded for one or more of these reasons, but high-quality data (i.e. complete or nearly complete with an intra-rater reliability coefficient of r

Twenty-five female body stimulus photographs with identifying numbers.
Ethnicity and BMI characteristics of study participants.

BMI: body mass index.
Stimulus materials
Using a Google Images search, we developed a collection of 25 female body stimulus photos for this study, varying in muscularity, fitness, weight, leanness, and covering a wide range of female physiques (Figure 2). Some were thinner, some overweight, some were more muscular and some were less so, some were less curvaceous and some more so. Women depicted in those photos were all clad in bikinis to maximize visible physical features, with faces blacked out to remove facial cues to race, ethnicity, and attractiveness (Swami and Tovée, 2007, 2008). Extraneous backgrounds were cropped as much as possible. Actual stimulus photos were all about 3 inches tall and varied in width from about 1.25 to 2 inches. All stimulus photos depicted relatively light-complexioned individuals and photos were printed in grayscale to further eliminate cues to race and ethnicity (Swami and Tovée, 2007, 2008). Stimulus photos were assigned identifying numbers (1–25) at random. In addition to these 25 photos, 3 cards without photos were included in the deck with the printed labels “Ideal Female,” “Average Female,” and “Actual Body” (this third card was only included in the deck when female participants worked with the stimuli). Participants were told to treat the “Ideal Female” card as if it were a photograph of an ideal female body, the “Average Female” card as if it were a photograph of an average female body, and women who worked with female stimulus photos were told to think of the “Actual Body” card as if it was a picture of themselves. These cards served as marker stimuli that later enabled us to identify groups of stimulus photos that were considered to be ideal, average, and like female study participants’ own bodies.
Procedure
Instead of instructing participants to select or computer-generate the ideal female body, we developed an alternative procedure that is consistent with the categorical perception conceptualization of body perception. Several steps are involved in the procedure: (a) stimulus card sorting, (b) stimulus similarity judgments, (c) stimulus attribute ratings, and (d) data analysis using multidimensional scaling (MDS) analysis. It will be helpful in understanding our methodology to first review MDS analysis, as that analytic method is still not covered in many multivariate statistics textbooks and is relatively unfamiliar to many researchers.
The data for an MDS analysis are generated by one or more observers who judge the degree of similarity (or “proximity”) between all possible pairs of stimuli in a stimulus collection. These inter-stimulus similarity judgments form a proximity matrix. Data from one or more observers’ proximity matrices can be processed in an MDS analysis to create either an individual observer’s stimulus map or a group composite stimulus map. In the present study, we used MDS analysis to create two group composite stimulus maps capturing perceptions of female bodies—one for male participants and one for female participants (see Danilova et al., 2013 for an example of the utility of individual MDS maps in body perception research).
In an MDS stimulus map, each of several stimuli (female bodies in this study) is plotted as a point in space, with distances between points corresponding to the observers’ inter-stimulus similarity judgments. Thus, similar stimuli are mapped close together and dissimilar stimuli are located further apart in the map. Stimuli that are relatively homogeneous and belong to the same perceptual category will form a discernible cluster in the map. Stimulus maps can be configured in one, two, or more dimensions, dictated by various goodness-of-fit criteria which evaluate the degree to which the original inter-stimulus similarity judgments match with distances between the mapped stimulus points. Both of the group composite maps created in this study were plotted in two dimensions. Kruskal and Wish (1978) pointed out that most of the information in the original stimulus similarity judgments is captured by the first two dimensions and additional dimensions did not improve goodness-of-fit for our data.
MDS enables the researcher to identify perceptual attributes that are important to observers, either explicitly or implicitly, as they react to the stimuli and judge stimulus similarity. These attributes can be thought of as attentional filters that shape observers’ stimulus similarity judgments (Jaworska and Chupetlovska-Anastasova, 2009). The identification of perceptual attributes that are salient to observers as they perceive and react to a collection of stimuli can be accomplished subjectively by inspecting the stimulus map to see if the stimuli increase or decrease continuously on any identifiable attribute (as one looks left to right, top to bottom, or diagonally). Schiffman et al. (1981) also described a more objective method by which salient perceptual attributes can be identified. Their procedure uses multiple regression analysis to evaluate the degree of correspondence between the configuration of stimuli in the MDS map and numerical ratings of the stimuli on potentially relevant stimulus attributes. To evaluate the degree to which the stimuli in an MDS map are configured in a manner that is determined by their values on any particular attribute, observers rate the stimuli on that attribute and these ratings serve as the dependent variable in a multiple regression analysis. Coordinates of the mapped stimuli on the horizontal and vertical dimensions of the map serve as independent variables in the multiple regression analysis. Then, R2 from the multiple regression analysis measures the perceptual salience of the attribute as the proportion of variance in the mapped locations of stimuli that was explained by the attribute that served as the dependent variable. In this study, we evaluated the salience of 11 perceptual attributes using the Schiffman et al. (1981) procedure. Once the most strongly salient attributes (i.e. those attributes associated with the strongest R2 values) were identified in this fashion, we plotted these attributes as vectors in the MDS map following the procedure also described by Schiffman et al. (1981).
Card sorting
Study participants were first instructed to sort their deck of female stimulus photos into between four and nine piles based on similarity (four to nine piles was suggested by a pilot study). No additional instructions were given to clarify the meaning of “similarity” so that participants would be free to use spontaneously whatever dimensions, features, or attributes were important to them (explicitly or implicitly) as they sorted the photos. Both men and women worked with the same 25 female stimulus photos and cards labeled “Ideal Female” and “Average Female.” A third card labeled “Actual Body” was included in the deck for female participants only to represent their own bodies.
Stimulus similarity judgments
After all cards were sorted into piles, participants judged the similarity between all pairs of photo piles using a 1–8 scale, with 1 = very different and 8 = very similar. Having participants in MDS studies rate similarities between pairs of piles of stimulus photos, rather than pairs of individual photos, requires some explanation. It is common in MDS studies for observers to judge the similarity between all possible pairs of stimuli, but to have done so in this study, with so many body stimuli, would have required 378 similarity judgments—well beyond the motivational limits of most participants. The approach used in this study was designed to achieve a balance among (a) using a sufficient number of stimulus photos to cover the full variability of the human physique, (b) controlling the work load on study participants, while (c) still obtaining as much inter-stimulus proximity data as possible.
Sorting photos into piles at the first step of the procedure provided a binary measure of proximity. Photos in the same pile can be considered “similar” and photos in different piles can be considered “different” (Whaley and Longoria, 2009). These binary proximities provide a coarse measure of inter-stimulus similarity at best that suffers from two problems. First, all stimuli within a given pile are treated as equally similar when they probably are not. Second, stimuli in different piles are treated as equally dissimilar when they probably are not. There is no “fix” to the first problem, and it may not be too serious anyway because stimuli within a perceptual category are perceived as more similar than they really are from an objective standpoint (Brasselet and Arleo, 2018; Fleming et al., 2013; Wegrzyn et al., 2015). In an attempt to rectify the second problem, study participants next judged all possible pairs of photo piles for similarity. Coming out of this second step, all photo pairs from two piles were assumed to carry the same degree of similarity as the piles from which the photos came. For example, if Pile A (containing photos 1 and 2) and Pile B (containing photos 3 and 4) received a similarity judgment of 5, then photo pairs 1–3, 1–4, 2–3, and 2–4 were all assumed to have a similarity of 5. Since the similarity of stimuli within a pile would logically be greater than the similarity between stimuli in separate piles, the similarity of photos within any given pile was set at 9 (i.e. one unit greater than the maximum value of 8 that participants were allowed to use in judging the similarity between photo piles). Thus, in the example above, photo pairs 1–2 (in Pile A) and 3–4 (in Pile B) would each be assigned similarity ratings of 9.
Attribute ratings
Stimulus attribute ratings collected after participants provided inter-stimulus similarities can be used in evaluating the importance of those attributes in shaping perceptions of stimulus similarity using the procedure described by Schiffman et al. (1981). In this study, we used a series of 11 rating scales to collect data on 11 attributes of potential importance to body perception. Previous research showed that the evaluative and potency semantic differential dimensions are salient in organizing perceptions across a wide variety of stimuli (Osgood et al., 1957). We selected six attributes representing those two semantic differential dimensions that seemed to us to be relevant to the body stimuli used in this study. The evaluative dimension was represented by three 5-point bipolar rating scales: good-bad, beautiful-ugly, and healthy-sick. The potency dimension was also represented by three 5-point bipolar rating scales: large-small, strong-weak, and masculine-feminine. A rating of 1 strongly denoted the first adjective in the pair, a rating of 5 strongly denoted the second adjective in the pair, and a rating of 3 denoted neutrality on that dimension. Participants also rated stimulus photos according to the degree to which they evoked five affective reactions: anger, sadness, disgust, happiness, and fear. Ekman and associates (Ekman, 1992; Ekman et al., 1982) identified these emotions as basic affective experiences that are cross-culturally common. Participants’ affective reactions to body stimuli were collected using five 5-point scales that were anchored at three points: 1 = no reaction, 3 = moderate reaction, 5 = strong reaction.
Although it is common in MDS studies to ask observers to rate each stimulus on each attribute being evaluated for salience, to do so in this study would have created an excessive burden on participants; 11 ratings of 28 stimuli (including 25 body stimulus photos and 3 additional cards labeled “Ideal Female Body,” “Average Female Body,” and “Actual Body”) would have required 308 ratings. We settled on a compromise. Instead of rating each stimulus on each attribute, participants rated each of their photo piles on each of the 11 attributes. All photos within a pile were then assumed to take on the same attribute rating as the pile within which the photos were members.
Intra-rater reliability assessment
In the final task of the protocol participants re-rated a series of 10 rating scale items that were previously used to collect data on their semantic differential and affective reactions to some of the stimulus piles. Correlations between these two sets of ratings measured intra-rater reliability. As noted previously, correlations less than 0.50 identified data for elimination as unreliable.
Results
Figures 3 and 4 are MDS-generated group composite stimulus maps summarizing women’s and men’s perceptions of female bodies. Inter-stimulus proximities were treated as ordinal scale data and were analyzed using the ALSCAL procedure in IBM SPSS (Version 25.0). Solid lines plotted through these maps (ignoring the horizontal and vertical axes) represent the three most salient semantic differential attributes (from among good-bad, beautiful-ugly, healthy-sick, large-small, strong-weak, and masculine-feminine). Those attributes are bipolar and are labeled at both ends. Dashed lines plotted through the maps represent the three most salient affective reactions (from among anger, sadness, disgust, happiness, and fear). These affective reactions are unipolar and include an arrow to indicate the direction in which the affective reaction increases in intensity. Labels for the affective reaction vectors are found at the end with the arrow. To avoid clutter, only the three most salient semantic differential attributes and the three most salient affective reactions are plotted in the stimulus maps.
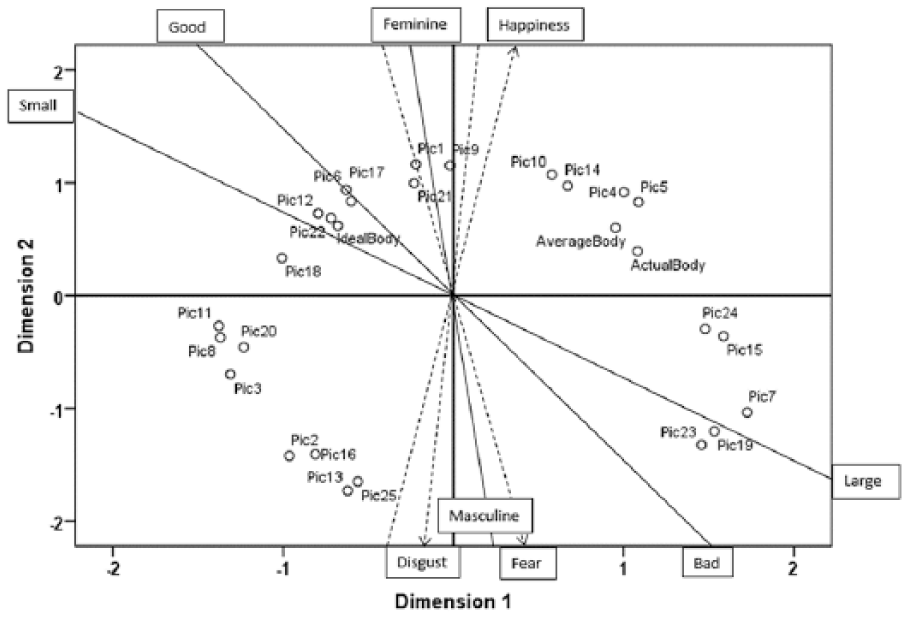
Group composite stimulus map of women’s perceptions of female bodies (n = 85). Photos corresponding to mapped stimulus points (Pic 1 through Pic 25) can be identified from Figure 2. Also mapped are points corresponding to the imaginary Ideal Female Body, Average Female Body, and participants’ Actual Body.

Group composite stimulus map of men’s perceptions of female bodies (n = 66). Photos corresponding to mapped stimulus points (Pic 1 through Pic 25) can be identified from Figure 2. Also mapped are points corresponding to the imaginary Ideal Female Body and Average Female Body.
Women’s perceptions of ideal female bodies
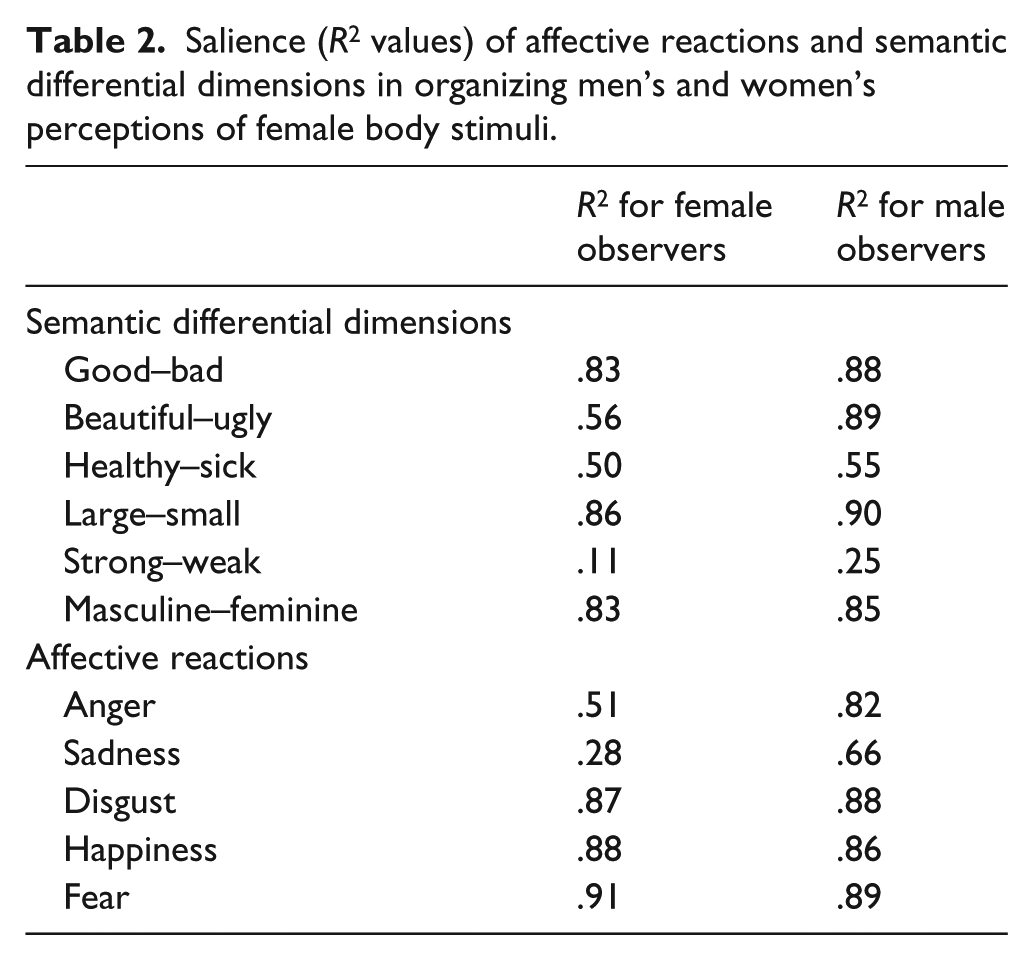
Figure 3 shows the group composite stimulus map summarizing women’s perceptions of female bodies (refer also to Figure 2 to identify body stimuli corresponding to the plotted identifying photo numbers). Table 2 summarizes the salience of six semantic differential dimensions and five affective reactions for female observers as they judged female stimulus photos for similarity. The three most salient semantic differential attributes (plotted in Figure 3) were large-small (R2 = .86), masculine-feminine (R2 = .83), and good-bad (R2 = .83). The three most salient affective reactions (also plotted in Figure 3) were fear (R2 = .91), happiness (R2 = .88), and disgust (R2 = .87). In addition to the attribute vectors that were plotted in Figure 3, it is visually apparent that the mapped female bodies ranged from extremely slight at the left to large at the right, indicating that body size was important to women as they judged female bodies for similarity. The affective reaction vectors are located mostly vertically, with negative emotions toward the bottom of the map, and positive emotions toward the top. As shown by the clustering of stimulus points in Figure 3, seven female body perception categories emerged as female observers judged female bodies for similarity. Beginning in the upper-right quadrant and moving clockwise: average women (i.e. 4, 5, 10, 14, plus Average Female and Actual Body marker stimuli), then larger women (i.e. 15 and 24), blending into obese women (i.e. 7, 19, and 23). In the lower level quadrant are muscular women (i.e. 2, 13, 16, and 25), then underweight women (i.e. 3, 8, 11, and 20), ideal women (6, 12, 17, 18, 22, plus the Ideal Female marker stimulus), and then near-ideal women (i.e. 1, 9, and 21) located between the ideal and average female body categories.
Salience (R2 values) of affective reactions and semantic differential dimensions in organizing men’s and women’s perceptions of female body stimuli.
The female body ideals are lean, fit, with well-defined abdominal muscles, relatively small breasts, narrow hips, thin legs, and very little body fat. Based on the location of the female ideals in the map, women in our study identified female ideals as small and thin, but not too thin, as there were some female body stimuli (i.e. 3, 8, 11, and 20) that were thinner than the ideal. Female ideals were located toward the feminine end of the masculine-feminine dimensions, but a couple female body stimuli mapped as more feminine than the ideals (i.e. 1 and 9). Both of these stimuli depict women who are not as thin or athletic as the ideals, and are slightly larger with more body fat and less muscle definition than the ideals. Women’s affective reactions to ideal female bodies were somewhat less positive than for several other stimuli that were located closer to the female average (i.e. 1, 9, 10, and 14). Finally, female ideals were perceived as relatively unlike either the Average Female or participants’ Actual Bodies. Women in our study saw themselves as much more similar to average females than to ideal females (i.e. they were larger (horizontal dimension) and elicited slightly less positive affective reaction than did the ideals (vertical dimension)).
Men’s perceptions of ideal female bodies
Figure 4 shows the group composite stimulus map summarizing men’s perceptions of female bodies (refer also to Figure 2 to identify body stimuli corresponding to the plotted identifying photo numbers). Table 2 summarizes the salience of six semantic differential dimensions and five affective reactions for male observers as they judged female stimulus photos for similarity. The three most salient semantic differential attributes (plotted in Figure 4) were large-small (R2 = .90), beautiful-ugly (R2 = .89), and masculine-feminine (R2 = .85). The three most salient affective reactions (also plotted in Figure 4) were fear (R2 = .89), disgust (R2 = .88), and happiness (R2 = .86). In addition to the attribute vectors that were plotted in Figure 4, it is visually apparent that the horizontal dimension of the map represents body size, ranging from small at the left to large at the right. The vertical dimension represents muscularity as it is apparent that the female bodies move from very strong and muscular at the bottom of the map, with muscularity and strength decreasing as one ascends vertically. Most of the mapped attributes run diagonally and all seem to carry an evaluative quality, with positive characteristics and positive affective reactions (i.e. happy, beautiful, not fearful, and not disgusting) toward the upper left and negative characteristics and negative affective reactions (i.e. fear, disgust, ugly, not happy) toward the bottom right. While female observers organized female bodies into seven categories, male observers used six female body categories, the difference being that the near-ideal category that female observers used was not apparent in the male map. Beginning in the upper-right quadrant of Figure 4 and moving clockwise, the body categories that emerged as male observers judged female bodies for similarity were average women (i.e. 4, 5, plus the Average Female marker stimulus), larger women (i.e. 15 and 24), and blending into obese women (i.e. 7, 19, and 23). In the lower left quadrant are muscular women (i.e. 2, 13, 16, and 25), then underweight women (i.e. 3, 8, 11, 18, and 20), and nine ideal women (i.e. 1, 6, 9, 10, 12, 14, 17, 21, 22, plus the Ideal Female marker stimulus).
The stimulus bodies included in the ideal female cluster shows that men in our study selected ideals who are small and thin, but not too thin. Three bodies that were thinner than those in the ideal cluster (i.e. 8, 11, and 12) were not included in that cluster. Thin was ideal; too thin was not. On the affective reaction dimensions, female ideals were located in a manner indicating that they elicited the maximum positive affective reactions from the men in our study.
Discussion
We found both similarities and differences in men’s and women’s perceptions of the female body, including female ideals. Consider first which perceptual attributes were most salient in their stimulus maps. Men and women in our study were similar in that their perceptions of female bodies were organized using the potency semantic differential dimensions of large-small and masculine-feminine. However, men and women differed in their choice of evaluative dimensions. Men used the more sexually connoted dimension of beautiful-ugly, while women used the sexually neutral dimension of good-bad. Both men’s and women’s maps also showed that size was important in judging female bodies for similarity, as were the three affective reactions of fear, happiness, and disgust. We concluded from all of this that men and women used many but not all the same perceptual filters as they judged female bodies for similarity, except that sexual attractiveness (beautiful-ugly) was more salient for men than women, as might be expected in a predominantly heterosexual population. Men’s and women’s stimulus maps also revealed the use of nearly identical body perception categories. Both men and women used the categories of average, larger size, obese, muscular, underweight, and ideal females. Women added a near-ideal category that was not apparent in the men’s map. Some of these categories were imposed by the researchers’ use of marker stimuli for Average Body and Ideal Body, but the other categories were used spontaneously by our participants. Not only were the body categories nearly identical, the body stimuli that were included in those categories were very similar for men and women. Men and women included exactly the same body stimuli in the larger size, obese, and muscular female body categories. As discussed next, there were some interesting differences in the classification of female body stimuli to the ideal, near-ideal, and average categories.
In the women’s map, only five body stimuli (i.e. 6, 12, 17, 18, 22) were included in the ideal female body cluster; the men’s ideal female cluster included nine stimuli (i.e. 1, 6, 9, 10, 12, 14, 17, 21, 22). Men were more inclusive than women in identifying female ideals. This finding is consistent with Buss’ (2016) observations about men’s choice of partners for casual sexual encounters: “Yet another psychological solution to securing a variety of casual sex partners is men’s relaxation of their standards for acceptable partners … Relaxed standards ensure the presence of more eligible players” (p. 78).
Two body stimuli that women in our study considered average (i.e. 10, 14) were included by men in their ideal category. Three additional stimuli (i.e. 1, 9, 21) that formed a near-ideal cluster in the women’s map (midway between the ideals and the averages) were also included in the ideal cluster by men. Women, but not men, included the very lean stimulus 18 in the ideal cluster. Although some previous studies reported that men and women both preferred the same thin female ideal (Koscinski, 2013; Swami et al., 2010; Willinge et al., 2006), our study showed noticeable gender differences. Men, but not women, identified female stimulus photos as ideal that displayed the classic hourglass shape, wider hips, larger breasts, more body fat, and less muscle definition. In contrast, female bodies that were selected by women as ideal were relatively thin, more athletically fit, with thinner legs, narrow hips, smaller breasts, and increased muscle definition. Put simply, men tended to judge on sexual attractiveness and fitness to deliver children (sexual attractiveness and health). In contrast, women were inclined to judge on physical fitness (health only). This finding confirms other research reflective of women’s preference for a physically fit, healthy ideal (Ahern et al., 2011; Asendorpf et al., 2011; MacNeill and Best, 2015; Stephen and Perera, 2014), but contrasts with Smith et al., 2007) who found no correspondence between female models’ cardiovascular fitness levels and ratings of attractiveness from male and female observers. However, those researchers used a physiological measure of fitness (a 6-minute submaximal cycle ergometry test measuring maximal oxygen consumption) whereas fitness was inferred from visual body characteristics in our study.
One last difference between men’s and women’s perceptions of the ideal female body is suggested by the location of the ideal female cluster along the affective reaction dimensions in the two maps. Both men and women responded with positive affect toward ideal female bodies, but that positivity was somewhat muted among women, who located some non-ideal female stimulus bodies (i.e. 1, 9 10, 14, 21) more positively than their female ideals. In contrast, ideal females were at the maximally positive ends of the affective reaction dimensions in the men’s map. Why would women show less positive affect toward ideal female bodies than near-ideal ideal bodies? The explanation may be found in the literature on mate selection and competition and in appearance-based social comparisons. First, female bodies that are slightly off-ideal present less competition in mate selection than do fully ideal females and would elicit more positive affective responses because of this (Davies and Shackelford, 2017). Second, upward social comparisons (in this study, comparisons of one’s own body to bodies deemed to be more desirable, based on internalized cultural beauty standards) lead to body dissatisfaction, increased negative affect toward the more desirable bodies, and increased body self-surveillance (Feltman and Szymanski, 2018; Janelle et al., 2009; Moreno-Domínguez et al., 2019; Stronge et al., 2015; Thøgersen-Ntoumani et al., 2017).
Conclusion
The purpose of this study was to describe a methodology that we believe can be useful in furthering understanding of human body perception, including the perception of body ideals. We illustrated the methodology by comparing men’s and women’s perceptions of female bodies, focusing on female body ideals. Study participants worked with a large number of physically diverse, ecologically valid, naturalistic stimulus photos of real women in real environments. The procedure described in this article allows researchers to capture and summarize very large amounts of data about observers’ perceptions of body stimuli and allows for the study of body perception considered broadly, as opposed to focusing exclusively on perceptions of body ideals. Our approach is consistent with the view that body perception is a form of categorical perception and the methodology employed in this study was useful in answering questions consistent with that viewpoint. We focused on female ideals, but other categories were also evident (e.g. average women, larger size women, obese women, muscular women, underweight women) and the male and female observers in our study were consistent in the ways in which they classified body stimuli to several of these categories. We were also able to evaluate the breadth and inclusivity of the female body ideal category among male and female observers, and were able to identify the most salient attribute dimensions and critical features that observers used in evaluating female bodies for similarity.
Our study faced several limitations that should be addressed. Because the study focused on gender differences in female body perception, we wanted to remove as many other variables as possible that might influence outcomes, including race and/or ethnicity. Accordingly, all stimulus photos depicted light-complexioned individuals, and we only used data from similarity light-complexioned participants. As a consequence, we cannot offer any observations about race and/or ethnicity effects on body perception, neither on the stimulus side nor on the observer side. Studies with that focus would provide a valuable addition to the body perception literature (see Frederick et al., 2007). While we have argued throughout this article that naturalistic body stimuli offer the advantage of ecological validity that is not available from figural outlines, silhouettes, standardized photos, or computer-generated virtual bodies, there are disadvantages to using naturalistic stimuli. The backgrounds of the photos we used were cropped as much as possible but still contained scenery which might have affected perceptions of the target body stimuli. Individuals were pictured in varying postures which might also have affected perceptions. Differences in manner of dress from one photo to the next might have shaped perceptions. Despite these possibilities, when our study participants explained to us why they sorted stimulus photos as they did, they always mentioned physique, not clothing, poses, or backgrounds. It is also clear from the stimulus maps that stimulus photos were arrayed along dimensions of physique and were clustered according to similarities in physique, not clothing, poses, or backgrounds. As in any study of body perception that does not use live human models (none that we could find), the stimulus photos we used provided only approximations to actual human bodies and were only two-dimensional at that. However, Swami et al. (2006) reported that … a recent study that compared the ratings of two-dimensional photographs with ratings of movie clips of the same bodies rotated through 360 degrees showed no differences … which suggests that two-dimensional photographs can capture much of the visual information available in three-dimensional images. (p. 203)
That being said, there still seems little doubt that photographic images, whether rotated or stationary, are inferior to the live experience of the human figure in terms of the richness of the stimulus information provided. Because we used convenience sampling, caution must be taken in generalizing our findings beyond the sample at hand. Most of our participants were Caucasian students attending one university in the Southwestern United States, 18–45 years of age, who were sufficiently interested in body perception to volunteer to participate in our study. Research volunteers are known to differ from non-volunteers on a host of cognitive, personality, and demographic variables (Gravetter and Forzano, 2016; Rosenthal and Rosnow, 1975). How convenience sampling of our study participants might have biased our findings is unknown. Another sampling issue pertains to our choice of stimulus photos and whether the findings that emerged with the photos we used would be seen again using a different sample of stimulus photos. Finally, the external validity of this study is also limited as to time because perceptions of the human body change with the shifting cultural winds. There is always a need for more research on body perception and the perception of body ideals because the topic is ever changing.
Despite the fact that MDS is a quantitative procedure that analyzes numerical data, the methodology described in this article is in many ways quite qualitative and descriptive. MDS analysis does not offer anything like a confidence interval to provide a specified level of certainty that a population stimulus map would resemble the sample stimulus map within some margin of error. Comparisons of men’s and women’s stimulus maps in our study did not involve any inferential tests, but was a subjective, qualitative process. That subjectivity notwithstanding, the fact that the stimulus maps in this study were easily and consistently interpreted and made sense in light of other research on body perception, while also offering new insights, speaks to the validity of the method as a way of understanding body perception.
Footnotes
Declaration of conflicting interests
The author(s) declared no potential conflicts of interest with respect to the research, authorship, and/or publication of this article.
Funding
The author(s) received no financial support for the research, authorship, and/or publication of this article.