
Abstract
We examined food consumption in response to a laboratory-induced stressor (two challenging neuropsychological tasks) among non-Hispanic White women categorized as lower or higher in socioeconomic status based on education. The two socioeconomic status groups did not differ with respect to current hunger or baseline dietary habits. Perceived stress was measured pre- and post-challenge. Snacks were offered post-challenge; food consumption was measured by weighing snack bowls pre- and post-offering. Perceived stress increased pre- to post-challenge for both groups, but this effect was stronger for women lower in socioeconomic status. In addition, women lower versus higher in socioeconomic status consumed more food overall and more high-fat sweet food in particular (large effect sizes). These findings provide evidence of socioeconomic status differences in food consumption following an acute stressor.
Obesity is a significant public health problem and a significant risk factor for chronic conditions including diabetes, cardiovascular disease, and cancer (Hruby and Hu, 2015; Ligibel et al., 2014). In the United States, age-adjusted prevalence rates of obesity (body mass index (BMI) ⩾ 30) differ by gender: 35.0 percent for men and 40.4 percent for women (Flegal et al., 2016). Obesity also differs by socioeconomic status (SES) (Ball and Crawford, 2005; McLaren, 2007). The two variables are inversely linked, such that higher SES is associated with less obesity, and lower SES is associated with greater obesity (Ball and Crawford, 2005; McLaren, 2007). Evidence for this pattern is strongest among women, middle-aged persons, and those living in industrialized nations (Pudrovska et al., 2014; Sobal and Stunkard, 1989; Zhang and Wang, 2004).
Explanatory mechanisms for the inverse association between SES and obesity are not well established. Stress is one potential mechanism (Mackenbach, 2006). Money is a common source of stress (American Psychological Association (APA), 2015), and being economically disadvantaged is taxing (Mani et al., 2013). Persons of lower SES face challenges at multiple levels. Relative to persons of higher SES, they may live in neighborhoods with greater exposure to violence, experience more family conflict due to competing demands and financial pressures, experience greater levels of negative affect such as depression and anxiety, and adopt poorer health behaviors (Chen and Miller, 2013). Persons with lower household incomes report greater stress as compared to persons with higher household incomes, and this gap has widened since 2011 (APA, 2015). Among those with lower household incomes, moreover, financial stress encourages maladaptive coping, such as sedentary behavior, smoking, drinking alcohol, and eating (APA, 2015). Indeed, stress is known to encourage eating in most individuals (roughly 70%), in particular, the consumption of highly palatable, calorically dense comfort foods (Adam and Epel, 2007; Sominisky and Spencer, 2014; Tryon et al., 2013; Zellner et al., 2006). While severe stress can lead to reductions in food intake among a subset, this tends to be short-term and followed by compensatory eating resulting in increased adiposity (Adam and Epel, 2007).
Female gender plays an important role in both the experience and management of stress. Women report higher levels of stress as compared to men, and stress about money in particular (APA, 2015). Female gender is also a predictor of stress-induced eating (Adam and Epel, 2007; Zellner et al., 2006). In an experimental study, men and women watched a film either about industrial accidents (stress condition) or a pleasant travelogue (control condition). Women who watched the accident film consumed more food compared to men who watched the same film and more food than women who watched the travelogue (Grunberg and Straub, 1992). Survey research has demonstrated that women with high financial stress are more likely to report eating to manage stress as compared to women with low financial stress and the general population (APA, 2015). Age also plays a role. Chronic stress may be especially deleterious for middle-aged women. In an experimental study conducted with peri-menopausal women, those reporting high chronic stress were more likely to consume fewer fruits and vegetables following an acute laboratory-induced stressor than were women reporting low chronic stress, but this was only true of the women 45 and older (Tryon et al., 2013).
The present study sought to understand the relationship between SES, stress, and eating in a sample of middle-aged women. We examined effects of an acute laboratory-induced stressor on food consumption as a function of SES among non-Hispanic White women. We focused on this population because the relationship between SES and obesity is strongest among White women. The two variables are either unassociated or less consistently associated among non-Hispanic Black and Mexican American women (Kimm et al., 1996; Ogden et al., 2017; Zhang and Wang, 2004). We also focused on middle age because weight gain is typical during this period, especially among women (Gunderson and Abrams, 2000; Wing et al., 1991), and adiposity and weight gain in mid-life are risk factors for chronic disease (Emaus et al., 2014; Sun et al., 2009).
We hypothesized that SES would differentially affect subjective and behavioral responses to stress, such that women categorized as lower in SES relative to those categorized as higher in SES would (a) report greater stress in response to a laboratory-based challenge and (b) consume more food overall and more high-fat, sweet food in particular. This rationale is commensurate with cross-sectional work showing positive associations between stress and uncontrolled and emotional eating among low-income women (Richardson et al., 2015), and experimental work demonstrating increased palatable food consumption in response to acute stress (Epel et al., 2001; Grunberg and Straub, 1992; Habhab et al., 2009).
Methods
Participants
Participants were drawn from a larger 2-year longitudinal study of middle-aged women. The larger study consisted of two cohorts, both recruited using geographic-based sampling, one Hispanic (n = 514) and one non-Hispanic White (n = 503). Eligible participants were aged 30–50 years, English- or Spanish-speaking, and self-described as healthy. The present sub-study involved only women from the non-Hispanic White cohort given that SES and baseline BMI were unassociated among the Hispanic women. Non-Hispanic White participants were included if they had completed the 1-year follow-up assessment for the parent study and if they were at the extreme ends of the SES spectrum (i.e. those higher and lower in education). Lower education was operationally defined as some college, an associate’s degree, vocational training, or lower. Higher education was defined as a master’s degree or higher. This categorization was due to the generally high educational level of women in the Seattle area. Exclusion criteria were pregnancy, diabetes, and current use of a beta-blocker medication (due to influence on the stress response). Among women meeting these criteria, 178 were able to be reached by phone and willing to be screened. Of these, 155 were eligible and 110 consented to participate, a 71 percent agreement rate. All procedures were approved by the University of Washington Institutional Review Board (Committee J, approval #35060).
Baseline dietary recall
At baseline for the larger study (1 year prior to the laboratory session), participants completed a dietary recall to gather information on all foods and beverages consumed during the previous 24 hours. This was administered via phone by staff trained and certified to use the Nutrition Data System for Research (NDSR, Nutrition Coordinating Center, University of Minnesota, Minneapolis, MN). To aid administration, participants were asked to refer to a serving size estimation booklet that had been provided in advance of the call. Responses were entered directly into a computer using the NDSR software which prompts the interviewer to probe for detailed information about specific quantities, brand names, and cooking methods for each food. We focus here on total energy, total fat, percentage of kilocalories from fat, and total sugars.
Anthropomorphic assessment
Weight was assessed at the 1-year follow-up visit without shoes and outer layers of clothing, using a Seca 869 portable flat scale (Seca North America, Hanover, MD), measured to the nearest one-tenth kilogram. Height was assessed using a Seca 213 portable stadiometer (Seca North America, Hanover, MD). BMI was calculated as kg/m2.
Laboratory procedures
Prior to the session, participants were asked not to exercise, smoke, or consume alcohol for 8 hours, to refrain from eating after 1:00 pm that day, and to reschedule if they had symptoms of a cold or flu. Laboratory sessions commenced between 2:30 pm and 4:00 pm. Participants categorized as lower in SES and higher in SES underwent the same laboratory procedures. Upon arrival, participants were greeted, oriented and, after confirmation of inclusion/exclusion criteria, asked to complete a consent form. The laboratory procedures, risks, and benefits had been conveyed over the phone at a prior date but were repeated and clarified in the process of this in-person consent.
Following consent, participants completed a self-report measure of current hunger. They were then exposed to two challenge tasks to elicit acute stress, based on Steptoe and Wardle (2005). Specifically, participants were administered the Stroop Test and a mirror star tracing task, the order of which was counterbalanced across subjects. Perceived stress was assessed both prior to and immediately following the challenge tasks. A rest period followed, during which participants rated perceived challenge of the two tasks and were offered snacks to determine the impact of manipulated stress on food consumption. Measures and the stress provocation (challenge tasks) are described in turn below. All participants were debriefed prior to departure.
Self-report measures
Current hunger (assessed pre-challenge)
Current hunger was assessed using a 1–10 (not at all hungry—extremely hungry) scale.
Perceived stress (assessed pre- and post-challenge)
Perceived stress was assessed using a single item: “How would you rate your current level of stress at this very moment?” Ratings were made on a 1–10 (not at all stressed—extremely stressed) scale.
Perceived challenge (assessed post-challenge)
Participants were asked to rate how challenging each of the two challenge tasks were (color naming and mirror star tracing). Ratings were made on a 1–10 (not at all challenging—extremely challenging) scale.
Eating attitudes (assessed post-challenge)
The Eating Attitudes Test (Garner et al., 1982; Garner and Garfinkel, 1979) was administered at the close of the session so as not to cue participants to our interest in their eating behavior prior to the snack offerings. The Eating Attitudes Test is a self-report measure of disordered eating. We administered the 13-item dieting subscale. Items such as “I am preoccupied with a desire to be thinner” are rated with respect to frequency (0 = sometimes, rarely, or never; 1 = often; 2 = usually; 3 = always). Internal consistency (Cronbach’s coefficient alpha) based on the present sample was .68. Inter-item correlation coefficients were low, about one-half falling below .15.
Challenge tasks
Stroop Color and Word Test
This well-known test was administered on paper and consisted of three pages. The first page contained 100 color words (red, blue, green, and yellow) printed in black ink, for example, “green” printed in black ink. Participants were asked simply to say the words out loud (word naming). The second page contained 100 non-words, specifically “XXXX,” printed in red, blue, green, or yellow ink. Participants were asked to say the color ink that each XXXX was printed in (color naming). The third and final page contained words from the first page printed in colors from the second page, for example, the word “red” printed in green ink. In no case did the meaning of the word and the color that the word was printed in match. Participants were asked to say the color that the word was printed in (color word naming). This task is challenging because it requires inhibition of the meaning of the word and the participant’s default word-reading response. Participants were given 45 seconds per page and instructed to respond as quickly and as accurately as possible. The number of words completed correctly was recorded. We also calculated an interference score which takes into account the time allotted and relative performance on the three pages (Golden and Freshwater, 2002). Negatively signed interference scores indicate greater cognitive inflexibility.
Mirror tracing (Lafayette instruments, Lafayette, IN)
This is a visual motor test that involves using a pencil to trace a 5-pointed star made up of two sets of parallel lines. The difficulty lies in that the fact that the participant can only view the star and their hand as a mirror image; there is a screen covering the star from their direct line of sight. Participants are asked to stay within the lines and to proceed as quickly as possible. Two raters blind to participant SES category and any other identifiers later scored the number of mistakes made by participants, operationally defined as each pencil mark outside of the lines. One rater scored 52 cases and the other scored 55 cases. Ten cases overlapped and were highly correlated, r = .99, p < .001.
Food consumption
After completing the challenge tasks, participants were escorted to a lounge area. During this time, an assortment of snacks was offered. Participants were told, “We asked you to refrain from eating after 1 pm. In case you’re hungry, feel free to help yourself to any of these snacks.” Based on a modification of Epel et al. (2001), participants were offered, each in a separate red, 12-ounce plastic bowl salted pretzels (low-fat salty), potato chips (high-fat salty), jelly beans (low-fat sweet), and shortbread cookies (high-fat sweet). Each bowl was weighed privately before and after being offered to the participant. Mean weights of each food presented to participants in ounces were 1.26 pretzels, 1.30 potato chips, 2.52 jelly beans, and 2.56 shortbread. After 20 minutes, the tray was taken away. Food consumption variables were created by subtracting post-offering weights from pre-offering weights, both measured in ounces. This was done per food type.
Analysis
Analyses were conducted using Statistical Package for the Social Sciences 24.0.
All 110 participants completed the laboratory session, but 11 were excluded from analyses either because they were determined after the fact to have not met the age inclusion criterion, due to a discrepancy between birthdate and self-reported age (n = 1) or did not adhere to laboratory preparation requests (n = 10). This resulted in an analysis sample of 99 participants, 44 categorized as lower in SES and 55 categorized as higher in SES.
Primary dependent variables (perceived stress and food consumption) were examined for normality using visual examination of histograms, skewness, and the Shapiro–Wilk test. Descriptive statistics afforded characterization of the sample. Inferential statistics were used to examine baseline and laboratory-derived variables as a function of SES category: unpaired t-tests for continuous variables and chi-square tests for categorical variables. Effect sizes for t-tests were evaluated using Cohen’s d, interpreted as small (near 0.20), medium (near 0.50), and large (near 0.80). A 2 × 2 mixed analysis of variance (ANOVA) was conducted to examine perceived stress as a function of SES category (lower or higher, a between-subjects variable) and assessment time point (pre- and post-challenge, a within-subjects variable). Effect sizes were evaluated using partial eta-squared and interpreted according to Leech et al. (2005): small (>0.01), medium (>0.06), and large (>0.14).
Mediation analysis was employed to examine the potential mediating roles of perceived stress and perceived challenge in explaining the association between SES and total food consumption. Two sets of analyses were run, the first treating perceived stress measured post-challenge as the mediator, controlling for perceived stress measured pre-challenge, SES category (lower or higher) as the predictor, and total food consumption as the criterion. The second set used the same predictor and criterion but a different mediator, namely, perceived task challenge. This was an average of perceived challenge ratings for the Stroop and mirror star tracing tasks. These analyses were conducted using Hayes’ (2013) PROCESS macro, a regression-based path analytic technique. Bootstrap methods were employed to test for an indirect effect and to compute bias-corrected confidence intervals for this effect using 10,000 replications with replacement.
Results
Sample characteristics
Table 1 lists demographic and anthropometric characteristics of the sample, as a function of SES category. The two SES groups differed, by design, with respect to education. They also differed with respect to age, employment status, marital status, and BMI. The lower SES group was younger, less likely to be employed, less likely to be married or cohabiting, and higher in BMI. The two groups did not differ with respect to baseline hunger or dieting attitudes as measured by the Eating Attitudes Test. They also did not differ with respect to dietary habits as measured from the 24-hour dietary recall completed 1 year prior: total energy, total fat grams, percentage of calories from fat, and total sugars.
Demographic and anthropometric characteristics as a function of SES.

All participants were female and non-Hispanic White. SES, socioeconomic status; SD, standard deviation.
Task performance and perceived task challenge
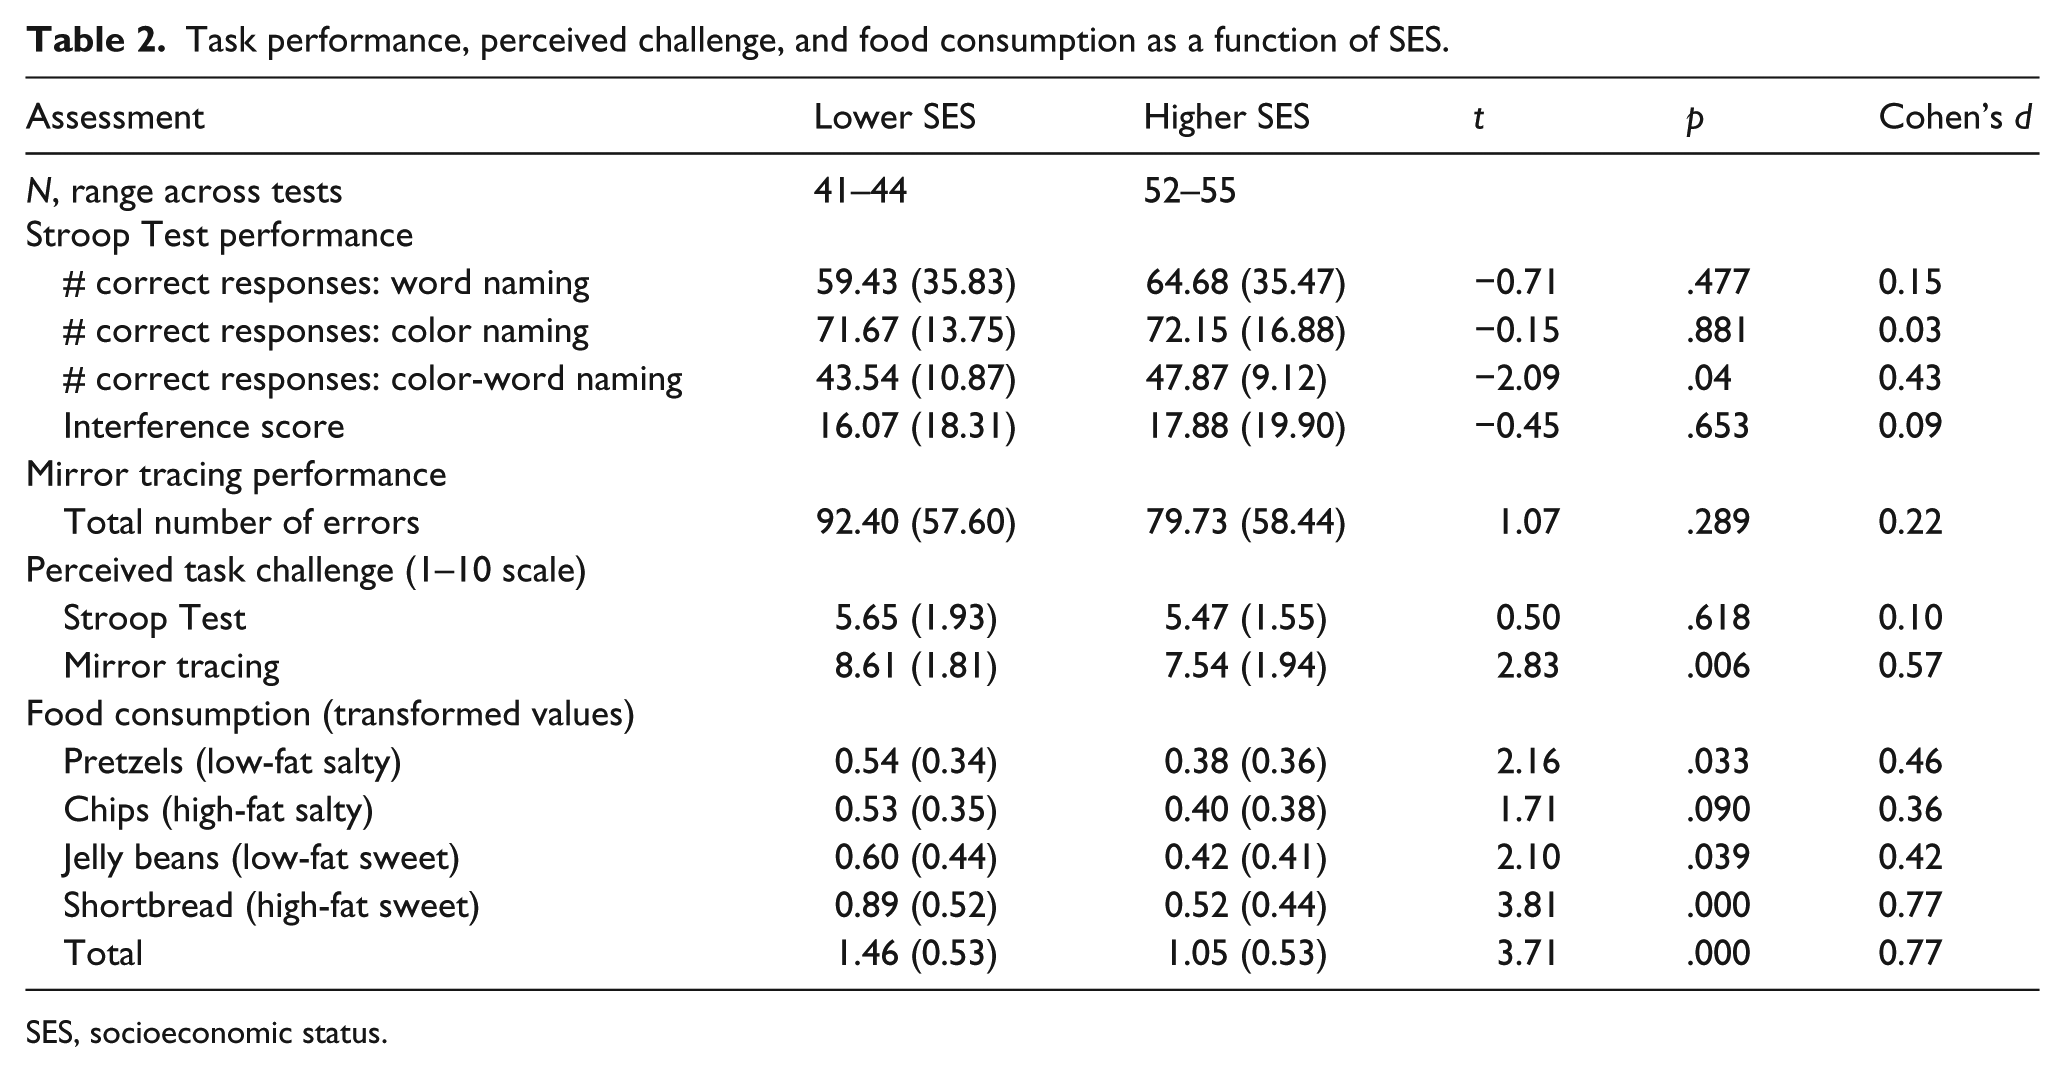
Table 2 displays challenge task performance data as a function of SES. Women lower in SES had fewer correct responses on the color-word naming portion of the Stroop task as compared to women higher in SES (d = 0.43, a small-moderate effect). The two groups did not differ with respect to interference on this same task, a measure of cognitive inflexibility, nor with respect to total number of errors on the mirror tracing task. With respect to perceived task challenge, the two groups did not differ in their perceptions of the Stroop Test but women lower in SES perceived the mirror star tracing task as more challenging than did women higher in SES (d = 0.57, a moderate effect).
Task performance, perceived challenge, and food consumption as a function of SES.
SES, socioeconomic status.
Perceived stress
A 2 (SES) × 2 (time) mixed ANOVA conducted on perceived stress scores yielded a marginally significant main effect of SES, F(1, 97) = 3.06, p = .083, partial η2 = .031 (a small effect). Women higher in SES reported more stress overall as compared to women lower in SES, M ± SE = 3.36 ± 0.24 and 2.73 ± 0.27. The analysis also yielded a main effect of time, F(1, 97) = 36.05, p < .001, partial η2 = .271 (a large effect). As expected given the manipulation, perceived stress was lower before the challenge tasks than after, M ± SE = 2.54 ± 0.20 and 3.55 ± 0.20. These two main effects were further qualified by an SES × time interaction, F(1, 97) = 9.47, p = .003, partial η2 = .089 (a medium effect). For the lower SES group, perceived stress increased from pre- to post-challenge, paired t(43) = –5.49, p < .001, d = 0.82 (a large effect). The same was true for the higher SES group, paired t(54) = –2.43, p = .018, but the effect was much smaller, d = 0.24. To test for between-group differences in this change over time, post-challenge minus pre-challenge perceived stress difference scores were created. An unpaired t-test conducted on these scores yielded a significant effect of group, t(97) = 3.08, p = .003. Means and standard errors per SES category and time point are shown in Figure 1.

Perceived stress ratings as a function of assessment time point and socioeconomic status (SES), M ± SE.
Food consumption
Food consumption variables were not normally distributed per visual examination of histograms, skewness values ranging from 0.82 to 2.18, and statistically significant Shapiro–Wilk tests (p < .001). To reiterate, these variables were created by subtracting post-offering food weights from pre-offering food weights per food category. After initial weighing, all four bowls were placed on a tray that was transported twice, once to deliver snacks to the participant in a different room and once to return them. Participants may have additionally moved the bowls though we have no way of knowing. A subset of pre–post food offering difference scores were negative in sign: two of the pretzel difference scores, ranging from −0.06 to −0.01; eight of the potato chip difference scores, ranging from −0.05 to −0.01; seven of the jelly-bean difference scores, ranging from −0.03 to −0.01; and 10 of the shortbread cookie difference scores, ranging from −0.04 to −0.01. This is likely due to measurement error associated with moving the bowls. Because the lower bound for the theoretical range of values is zero (no food consumed), negative values were interpreted as essentially no food consumed. Accordingly, we imputed these values as zero. After imputation for negative values, we normalized the data by taking the square root of each value. Unpaired t-tests (× SES category) were then conducted on transformed values. Results are presented in the lower portion of Table 2. As seen in the table, women in the lower versus higher SES group consumed more pretzels (a medium effect), more jelly beans (a medium effect), more shortbread cookies (a large effect), and more food overall (a large effect). Figure 2 presents mean ounces consumed per food type as a function of SES using raw, untransformed data for ease of interpretation.

Mean food consumption as a function of socioeconomic status (SES).
Mediation analyses
Table 3 presents results of mediation analyses, the first treating perceived stress measured post-challenge as the mediator, controlling for perceived stress measured pre-challenge, and the second treating perceived task challenge as the mediator. Evidence for mediation was found for the latter but not the former. SES was inversely related to both total food consumption (path c, p = .0003) and perceived task challenge (path a, p = .0337); perceived task challenge was inversely related to total food consumption (path b, p = .029). The mediation hypothesis was supported by a significant indirect effect as indicated by the confidence interval excluding zero (path a × b).
Results of mediation analyses.

Discussion
Results demonstrate that women lower in SES were more affectively and behaviorally reactive to the stress-induction paradigm than were women higher in SES. The manipulation was effective in increasing perceived stress levels from pre-to-post challenge in both groups, but the effect was much stronger for the lower SES group. While the two groups did not differ in self-reported hunger, eating attitudes or baseline dietary habits, women lower in SES consumed more low-fat salty food, more low-fat sweet food, more high-fat sweet food, and more food overall. Effect sizes varied per food group, largest (d = 0.77) for the high-fat sweet category and total consumption.
These results lend support for the notion that disparities in obesity among women may be due to stress-induced eating, bolstered by the finding that perceived task challenge mediated the inverse association between SES and total food consumption. Our findings are consistent with prior work reporting that stress can lead to increased food intake, more specifically, increased intake of high-fat, sweet foods (Macedo and Diez-Garcia, 2014; Macht, 2008; Tryon et al., 2013). Other laboratory-based studies have demonstrated that exposure to acute stress can influence food preference as well as the quantity of consumption (Rutters et al., 2008). In order to reduce feelings of stress, some women seek rewarding behaviors such as consuming palatable foods (Groesz et al., 2012; Tryon et al., 2013). Sugar and fat have been found to affect the brain in a manner similar to opiates, increasing feelings of reward (Cota et al., 2006) and altering one’s preference for these comfort foods (Tryon et al., 2013). Patterns of disinhibited, emotion- or stress-related eating have also been linked to a preference for comfort foods and to obesity (Haynes et al., 2003; Ozier et al., 2008). This makes sense in light of Schachter’s (1971) externality theory of obesity; those with obesity are more reactive to external cues such as the sight, smell, and taste of food, and less sensitive to internal, visceral cues.
The present study extends the literature on eating as a coping mechanism for stress by exploring differences in stress-induced eating as a function of SES. While the definition of lower SES used in this study included women with some college or an associate’s degree, we were still able to detect a significant difference in palatable food consumption between women lower and higher in SES. It is important to acknowledge that this study was a controlled, laboratory-based study and used neuropsychological tasks to induce stress. Research conducted in more naturalistic settings has shown that women lower in SES are more likely to experience prolonged exposure to chronic stress throughout the life course, thus the impact of real-world chronic stress on stress-induced eating may be even greater than what was observed in our laboratory setting (Chen and Miller, 2013). More research is needed to understand the source(s) of chronic stress in women lower in SES and its impact on weight gain in order to address disparities in obesity and metabolic diseases. Future research is also needed to understand the underlying factors that drive stress-induced eating in this population. Lower SES may limit one’s access to resources that promote healthy coping behaviors. For example, persons lower in SES typically have limited access to healthy foods, for example, no supermarket in their immediate neighborhood (Drewnowski, 2012).
Our findings offer implications for the design and conduct of behavioral interventions aimed at preventing weight gain among middle-aged women. Standard behavioral therapy for overweight and obesity could be augmented with stress-management strategies such as relaxation training and mindfulness (Cox et al., 2013). Studies have shown that behavioral interventions can successfully improve stress management (Katzer et al., 2008) and reduce emotional eating among obese women (Manzoni et al., 2009), but few studies have utilized interventions that simultaneously address health behaviors and stress management (Cox et al., 2013). Pilot studies conducted with overweight and obese women provide preliminary data indicating the superiority of a lifestyle plus stress-management intervention as compared to lifestyle alone (Christaki et al., 2013; Cox et al., 2013). While promising, additional work is needed to understand how behavioral interventions with lifestyle and stress-management components can effectively lead to weight loss and reduced stress in women lower in SES, and to elucidate pathways by which changes in perceived stress may affect weight loss outcomes (Sinha and Jastreboff, 2013).
Limitations of this study must be considered. First, we did not include a comparison, such as a no-stress or low-stress condition. While helpful to know that the two groups were equivalent at baseline with respect to typical dietary intake, this was assessed 1 year prior and therefore not a perfect “control.” Second, we used neuropsychological tasks to induce acute stress as opposed to other methods more socially evaluative in nature (Cacioppo et al., 1994; Dedovic et al., 2005; Kirschbaum et al., 1993). We were hesitant, for ethical reasons, to subject women of lower SES to a speech task in front of a staged, highly critical audience, assuming that this procedure would have been particularly challenging for them. Third, we approached only women in the non-Hispanic White cohort of the larger observational study, and not women in the Hispanic cohort. The decision to do so was based on two reasons: (a) We wanted to represent extreme ends of the education continuum and our Hispanic cohort was positively skewed with few cases at the higher educational end and (b) our baseline data revealed an inverse association between SES and BMI in the non-Hispanic White cohort but no association in the Hispanic cohort. Consequently, it made more sense in terms of maximizing resources and minimizing participant burden to assess the effects of acute stress on eating behavior in the cohort for which an association between SES and adiposity had been demonstrated. Nonetheless, generalizability is limited with respect to ethnicity and we also cannot draw any conclusions about how women with a 4-year college degree but not a post-baccalaureate degree (those excluded) might respond to an acute stressor. Fourth, internal consistency for the measure of eating attitudes was low.
Despite noted limitations, this study extends our understanding of SES and risk for obesity, building upon observational work noting an inverse association between SES and obesity among women (Pudrovska et al., 2014; Sobal and Stunkard, 1989; Zhang and Wang, 2004), and White women in particular (Kimm et al., 1996). Our findings indicate that perceived stress and stress-induced eating may play a role in explaining this association and consequently, be important targets for intervention (preventive or otherwise) for women of socioeconomic disadvantage.
Footnotes
Funding
The author(s) disclosed receipt of the following financial support for the research, authorship, and/or publication of this article: This work was supported by grant R01 DK079042 from the National Institutes of Health.