
Abstract
Although exercise is recommended by healthcare professionals for nearly everyone, adverse reactions can occur following exercising for some overweight individuals. The reported study investigated the cardiovascular consequences of exercise in a stressful environment. In all, 60 females completed two baseline and one biking (i.e. ergometer) periods while cardiovascular and self-report measures were recorded. Findings indicated that those who are more self-aware showed cardiovascular response patterns indicative of threat. Additionally, post-task exercise self-efficacy levels predicted intentions to exercise at a demanding level in the coming week. These findings suggest exercise may exacerbate health issues for some individuals for whom it is recommended.
Over 30 percent of Americans, roughly 78 million people, are obese putting them at risk for severe cardiovascular (CV) diseases, shorter lives, and diabetes (Flegal et al., 2010; Houston et al., 2009; Nguyen and Lau, 2012). Muennig et al. (2008) argue that the psychological burden of enduring obesity stigma in “body conscious” societies contributes to a shorter lifespan over and above obesity’s more physiological impacts (Crossley, 2004). Although physicians often recommend exercise to obese patients, recent work by Bouchard et al. (2012) demonstrated that exercise programs can cause adverse cardiometabolic reactions on risk factors (fasting insulin, triglycerides, systolic blood pressure (BP), and cholesterol carried in high-density lipoproteins) in small groups of overweight participants (8%–13% of the sample or potentially 8 million Americans). Bouchard and colleagues found that neither age nor race, gender, previous health status, or amount of completed exercise predicted these adverse reactions (Figure 1; Bouchard et al., 2012). To date, their cause remains to be determined. These findings suggest that exercise, widely endorsed as a panacea for excess body weight, may not have such universally positive consequences. The hypothesis that a stressful environment, one in which self-awareness (SA) is increased, will produce a maladaptive CV reactivity profile, causing a reduction in exercise self-efficacy (ESE) and intentions to exercise intensely (Figure 2) was tested.

Bouchard et al.’s (2012) model.

Theoretical model.
SA
Although mirrors are common fixtures in many gyms and health clubs, they may have unintended psychosocial consequences. As demonstrated by Wicklund and Duval (1971), viewing oneself via mirrors has been shown to increase levels of objective SA via self-evaluation, leading to increased awareness of the discrepancy between an individual’s current self and his or her “ideal” self (Mead, 1934). This “ideal” self is individual specific, aligns with his or her beliefs, and often serves as an impetus for behavior change (Markus and Nurius, 1986). They are the “selves” we would like to become but currently are not. Although activating an ideal self may seem beneficial, discomfort is associated with awareness of the disparity between current and ideal selves and the discomfort grows proportionally with the discrepancy, motivating individuals to reduce the discrepancy (Higgins, 1989). In their studies, Wicklund and Duval (1971) demonstrated that performance on a writing task increased when participants completed tasks in the presence of a mirror because participants were trying to behave more like their idealized self.
Importantly, in a situation in which there is a discrepancy between current and ideal self, the ideal self (or goal state) becomes salient. Consequently, the demands and intermediary steps associated with reaching the ideal self state also become salient (Wicklund and Duval, 1971). Therefore, individuals with increased SA during performance tasks should perceive increased demands when compared to nonself-aware individuals. Perceptions of demands and resources play a central role in CV reactivity to stressful tasks.
Biopsychosocial model of challenge and threat
The biopsychosocial (BPS) model of challenge and threat (Blascovich, 2008; Blascovich and Mendes, 2010) specifies motivational states that result from an individual’s implicit and explicit evaluations of task demands and personal resources. When individuals ascertain (either consciously or unconsciously) that they have greater resources than a performance task demands, they exhibit CV reactivity indicative of challenge. Conversely, if they ascertain that they do not have enough resources to meet task demands, they exhibit CV reactivity indicative of threat. In this study, the hypothesis that participants who experience elevated SA will perceive increased task demands and will consequently be more likely to experience a CV threat response (Figure 2) was tested.
The BPS model is based on the neuroendocrine theory of physiological toughness (Dienstbier, 1989). Specifically, in a motivated performance situation, sympathetic neural and adrenal medullary axis (SAM) activation occurs resulting in direct sympathetic enervation of the myocardium as well as adrenal medullary release of epinephrine that increases myocardial ventricular contractility (VC or pre-ejection period (PEP)*-1) and heart rate (HR). This CV reactivity pattern is common to both challenge and threat response states and indexes task engagement.
Given task engagement, when an individual’s evaluated resources meet evaluated task demands (state of challenge), epinephrine released via the SAM axis leads to decreased arterial contractility resulting in lower total systemic peripheral vascular resistance (TPR) and increased cardiac output (CO). In a state of threat, however (evaluation of fewer resources compared with demands), the hypothalamic pituitary adrenal axis (HPA) is activated simultaneously with the SAM axis. This results in releases of adrenal cortisol which counteracts SAM effects on TPR, leading to little change or an increase in TPR and little change or decrease in CO (Blascovich, 2008; Mendes, Blascovich, Lickel et al., 2002). This pattern of CV reactivity in psychologically threatening performance situations is critical as it has been found to be a significant, unique predictor of an individual’s future CV disease risk and CV health (Kelsey, 2004).
In the laboratory, electrocardiography (ECG), continuous mean arterial blood pressure (MAP) measurement, and impedance cardiography (ICG) are used to quantify four indexes of SAM axis reactivity: VC, which is primarily sensitive to β-adrenergic sympathetic influences; HR, which is sensitive to both parasympathetic and β-adrenergic sympathetic influences; and CO and TPR, which are subject to both α-adrenergic vasoconstrictive and β-adrenergic vasodilatory sympathetic influences (Cacioppo et al., 1994; Goldstein et al., 2003; Obrist, 1981; Sherwood et al., 1986, 1990). Hence, changes in these indexes reflect changes in individuals’ task resource and task demand balance and have been shown to predict concurrent (Tomaka, Blascovich, Kelsey et al., 1993; Tomaka, Blascovich, Kibler et al., 1997) and future physical and cognitive performance. In addition to the four standard metrics indexing challenge and threat, this study assessed arterial oxygen saturation (PuOx) level and rate pressure product (RPP). PuOx is the percentage of hemoglobin saturated with oxygen (Wasserman et al., 2004), and RPP is a metric of the energy consumption of the heart and stress in the cardiac muscle (Smith and Fernhall, 2010). Unnecessary effort via the cardiac muscle can have serious implications for the CV fitness of threatened/stigmatized individuals (Kelsey, 2004; Blascovich, Mendes, Hunter et al., 2001).
Empirical support for the model shows that changes in these indexes reflect changes in individuals’ task resource and task demand balance and have been shown to predict concurrent (Tomaka, Blascovich, Kelsey et al., 1993; Tomaka, Blascovich, Kibler et al., 1997) and future physical and cognitive performance in a variety of domains (see Blascovich, 2008; Blascovich and Mendes, 2010 for review). For example, during a speech task about expected performance efficacy and ability during an upcoming season, baseball and softball player’s CV reactivity profile was a strong predictor of athletic performance and efficacy for the upcoming season (Blascovich, Seery, Mugridge et al., 2004).
In addition, when motivated performance includes metabolically demanding tasks, research demonstrates that the CV system works harder but less efficiently for someone experiencing greater task demands (Rouselle, Blascovich and Kelsey, 1995). In this study, participants pedaling a stationary bike while doing serial subtraction aloud showed greater CV response (CO, VC, and HR) than during either task conducted alone. However, the physical effort alone dictated the amount of inspired oxygen.
Crucially, if one exercises while threatened, due to the relative increases in TPR and decreases in CO, active muscles will receive less oxygenated blood needed to produce adenosine triphosphate energy (ATP; Rowell et al., 1964) and result in an increase in lactic acid production and accumulation in the blood stream. As exercise continues, anaerobic metabolism will occur such that internal carbohydrate stores will be metabolized instead of fat stores in order to use available blood oxygen most efficiently. Importantly, anaerobic metabolism persists for short periods of time (usually around 1 minute), before the individual fatigues and must stop activity (Wasserman et al., 2004). Therefore, during exercise, a psychologically threatened individual will place more stress on the cardiac muscle, derive less CV and fat burning benefits from exercise, and may not be able to exercise as long as an individual in a state of challenge (Kelsey, 2004). Thus, the BPS model predicts that exercise under conditions of psychological threat can have negative consequences.
ESE
Although many know that daily exercise and healthy eating are essential for maintaining physical well-being, less than half of American adults complete enough exercise (Center for Disease Control, 2012) to do so. Self-efficacy may play an important role. According to Self-Efficacy Theory (Bandura, 1982), people must believe that they are able to perform a task well, even in potentially threatening situations, to perform well. As reviewed by Samson and Solomon (2011), the appraisal and integration of past accomplishments, social and verbal persuasion, vicarious experiences, and physical and emotional states combine to form an individual’s self-efficacy level that is relatively stable over time (Chen et al., 2001; Strecher et al., 1986). Maintaining high self-efficacy beliefs requires managing stressors by re-evaluating task demands and available resources (Chemers et al., 2001; Feltz et al., 2008).
In a study by Katula and McAuley (2001), healthy participants exercised in front of a mirror or in the absence of a mirror. Compared to the no-mirror condition, participants in the mirror condition reported increases in ESE immediately post-exercise and 20 minutes later. However, Song et al. (2011) found that visual reflection does not affect everyone positively. In their study of normal and slightly overweight individuals, participants played an exercise video game while seeing themselves on a television screen. Participants who were dissatisfied with their weight experienced decreased ESE and decreased enjoyment following exercise (Simonavice, 2008; Song et al., 2011).
Self-efficacy for exercise can affect obese individuals adversely because of the established relationship between ESE and exercise behaviors. People with high ESE levels persist longer at physical tasks, exercise more, and are more likely to pursue challenging goals, cope with pain, and persevere through setbacks (Chuang et al., 2003; Hankonen et al., 2010; Hutchinson et al., 2008; Llewellyn et al., 2008). Additionally, ESE levels should be associated with perceptions of greater resources relative to demands allowing for more adaptive coping with potentially stressful stimuli (Chemers et al., 2001). Therefore, since physical state influences ESE levels and ESE levels influence exercise behavior, CV states of threat can have negative, long-term consequences on future exercise.
Overview: SA, challenge and threat, self-efficacy, and exercise
This study manipulated the saliency of discrepancies between ideal and perceived body weight to increase psychological threat during exercise and assessed its effect on CV indices, ESE, and intentions to exercise strenuously. In the laboratory, participants who reported being heavier than their ideal weight cycled on an ergometer either in the presence or in the absence of a mirror, while physiological responses were recorded. Participants subsequently reported their ESE level and intentions to exercise intensely in the coming week. The hypothesis that participants who experienced elevated SA would be more likely to experience a threat (i.e. maladaptive) pattern of CV responses, decreased ESE levels, and decreased intentions to exercise intensely in the coming week (see Figure 2 for a theoretical model, path A) was tested. Importantly, due to the metabolically demanding nature of the task, the threat pattern of CV responses was expected to occur during the latter minutes of the task (minutes 3–5; Rouselle et al., 1995). Additionally, given that interpretation of physical and emotional states can influence ESE levels, it was hypothesized that participants with CV threat profiles would report lower levels of ESE after the task that would subsequently reduce intentions to exercise strenuously in the future (see Figure 2, path B). This reaction to a novel exercise environment could explain why the overweight participants in Bouchard et al.’s (2012) analysis experienced adverse reactions on the cardiometabolic risk factors after exercising (Figure 1).
Method
Participants
In all, 60 female undergraduates (50% White, 20% Hispanic/Latino, 16.7% Asian American, and 10% Other or multiple ethnicities) from the Introductory Psychology and Experimental Psychology subject pool at University of California, Santa Barbara (UCSB) were recruited to participate in exchange for course credit. The sample was restricted to women because of the increasing number of CV disease-related deaths in women, rising body mass index (BMI) levels among women, and because “obesity is a severely stigmatized condition among women” (Ford et al., 2007; Roger et al., 2011; Sobal and Stunkard, 1989). Additionally, women are more likely to describe themselves as “fat,” regardless of their BMI (Furnham et al., 2002). Perceived weight normality and body size are often more important in determining physical and mental states than actual weight (Muennig et al., 2008). Therefore, only women who initially rated their current weight as above “ideal” were recruited to participate in this study.
Participants between the ages of 18 and 21 (M = 18.59, standard deviation (SD) = .99) within a normal to obese range on BMI (M = 23.60, SD = 3.26, range = 18.75–35.65) were recruited. Based on Center for Disease Control guidelines, 71.2 percent (n = 42) were normal weight, 25.4 percent (n = 15) were overweight, and 3.4 percent (n = 2) were obese. Participants were screened for major heart conditions, medications, pregnancy, and other serious medical conditions.
Design
This study involved one between-subjects factor (SA: mirror vs no mirror) and one within-subjects factor (5-minute baseline 1, 5-minute baseline 2, and 5-minute task). During the task, each participant cycled on an ergometer. The three dependent measures included were CV patterns, ESE, and intentions to exercise intensely the following week.
Procedure
Prior to arrival at the laboratory, participants completed a measure of perceptions of ideal body weight. In order to avoid any potential influence on the physiological measures, participants were also asked to abstain from caffeine for at least 2 hours (Astrup et al., 1990). Upon arrival at the laboratory, CV leads and sensors were attached to participants and subsequently, the participant completed a seated, resting 5-minute baseline period. The participants then entered the ergometer room and were randomly assigned to condition using a random number generator; for half of the participants, there was a mirror enabling them to see their full body image. A second baseline period was conducted while participants sat on the ergometer without pedaling. Participants then exercised at a constant 100-W workload for 5 minutes on an electronically controlled upright pedacycle ergometer (Kettler Model E3; Rouselle, Blascovich and Kelsey, 1995) in the presence or the absence of a mirror. Finally, all sensors and leads were removed and participants completed a post-experimental questionnaire (the Self-Efficacy to Regulate Exercise Scale, and a measure of daily average physical activity; Aadahl and Jorgensen, 2003; Bandura, 2006). Participants’ height and weight were measured and then they were thanked and debriefed.
Measures
Weight perception
Perception of ideal body weight was measured via a single item during the pre-screening process. Participants were asked to rate themselves on a 1–7 scale, with “much thinner than ideal weight” at 1, “at my ideal weight” at 4, and “much heavier than my ideal weight” at 7. All participants rated themselves as a 5 or above (5: n = 47; 6: n = 6; 7: n = 7). Importantly, the participant’s BMI and perceptions of ideal body weight were not significantly correlated (r(59) = .158, p = .233) lending support to the argument that the psychological perceptions of weight normality contributes to stress responses uniquely (Muennig et al., 2008).
Height and weight were self-reported by the participants in the post-task survey and were also measured by the researcher. Although the weight measurements showed high consistency (r(57) = .95, p < .001), participants tended to significantly under-report their body weight (M = −4.161, SD = 6.4) compared to the actual measured weight, t(57) = 5.49, p < .001.
Physiological measures and apparatus
The physiological measures including HR, stroke volume (SV), CO, PEP, PuOx, and BP were measured continuously and noninvasively according to established guidelines (e.g. Sherwood et al., 1990) throughout baseline and task periods. A Biopac MP150 system (by Biopac) with an ICG and Continuous Noninvasive Arterial Pressure (CNAP) Monitor 500 (by CNSystems) continuously inflated BP monitor provided the physiological signals.
ICG and ECG recordings provided continuous measures of cardiac performance (SV, HR, and CO). Two pairs of mylar tape band electrodes (separated by at least 3 cm) encircled the participant’s neck and torso (thorax at the xiphisternal junction; Sherwood et al., 1990). These provided basal transthoracic impedance (Z0) data and the first derivative (dZ/dt) of pulsatile changes in transthoracic impedance, sampled at 1 kHz. The ECG recordings were obtained with a Modified Lead II configuration (the right lead below the clavicle and the left lead on the left side of the torso below the ribcage). A 400-µA (rms) DC 50 kHz current passed through the two outer electrodes and measured impedance from the two inner electrodes.
Arterial oxygen saturation levels were measured noninvasively via a finger pulse oximetry transducer placed on the participant’s right index finger (Mengelkoch, Martin and Lawler, 1994). Additionally, the CNAP Monitor enabled collection of continuous noninvasive recordings of BP from the brachial artery of participants’ left arm. Data were integrated via the MP150 and displayed and stored with Acqknowledge software (Biopac; Goleta, CA). Mindware software (Mindware Technologies Limited, Gahanna, OH) was used to edit artifacts and ensemble and score the CV data in 60-second intervals. Four measures of cardiac performance: VC (PEP), HR, TPR (derived from BP and CO), and CO were used to distinguish between states of challenge and threat while RPP and PuOx levels were assessed for their correlational strength with these four original measures. Scoring was performed blind to other participant data.
ESE
The Self-Efficacy to Regulate Exercise Scale (Bandura, 2006) required participants to rate how certain they were that they could perform their exercise routine three or more times per week given a number of common obstacles. All responses were given on an 11-point scale ranging from 0 (cannot do at all) to 10 (highly certain can do) after completing the stationary biking task. Reliability among items was (Cronbach’s α = .92). An average ESE value was calculated by taking the mean value of all 18 items (post-ESE M = 6.19, SD = 1.69).
Physical activity questionnaire
After the biking task, participants completed the Physical Activity Questionnaire (PAQ; Aadahl and Jorgensen, 2003) describing the total time spent on each of nine physical activity levels on an average day in the coming week (24 hours, in total): 1, sleep or rest; 2, sitting quietly or watching television; 3, working at a desk or eating; 4, standing or driving a car; 5, light cleaning or walking downstairs; 6, biking to work or brisk walking; 7, gardening or carrying light objects upstairs; 8, aerobics or health club exercises; 9, running or racing at higher intensity than level 8. Although all nine levels were collected, the levels of most importance were levels 8 and 9 that correspond to high-energy expenditure behavior, so a composite score was created by adding levels 8 and 9 activities.
Results
Hypothesis A: environment moderates the relationship between exercise and CV outcomes
To test hypothesis A outlined in the theoretical model (Figure 2), repeated measures analysis of covariance (ANCOVA) were used to assess the effect of SA condition (creating the task environment) on the last three task minute values for the six physiological indices, 1 with SA condition serving as the independent variable and the baseline physiologic value serving as the covariate. It was hypothesized that increased SA (via the mirror manipulation) would result in patterns of increased threat reactivity (i.e. increased HR, increased VC, increased TPR, and decreased CO) as well as decreased PuOx and RPP values.
Preparation of physiological measures to test hypothesis A
Baseline periods
To ensure there were no differences in participants’ physiological responses during the rest periods as a function of experimental condition, multiple t-tests were performed comparing minutes 4 and 5 of baseline 1 and 2 across all six physiological indicators (CO, HR, VC (PEP), TPR, PuOx, and RPP). Across all 24 comparisons, 11 reached statistical significance (with baseline 2 values being lower). Because the baseline represents the lowest resting point, baseline 2 values were created by averaging minutes 4 and 5 of baseline 1 and 2 in each index (six baseline values were created).
Reactivity values
CV reactivity values were calculated by subtracting the baseline 2 value from each of the five biking task physiologic values, for a total of five reactivity values per index (in total, 30). Values exceeding ±2.6 SDs from the mean (p = .01 in a normal distribution) were identified as extreme and were winsorized by assigning them a value 1 percent higher (or lower) than the next-highest value (Tabachnick and Fidell, 2012). Among the thousands of CV data points, 12 data points were winsorized.
Although the use of change scores is sometimes discouraged on psychometric grounds (e.g. Cronbach and Furby, 1970), changes from baseline have meaning in BPS physiological studies because in addition to comparing challenge and threat across groups in an experimental design, reactivity is also tested against zero to determine whether changes from baseline are significant. Research has shown that change scores are as reliable as residualized change scores but to prevent unreasonably high correlations between baseline and reactivity values, baseline values were entered as a covariate (Llabre et al., 1991).
Task engagement
As task engagement is a pre-requisite for challenge and threat, we first examined whether participants were engaged in the biking task prior to testing for CO and TPR differences. T-tests were used to assess whether HR and PEP reactivity values, which index task engagement (Blascovich, 2008), differed significantly from zero. In all task minutes in both SA conditions, task engagement was evidenced by significant increases in HR and VC reactivity (i.e. decreases in PEP from baseline) (all t-tests significant at p < .05).
Analysis of physiologic measures to test hypothesis A
HR
There was a main effect of SA condition on HR, F(1, 52) = 7.121, p < .01. Women in the low SA condition experienced higher HR than the women in the elevated SA condition (Figure 3). This indicates that women in the higher SA condition did not work as hard as women in the lower SA condition.

Heart rate reactivity by environmental condition.
VC (pre-ejection period)
As expected, VC reactivity revealed a similar pattern to HR reactivity; there was a main effect of SA condition on VC, F(1, 54) = 8.26, p ⩽ .01. Women in the higher SA condition exhibited lower VC (or shorter PEP times) than the women in the lower SA condition (Figure 4). This indicates that women with elevated SA did not work as hard as women in the low SA condition.
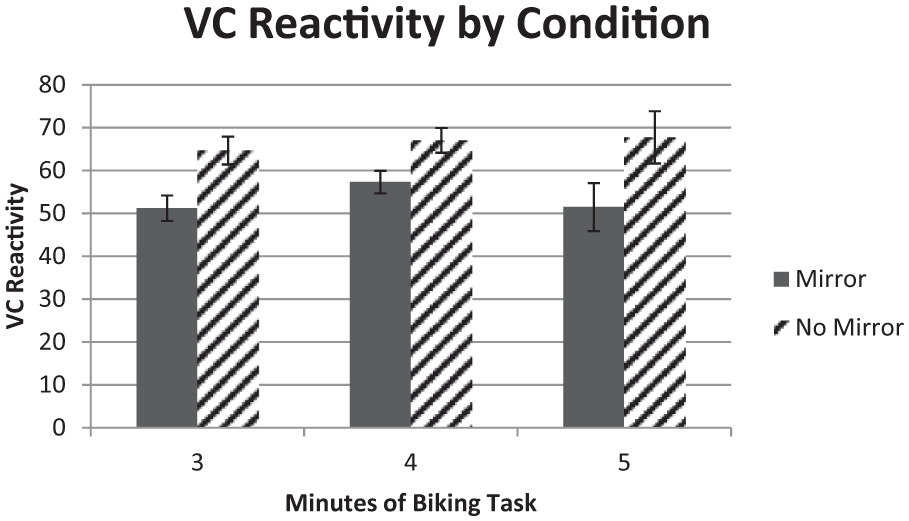
Ventricular contractility reactivity by environmental condition.
Cardiac output
There was no main effect of SA on CO during the biking task, F(1, 52) = .185, p = .668.
Total peripheral resistance
Overall, there was no main effect of SA condition on TPR, F(1, 42) = 2.316, p = .136. Women in the higher SA condition showed higher levels of TPR (threat) than women in the lower SA condition (Figure 5). Although SA did not effect TPR values in minute 3 (p = .471), SA condition was a significant predictor of TPR in minutes 4 and 5 (p = .05 and .04, respectively).

Total peripheral resistance reactivity by environmental condition.
Pulse oxygen arterial saturation
No significant effects emerged when assessing effects of SA on PuOx, F(1, 39) = .421, p = .52. PuOx reactivity values were also not significantly correlated with TPR reactivity values (p > .32).
RPP
There was a trend of SA on RPP reactivity, F(1, 42) = 2.452, p = .125. Women in the elevated SA condition had lower RPP values than women in the low SA condition (Figure 6).

Rate pressure product reactivity by environmental condition.
Analysis of self-report measures to test hypothesis B: CV reactivity influences ESE and exercise
Finally, regression and correlation analyses were used to test the directional relationship between CV reactivity, ESE, and future exercise (i.e. Hypothesis B in Figure 2). To begin with, the relation of physiological reactivity profile on ESE was tested by entering the TPR baseline 2 value in step 1 and TPR reactivity values from minutes 3 to 5 in step 2. Contrary to our initial hypothesis, the regression revealed that TPR was not a significant predictor of ESE post-task, F(4, 40) = .296, p = .88.
To further assess how ESE predicts intentions to exercise strenuously in the coming week, 2 a correlation was used. As predicted, individuals with higher ESE post-task indicated increased intentions to exercise strenuously in the coming week, r(59) = .26, p = .05.
Discussion
As hypothesized, elevated SA had effects on CV indices, ESE, and intentions to exercise. After controlling for baseline CV values, SA significantly predicted HR, VC, and TPR and revealed trends for RPP reactivity values. Participants in the mirror condition exhibited increased CV evidence of threat and decreased work output. Additional analyses revealed that while CV reactivity did not predict post-task ESE levels, post-task ESE levels did predict intended strenuous future exercise.
Relating these findings to the research of Bouchard et al. (2012), perhaps the obese patients in their study experienced adverse reactions to the physical exercise not because of any demographic indicator, but because these individuals, like the participants in this study, exercised in an environment inducing a state of threat. In this study, the women in the elevated SA condition exhibited CV patterns suggestive of threat and decreased work output as indexed by HR, VC, and RPP. Most importantly, the increased SA created by exercising in the mirror made the ideal self more salient, ultimately resulting in a maladaptive CV reactivity profile. Over time, maladaptive CV responses strain the CV system, putting people at a disadvantage in exercise domains since increased TPR responses decrease available oxygen supply in the peripheral arteries.
While this study involves a unique merger of CV, psychological, and physiological variables, there are limitations that must be addressed. To begin, there was a failure to find support for the hypothesis that CV threat reactivity produces decreased levels of ESE. Although initially this was regarded as counterintuitive given that current physical and emotional states are interpreted and integrated into ESE levels, the findings are not surprising given that self-efficacy levels tend to be relatively stable (Chen et al., 2001). Even so, the manipulation may need to be strengthened in future iterations of the studies. Additionally, field studies that assess experiences in exercise environments, CV reactivity, and ESE levels over many months could provide more insight into the relationship between negative physical and emotional states and ESE levels.
This study has implications not only for the exercise domain, but also for healthcare more generally. When designing exercise spaces, particularly those catering to stigmatized groups, it is critical that such spaces engender a feeling of safety, comfort, and attainability in hopes of maintaining ESE levels so as to keep individuals in an adaptive CV reactivity profile. Additionally, while many physicians advocate exercise as a weight loss tool, this “one size fits all” suggestion may have critically negative consequences for individuals who have low ESE. In this study, increased saliency of the discrepancy between ideal and actual body weight induced a state of threat that added increased strain to the heart and CV system.
Given that this study involved 60 healthy undergraduate students, future research should be conducted that addresses a larger and more diverse sample since factors such as ethnicity and age have been shown to be important factors in understanding patterns in obesity research (White et al., 2004). Future research should also incorporate designs in which participants engage in exercise situations designed to increase perceptions of resources. In this way, many of the features espoused by gyms to make a comforting and welcoming environment (i.e. increasing perceived resources) can be tested experimentally. Perhaps single-sex gyms do make it more welcoming or perhaps the type of equipment offered is more important to feelings of efficacy. As more scenarios are utilized experimentally, more beneficial exercise environments can be created for interventions and treatments.
Although this study represents a preliminary assessment of exercise environments on physiological and self-efficacy reactions, the findings presented here suggest that physical environment, mental perceptions, and physical size do not separately predict how an individual will react to a new exercise situation. By assessing the relationship between these variables, the medical and research community can create situations that encourage all types of individuals to be successful and to maximize the benefits of CV exercise, particularly those who need it the most.
Footnotes
Funding
Funding for publication of this article was provided by the UCSB Open Access Fund.