
Abstract
Background:
The COVID-19 pandemic caused considerable disruption to health care services. Limited data exist on its impacts on clinical outcomes and health care utilization in patients with advanced chronic kidney disease (CKD).
Objective:
To compare the rates of all-cause mortality, cardiovascular-related hospitalizations, kidney-related outcomes, and health care utilization in patients with advanced CKD before and during the first 21 months of the COVID-19 pandemic.
Design:
Population-based, repeated cross-sectional study from March 15, 2017 to November 15, 2021, with follow-up until December 14, 2021 (preceding the Omicron variant).
Setting:
Linked administrative health care databases from Ontario, Canada.
Participants:
Adult patients with advanced CKD, defined as an estimated glomerular filtration rate <30 mL/min/1.73 m2 (excluding patients receiving maintenance dialysis).
Measurements:
The pre-COVID-19 period was from March 15, 2017 to March 14, 2020 and the COVID-19 period was from March 15, 2020 to December 14, 2021. Poisson generalized estimating equations were used to predict post-COVID-19 patient outcomes and health utilization based on pre-COVID trends, estimating relative changes between the observed and expected outcomes. The multivariable model incorporated age group-sex interaction terms, a continuous variable denoting time in months to capture general trends, and pre-COVID month indicators to adjust for seasonal changes.
Methods:
Our primary outcome was all-cause mortality. Secondary outcomes included all-cause hospitalizations, non–COVID-19-related deaths and hospitalizations, intensive care unit (ICU) admissions, mechanical ventilation, and emergency room visits. We also examined cardiovascular-related hospitalizations, kidney-related outcomes, and ambulatory visits.
Results:
We included 101 688 adults with advanced CKD. The incidence of all-cause mortality was 147.4 (95% confidence interval [CI] = 145.1, 149.7) per 1000 person-years in the pre-COVID-19 period compared to 150.8 (95% CI = 147.9, 153.7) per 1000 person-years in the COVID-19 period. After adjustment, there was an 8% higher rate of all-cause mortality during the COVID-19 (adjusted relative rate [aRR] = 1.08, 95% CI = 1.03, 1.12). Non–COVID-19-related deaths did not increase substantially (aRR = 1.02, 95% CI = 0.97, 1.07). The COVID-19 period was associated with a lower rate of all-cause hospitalizations, ICU admissions, and emergency room visits. There were declines in long-term care admissions and non-nephrology physician visits in the first 3 months of the pandemic. In contrast, nephrology visits remained stable throughout the study period, including the first 3 months of the pandemic. Similarly, the monthly rates of acute kidney injury requiring dialysis initiation showed little variation compared with pre-pandemic levels.
Limitations:
Due to data availability at the time of analysis, we did not examine the impact of the COVID-19 pandemic on patients with advanced CKD beyond December 2021.
Conclusions:
Non–COVID-19-related deaths did not increase during the first 21 months of the pandemic, despite reduced health care utilization. The study informs health service planning in future health care emergencies.
Introduction
Chronic kidney disease (CKD) is an independent risk factor for poor health outcomes, including hospitalizations, cardiovascular events, and mortality.1 -5 Compared to the general population, previous research has suggested that people with CKD were more vulnerable during the COVID-19 pandemic,1,6,7 experiencing higher morbidity and mortality associated with SARS-CoV-2 infections.8 -11 In Ontario, Canada, during the first wave of the pandemic, 34% of patients with advanced CKD (mean estimated glomerular filtration rate [eGFR] of 18.3 mL/min/1.73 m2) who tested positive for SARS-CoV-2 infection died within 60 days. This fatality rate remained high at over 20%, during the subsequent 2 waves of the pandemic. 12
Between March 2020 and October 2022, there were 7.9% (n = 58 331) more deaths than expected if there was no pandemic in the general Canadian population, of which 43 635 (74.8%) were directly attributable to SARS-CoV-2 infection. 13 Between March 2020 and June 2021, there was a substantial decrease in health care utilization, with an 11% reduction in hospitalizations, 560 000 canceled or delayed surgeries, 9300 fewer emergency room visits, and a substantial reduction in physician visits. 14
The effect of the COVID-19 pandemic on patients with advanced CKD not on dialysis is less well understood.1,6,7 Understanding the direct and indirect effects of the pandemic on this unique patient population may inform health policy and health service planning for future pandemics. This study aimed to examine the rates of all-cause mortality, non–COVID-related deaths, health care utilization, cardiovascular-related hospitalizations and kidney-related outcomes before and during the first 21 months of the COVID-19 pandemic (ie, pre-Omicron-COVID-19) in patients with advanced CKD from Ontario, Canada. We hypothesized that all-cause mortality would substantially increase during the pandemic due to the direct and indirect effects of COVID-19.
Methods
Design and Setting
We conducted a population-based, repeated cross-sectional study using administrative health care databases from Ontario, Canada held at ICES (ices.on.ca/). These data sets were linked using unique encoded identifiers and analyzed at ICES. ICES is an independent, non-profit research institute whose legal status under Ontario’s health information privacy law allows it to collect and analyze health care and demographic data, without consent, for health system evaluation and improvement. The use of data in this project was authorized under section 45 of Ontario’s Personal Health Information Protection Act (PHIPA) and does not require review by a Research Ethics Board. The reporting of this study follows the Reporting of studies Conducted using Observational Routinely-collected health Data (RECORD) Statement (Supplemental Table S1). 15
Data Sources
We used the Ontario Laboratories Information System (OLIS) to obtain information on serum creatinine to calculate the eGFR using the 2021 CKD-EPI creatinine equation without race adjustment. 16 The Ontario Renal Reporting System was used to identify individuals with a history of maintenance dialysis. The Registered Persons Database (RPDB) captured demographic information and vital status, and the Ontario Health Insurance Plan (OHIP) captured physician billing and diagnostic codes. The Canadian Institute for Health Information’s Discharge Abstract Database/Same Day Surgery database provided information on diagnostic and procedural codes during hospitalizations, and the National Ambulatory Care Reporting System identified emergency department visits. We used the Ontario Drug Benefits (ODB) database to identify medication use in individuals who were ODB eligible (ie, 65 years or older or residing in a long-term care facility, special care home, or community home, 24 years or younger, receive professional home and community care services, receive Ontario Works or Ontario Disability Support Program benefits, or enrolled in Trillium Drug Program). 17 To identify deaths and hospitalizations associated with COVID-19, we used the Case and Contact Management System (CCM) (ie, the central data repository for Ontario’s COVID-19 reporting with public health units required to collect COVID-19 data for surveillance under the Health Protection and Promotion Act) and the ICES-derived COVID-19 Integrated Testing Dataset (derived from OLIS, distributed testing data from laboratories within the COVID-19 diagnostic network, and CCM). Supplemental Appendix Table S2 summarizes the details of databases and coding definitions used in this study.
Cohort
Time periods
We created monthly cross-sectional populations of adults with advanced CKD between March 15, 2017, and November 15, 2021. We chose monthly populations to capture the frequent changes during the pandemic. In Ontario, COVID-19 waves occurred from March to August 2020 (first wave), September 2020 to February 2021 (second wave), March to July 2021 (third wave), and August to December 2021 (fourth wave). 18 We selected March 15, 2020 (date that the province of Ontario mandated scaling down non-emergent clinical activities) as the beginning of the COVID-19 pandemic period. 19 On December 30, 2021, the province of Ontario introduced restrictions to laboratory-based real-time polymerase chain reaction tests, which limited eligibility for testing only to high-risk individuals (with the exception of solid organ transplant recipients) or symptomatic individuals working in high-risk settings. Owing to these restrictions, we selected December 14, 2021 as the last date of follow-up. There were a total of 57 unique monthly populations, with 36 before the COVID-19 pandemic (March 15, 2017 to March 14, 2020) and 21 during the pre-Omicron period of the COVID-19 pandemic (March 15, 2020 to November 15, 2021).
Study population
Each month, we identified adults from Ontario, Canada, with advanced CKD, defined as 2 eGFR measurements <30 mL/min/1.73 m2 separated by at least 90 days but no more than 365 days. We excluded the following people: non-Ontario residents; those who died before the start of the monthly interval; those younger than 18 years; and those with prior evidence of maintenance dialysis or a kidney transplant. An individual could be included in multiple months across the study period.
Outcomes
Overview
To provide a comprehensive understanding of the effect of the COVID-19 pandemic on patients with advanced CKD, we examined clinical outcomes and those related to access to health care, all occurring within the respective month. Before reviewing the results, we hypothesized the anticipated direction of the effect of the COVID-19 pandemic on each outcome (Supplemental Table S3).
Primary outcome
Our primary outcome was all-cause mortality during each month, using validated codes to capture all-cause mortality in administrative databases. 20
Secondary outcomes
Secondary outcomes, all measured within each respective month, included non–COVID-19-related deaths, all-cause hospitalizations (excluding elective surgeries), non–COVID-19-related hospitalizations (excluding elective surgeries), intensive care unit (ICU) admissions, non–COVID-19-related ICU admissions, hospitalizations with mechanical ventilation, and emergency department visits. A non–COVID-19-related death was defined as one that was not associated with a positive SARS-CoV-2 polymerase chain reaction (PCR) test in the preceding 30 days. Similarly, a non–COVID-19-related hospitalization was one that was not associated with a positive SARS-CoV-2 test in the 14 days prior to or 3 days after hospital admission. A non–COVID-19-related ICU admission was defined using the same criteria. Our definition of COVID-19 hospitalizations and deaths aligns with those used in other studies.21,22
Other outcomes
We examined cardiovascular hospitalizations, defined as a hospital admission with myocardial infarction, congestive heart failure, or ischemic stroke. We evaluated the initiation of maintenance dialysis, acute kidney injury requiring dialysis in an ICU setting, acute kidney injury requiring dialysis during any hospitalization (ie, ICU and non-ICU), the lowest eGFR in the 7 days before dialysis initiation (dialysis defined as evidence of at least 1 dialysis billing code, and eGFR presented as a mean), long-term care admission, and physician visits (ie, nephrologist, family physician, and non-nephrologist specialist visits). Further details can be found in Supplemental Table S2.
Statistical Analysis
We reported baseline characteristics at 3 time points: before the COVID-19 pandemic (March 15, 2017) and the latter 2 during the pandemic (March 15, 2020 and November 15, 2021). Individuals who died, initiated maintenance dialysis, received a kidney transplant, or showed evidence of kidney function recovery (ie, at least 1 eGFR measurement ≥30 mL/min/1.73 m2) were not included in the next month’s population. However, patients who were excluded due to recovered kidney function could re-enter the cohort provided they met the kidney function criteria later (defined as 1 eGFR <30 mL/min/1.73 m2). For all outcomes, we calculated monthly rates per 1000 person-years and their 95% confidence intervals (CIs). We also combined the monthly rates to present an overall rate before the COVID-19 pandemic and during the pandemic.
We used Poisson generalized estimating equations, accounting for clustered count data within the age group-sex-month strata, to model the pre-COVID period trends (March 15, 2017 to March 14, 2020) for each outcome of interest and used this to predict the trend during the COVID-19 period (March 15, 2020 to December 14, 2021) that would have been expected in the absence of the pandemic. Specifically, the model included the log of the stratum-specific population as the offset and assumed a first-order auto-regressive as the working correlation structure. The multivariable Poisson model included the following covariates: age group-sex indicators, a linear term measured as months since March 15, 2017 (to estimate the general trend for the entire study period), and pre-COVID month indicators (to account for the seasonality of the rates). The linear combination of the pre-COVID regression coefficient to the post-COVID age group-sex-month strata generated the expected rate during the pandemic after exponentiating. The relative change was estimated as the ratio of the observed and expected rates, with associated 95% CIs. We also reported the observed and expected rates per 1000 patients with CKD for each month. Similar methodology has been used in previous work.23,24
We considered a 2-sided P-value of < .05 to be statistically significant, and we did not adjust confidence interval widths for multiple testing. All analyses were conducted using SAS version 9.4 (SAS Institute, Cary, North Carolina).
Results
Baseline Characteristics
We included 101 688 unique adults with advanced CKD, of which 98 353 (96.7%) were present in more than 1 monthly population, over our study period. Table 1 describes the baseline characteristics at 3 time points (beginning of the study [March 15, 2017]; start of our COVID-19 pandemic period [March 15, 2020]; and the last monthly interval of our study [November 15, 2021]). The median age of participants was 79 years, and the median eGFR was similar across time periods (range = 23.7-24.3 mL/min/1.73 m2). For patients with information on prescription medication, use remained relatively constant across the 3 intervals except for a substantial increase in the use of sodium-glucose cotransporter-2 (SGLT2) inhibitors (0.3% pre-pandemic vs 10% during the pandemic).
Baseline Characteristics for Patients With Advanced CKD at 3 Time Points. a
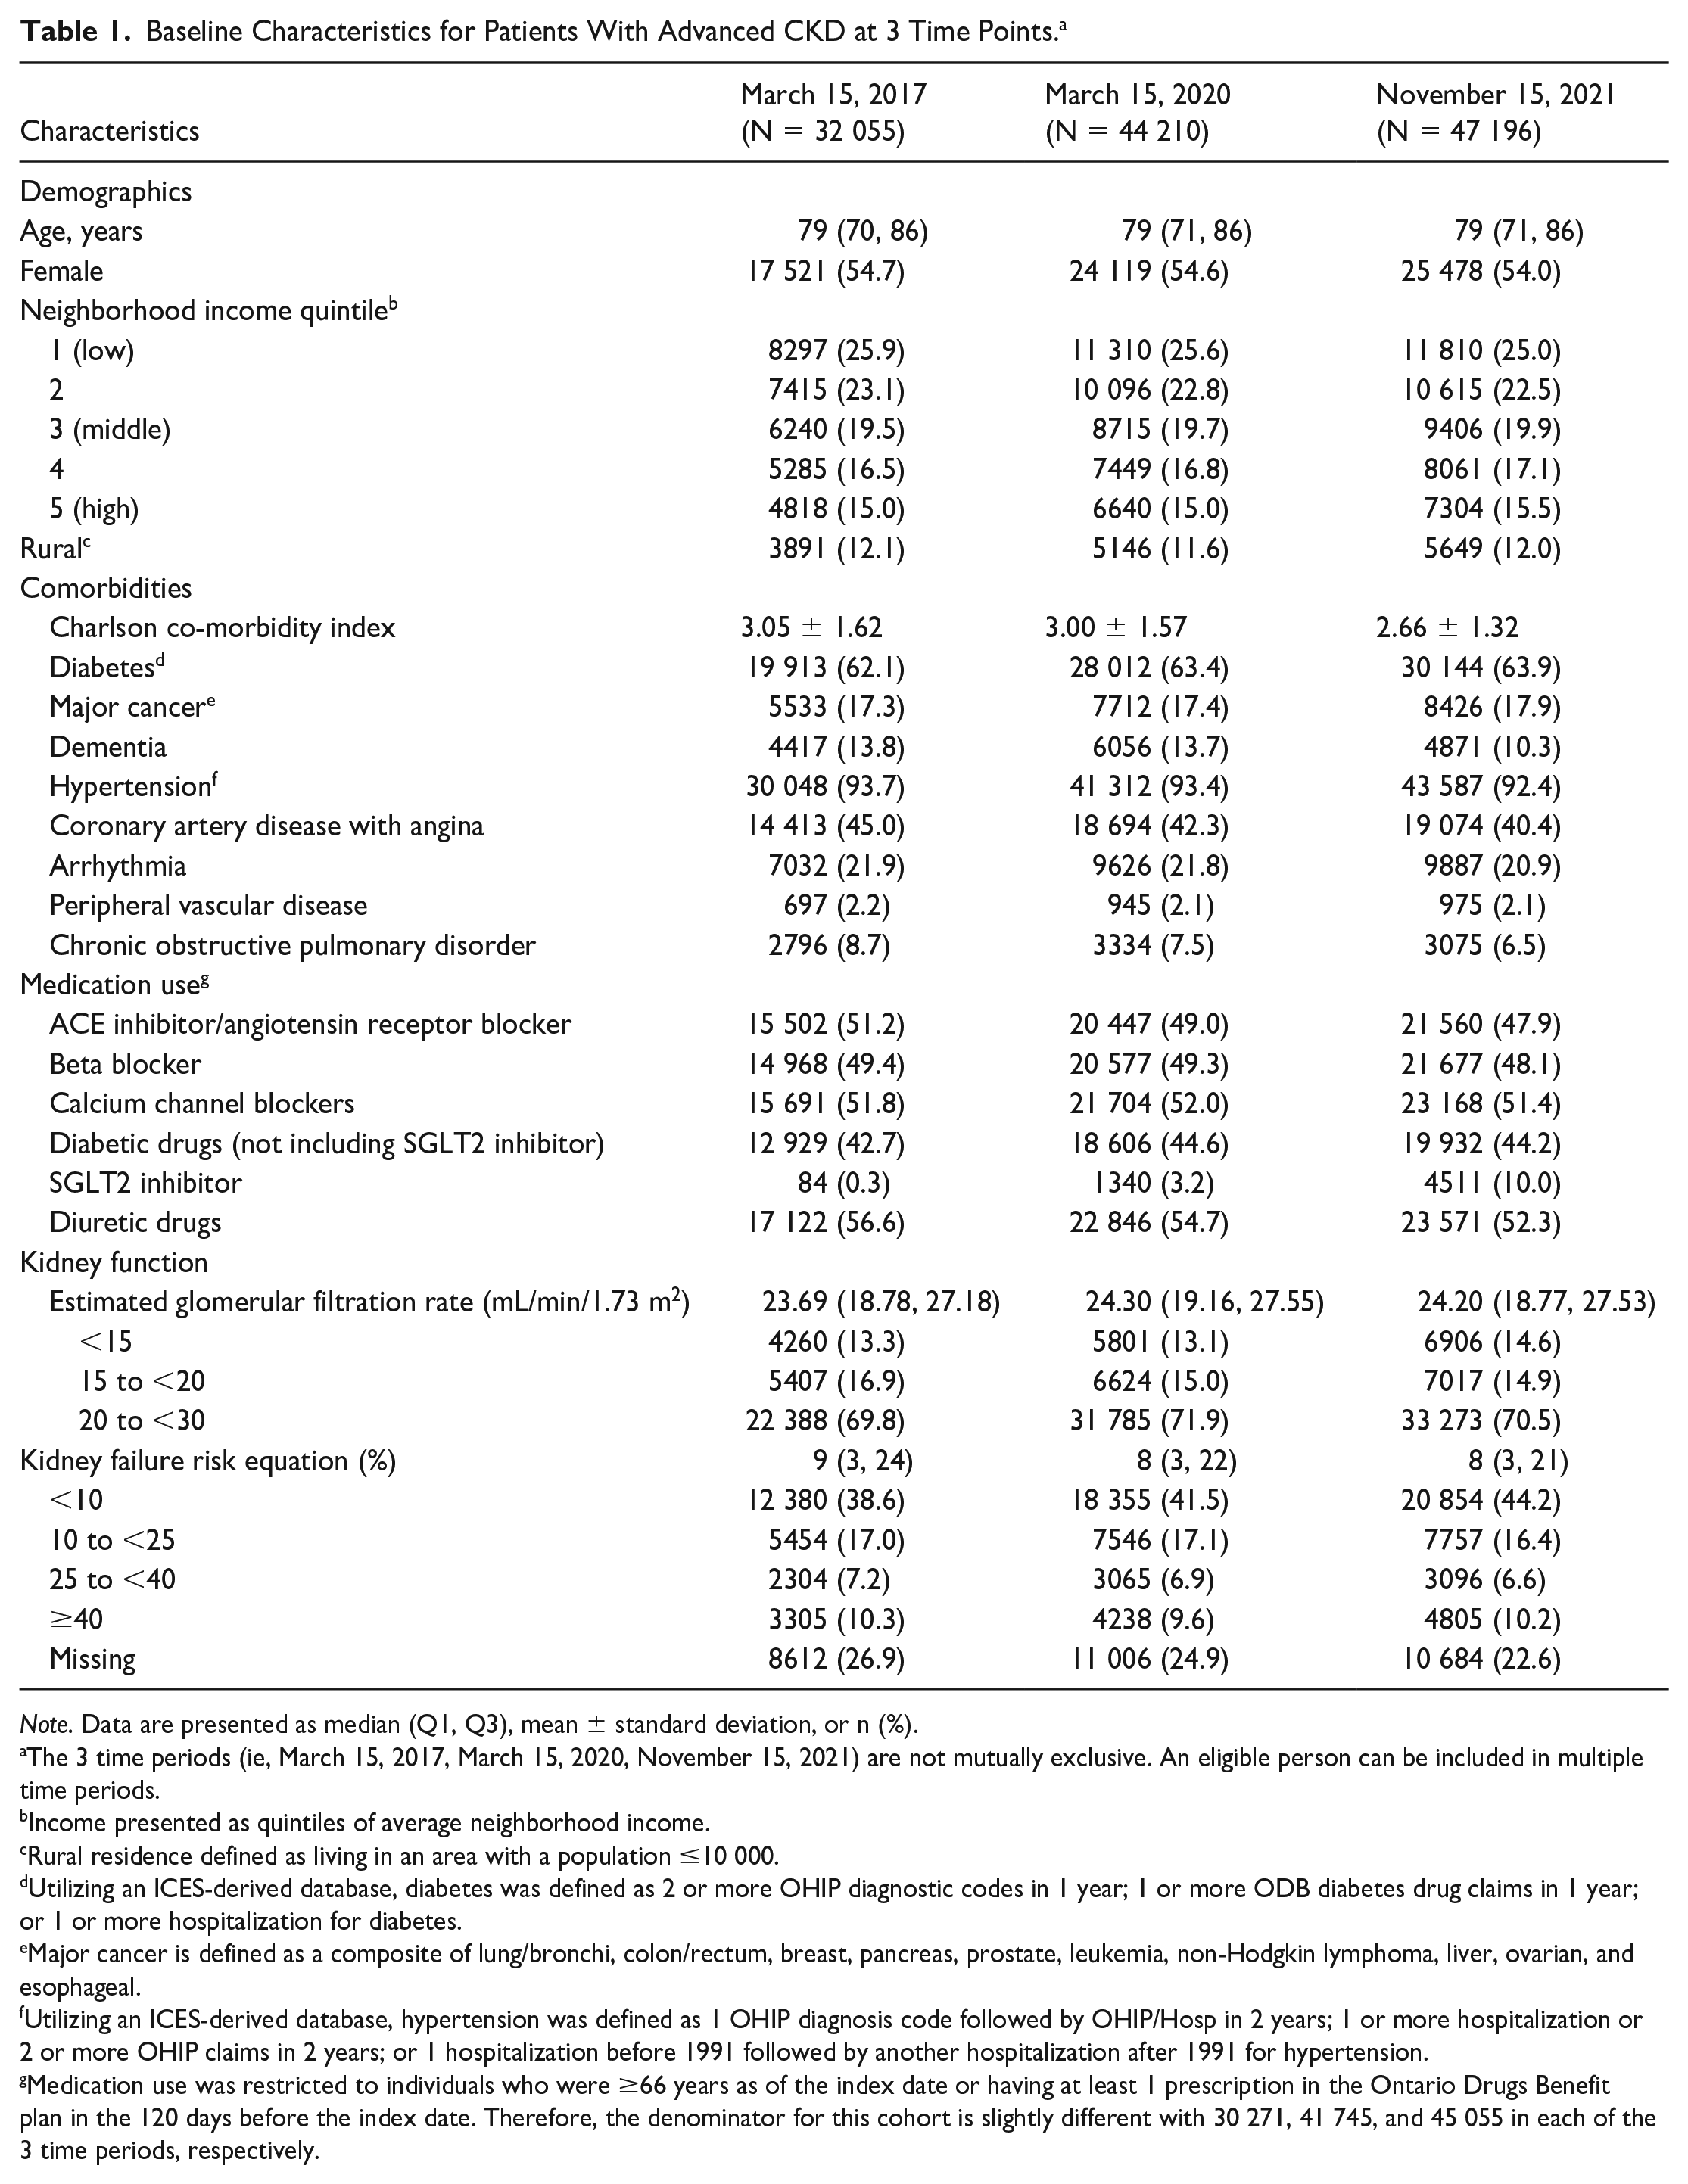
Note. Data are presented as median (Q1, Q3), mean ± standard deviation, or n (%).
The 3 time periods (ie, March 15, 2017, March 15, 2020, November 15, 2021) are not mutually exclusive. An eligible person can be included in multiple time periods.
Income presented as quintiles of average neighborhood income.
Rural residence defined as living in an area with a population ≤10 000.
Utilizing an ICES-derived database, diabetes was defined as 2 or more OHIP diagnostic codes in 1 year; 1 or more ODB diabetes drug claims in 1 year; or 1 or more hospitalization for diabetes.
Major cancer is defined as a composite of lung/bronchi, colon/rectum, breast, pancreas, prostate, leukemia, non-Hodgkin lymphoma, liver, ovarian, and esophageal.
Utilizing an ICES-derived database, hypertension was defined as 1 OHIP diagnosis code followed by OHIP/Hosp in 2 years; 1 or more hospitalization or 2 or more OHIP claims in 2 years; or 1 hospitalization before 1991 followed by another hospitalization after 1991 for hypertension.
Medication use was restricted to individuals who were ≥66 years as of the index date or having at least 1 prescription in the Ontario Drugs Benefit plan in the 120 days before the index date. Therefore, the denominator for this cohort is slightly different with 30 271, 41 745, and 45 055 in each of the 3 time periods, respectively.
Outcomes
Table 2 describes the number of events, proportion, and incidence rate (per 1000 person-years) for all outcomes comparing the pre-COVID pandemic period (March 15, 2017 to March 14, 2020) to the COVID pandemic period (March 15, 2020 to November 14, 2021).
Primary, Secondary, and Additional Outcomes in the Pre-COVID and COVID Pandemic Periods.

Non–COVID-19-related events are not applicable during the pre-COVID-19 pandemic period as all events would have been non–COVID-19 related. For example, when examining all-cause mortality during the pre-pandemic period, the non–COVID-19-related mortality estimates would be the same as the all-cause mortality estimates since there would be no COVID-19-related deaths before the pandemic.
For all outcomes associated with a hospitalization or an emergency department visit, we excluded from the denominator patients who were already hospitalized before the start of the monthly interval and remained hospitalized throughout the entire monthly interval.
For intensive care unit admissions, we excluded from the denominator patients who were already in the intensive care unit before the start of the monthly interval and remained in the intensive care unit throughout the entire monthly interval.
For hospitalization with mechanical ventilation, we excluded from the denominator patients who were already in hospital before the start of the interval with evidence of mechanical ventilation and remained in hospital throughout the entire monthly.
For home dialysis start, we excluded from the denominator patients who were already hospitalized, in long-term care, rehab, or continuing care before the start of the interval and remained in this state throughout the entire monthly interval.
For long-term care admission, we excluded individuals from the denominator who were already in long-term care before the start of the monthly interval.
Primary outcome
The rate of all-cause mortality increased early in the pandemic, peaking in April 2020 and December 2020 (Figure 1). The adjusted rate ratio (aRR) for all-cause mortality during the first 21 months of the pandemic was significantly higher than expected (aRR = 1.08, 95% CI = 1.03, 1.12) (Table 3). After excluding COVID-19-related deaths, there was no difference in the observed versus expected mortality rates (aRR = 1.02, 95% CI = 0.97, 1.07) (Figure 2 and Table 3).

Observed vs expected monthly all-cause mortality rates for adults with advanced CKD prior (March 15, 2017 to February 15, 2020) and during the COVID-19 pandemic (March 15, 2020 to November 15, 2021). Vertical solid line indicates the onset of the COVID-19 pandemic. Table displays observed vs expected rates. Bold font indicates statistical significance at α = 0.05 level.
Overall Adjusted Rate Ratios of Observed and Expected Rates of Primary and Secondary Outcomes Using Poisson Generalized Estimated Equations. a

Note. N/A, not applicable.
Poisson generalized estimating equations modeled the pre-COVID period trends (defined as March 15, 2017 to March 14, 2020) for the outcomes, which were used to predict the expected trends during the first 21 months of the COVID-19 period (defined as March 15, 2020 to December 14, 2021).
The multivariable Poisson model included the following covariates: age group-sex indicators, a linear term measured as months since March 15, 2017, and pre-COVID month indicators.
Adjusted relative rates excluding COVID-19-related hospital admission with mechanical ventilation and emergency room visits were not calculated as we could not accurately discern in our data sources which were COVID-19 and non–COVID-19 related.

Observed vs expected monthly non–COVID-related mortality rates for adults with advanced CKD prior to (March 15, 2017 to February 15, 2020) and during the COVID-19 pandemic (March 15, 2020 to November 15, 2021). Vertical solid line indicates the onset of the COVID-19 pandemic. Table displays observed vs expected rates. Bold font indicates 95% confidence intervals that do not include the null value (ie, adjusted relative rate = 1.00); confidence intervals have not been adjusted for multiplicity.
Secondary outcomes
There was a substantial decrease in acute health care utilization during the pandemic, including all-cause hospitalization (excluding elective surgeries), non–COVID-19-related hospitalization (excluding elective surgeries), ICU admissions, non–COVID-19-related ICU admissions, hospital admissions with mechanical ventilation and emergency room visits (Table 2 and Figures 3-8). Specifically, emergency room visits dropped from 1247 per 1000 person-years pre-pandemic to 1043 per 1000 person-years. This drop was most prominent during the first 3 months of the pandemic; however, this trend persisted throughout most of the 21-month pandemic period, with the rate of acute health care utilization substantially lower than expected. For example, the aRR for all-cause hospitalizations and ICU admissions during the first 21 months of the pandemic, compared to what was expected, was 0.92 (95% CI = 0.89, 0.94) and 0.92 (95% CI = 0.88, 0.97), respectively. The decline in all-cause hospitalization and ICU admissions persisted after exclusion of COVID-19-related health care utilization (Table 3).

Observed vs expected monthly all-cause hospitalization (excluding elective surgeries) rates for adults with advanced CKD prior to (March 15, 2017 to February 15, 2020) and during the COVID-19 pandemic (March 15, 2020 to November 15, 2021). Vertical solid line indicates the onset of the COVID-19 pandemic. Table displays observed vs expected rates. Bold font indicates 95% confidence intervals that do not include the null value (ie, adjusted relative rate = 1.00); confidence intervals have not been adjusted for multiplicity.

Observed vs expected monthly non–COVID-related hospitalization (excluding elective surgeries) rates for adults with advanced CKD prior to (March 15, 2017 to February 15, 2020) and during the COVID-19 pandemic (March 15, 2020 to November 15, 2021). Vertical solid line indicates the onset of the COVID-19 pandemic. Table displays observed vs expected rates. Bold font indicates the 95% confidence intervals that do not include the null value (ie, adjusted relative rate = 1.00); confidence intervals have not been adjusted for multiplicity.

Observed vs expected monthly intensive care unit admission rates for adults with advanced CKD prior to (March 15, 2017 to February 15, 2020) and during the COVID-19 pandemic (March 15, 2020 to November 15, 2021). Vertical solid line indicates the onset of the COVID-19 pandemic. Table displays observed vs expected rates. Bold font indicates 95% confidence intervals that do not include the null value (ie, adjusted relative rate = 1.00); confidence intervals have not been adjusted for multiplicity.

Observed vs expected monthly non–COVID-related intensive care unit admission rates for adults with advanced CKD prior to (March 15, 2017 to February 15, 2020) and during the COVID-19 pandemic (March 15, 2020 to November 15, 2021). Vertical solid line indicates the onset of the COVID-19 pandemic. Table displays observed vs expected rates. Bold font indicates 95% confidence intervals that do not include the null value (ie, adjusted relative rate = 1.00); confidence intervals have not been adjusted for multiplicity.

Observed vs expected monthly hospital admission with mechanical ventilation rates for adults with advanced CKD prior to (March 15, 2017 to February 15, 2020) and during the COVID-19 pandemic (March 15, 2020 to November 15, 2021). Vertical solid line indicates the onset of the COVID-19 pandemic. Table displays observed vs expected rates. Bold font indicates 95% confidence intervals that do not include the null value (ie, adjusted relative rate = 1.00); confidence intervals have not been adjusted for multiplicity.

Observed vs expected monthly emergency room visit rates for adults with advanced CKD prior to (March 15, 2017 to February 15, 2020) and during the COVID-19 pandemic (March 15, 2020 to November 15, 2021). Vertical solid line indicates the onset of the COVID-19 pandemic. Table displays observed vs expected rates. Bold font indicates 95% confidence intervals that do not include the null value (ie, adjusted relative rate = 1.00); confidence intervals have not been adjusted for multiplicity.
Other outcomes
We observed a substantial decline in health care utilization and pre-specified health care outcomes in the first 3 months of the COVID-19 pandemic (Table 2 and Supplemental Figures S1-S6). For example, cardiovascular-related hospitalizations fell during the first 2 months of the pandemic, with a subsequent rise by May 2020, although rates generally remained lower compared to the pre-pandemic period (Supplemental Figure S1). The initiation of maintenance dialysis declined during the first 2 months of the pandemic with the overall incidence rate remaining lower compared to the pre-pandemic period (38.5 [95% CI = 37.0, 40.0] per 1000 person-years during the pandemic vs 42.4 [95% CI = 41.2, 43.7] per 1000 person-years before the pandemic) (Table 2). The incidence rate of home dialysis initiation remained relatively static during the pandemic (Supplemental Figure S2 and Table 2).
The most notable decline in health care utilization was in long-term care admissions, with an incidence rate of 30.3 (95% CI = 29.3, 31.4) per 1000 person-years in the pre-pandemic period compared to 17.4 (95% CI = 16.4, 18.5) in the pandemic period (Table 2 and Supplemental Figure S3). Family physician and non-nephrology specialist visits (accounting for in-person and virtual visits) also declined during the first 3 months of the pandemic, with a trend returning toward pre-pandemic levels by month 5 of the pandemic (July 2020) (Supplemental Figure S4). This decline was not observed in nephrology visits (accounting for in-person and virtual visits), with visits remaining relatively stable even during the first 3 months of the pandemic. Supplemental Figure S5 shows that monthly rates of acute kidney injury requiring dialysis remained relatively constant during the pandemic compared with rates before the COVID-19 pandemic. Supplemental Figure S6 displays the mean eGFR at dialysis initiation, with a mean eGFR (mL/min/1.73 m2) of 7.9 ± 3.0 before the pandemic and 8.0 ± 3.0 during the pandemic.
Discussion
This study found that all-cause mortality in the first 21 months of the COVID-19 pandemic was significantly higher than expected in adults with advanced CKD from Ontario, Canada. However, the mortality rate was attenuated after removing COVID-19-related deaths, suggesting that the excess mortality was attributed to COVID-19. There was a substantial decline in acute health care utilization, including hospitalizations (excluding elective surgeries), ICU admissions, and emergency room visits. Despite substantial reductions in acute health care utilization during the first 21 months of the pandemic, there was not a corresponding substantial increase in non–COVID-19-related mortality.
Prior research found that patients with CKD have a higher risk of adverse health outcomes (eg, death) from SARS-CoV-2 infection.25 -29 For example, 1 study found there were 34 265 excess COVID-19-related deaths in patients with CKD (prevalent CKD n = 1 934 585 of whom 12.7% had advanced CKD). 28 Our study demonstrated 8% excess mortality in the advanced CKD population, which was attributable to COVID-19, with no overall substantial difference in the observed versus expected mortality rates after removing COVID-19-related deaths. Notably, the observed excess all-cause mortality in the advanced CKD population is comparable to that of the general Canadian population, with a similar proportion (7.9%) of excess mortality reported between March 2020 and October 2022. 13
Despite the decline in acute health care services utilization in the advanced CKD population, we did not see a corresponding spike in non–COVID-19 mortality. This could be due to several reasons. First, most patients with advanced CKD are regularly monitored by a nephrologist (in person or virtually), as evident in the relatively stable incidence of nephrology visits in the pre-Omicron pandemic period. Second, due to pandemic-imposed public health restrictions (eg, wearing a mask, social gathering restrictions), many patients with advanced CKD may not have experienced non–COVID-19-related infections. People with CKD are at increased risk of severe outcomes from infection (eg, pneumonia), so it is plausible that deaths from non-COVID respiratory infection declined during this period. 30
The substantial attenuation in health care utilization was especially prominent in the first 3 months of the COVID-19 pandemic (March to May 2020). By the end of our study period (December 2021), health care utilization rates appeared to have returned to pre-pandemic levels. Our results are consistent with a notable reduction in hospital occupancy, emergency department visits, and physician visits in the general Canadian population, especially in the first wave of the pandemic.14,31 Other studies have also found changes in health care utilization during the pandemic. For example, in a study of 248 898 patients with CKD (defined as an eGFR 30 to 59 mL/min/1.73 m2) from the United States (maximum follow-up August 2021), in-person physician visits decreased by 24.2% from March 2020 to August 2021 compared to the pre-pandemic period (partially mitigated by a 14.2% increase in telehealth). 32
The apparent resilience of the CKD population examined in this study is important for future health care policy, health care service delivery planning, and resource management. The continuation of nephrology visits amidst reductions in other physician visits during the early phases of the pandemic is suggestive of the potential importance of prioritization of kidney care delivery despite system wide challenges. The effect of compensatory mechanisms such as conversion to virtual care and ancillary support by multidisciplinary teams (such as nurses, pharmacists) for patients who were eligible to receive care at specialized kidney care clinics was not examined. Further examination of potential adaptive responses is needed to better understand how kidney care delivery adjusted during the pandemic. Such insights can help inform future guidelines on pandemic preparedness, such as the Ontario Health Pandemic Clinical Guideline for Patients with Chronic Kidney Disease. 33
Our study has several strengths. To our knowledge, it is the first Canadian study to describe clinically important outcomes during pre-pandemic and COVID pandemic time periods among patients with advanced CKD. Furthermore, our utilization of administrative health care databases allowed us to capture a large cohort of adults with advanced CKD.
Limitations of this work should be considered. First, due to data availability at the time of analysis, we did not examine the impact of the COVID-19 pandemic on patients with advanced CKD beyond December 2021. Longer observation time may be needed to observe the effect of decreased health care utilization on clinical outcomes, with studies in the general population finding long-term adverse effects of SARS-CoV-2 infection (eg, cardiovascular events and long COVID). 34 Second, we did not examine the rate of utilization or access to allied health providers such as pharmacists, nurse practitioners, and dietitians. Third, although Ontario is Canada’s largest province (home to over one-third of the Canadian population), the results of our study may not be generalizable to patients with advanced CKD residing in other Canadian provinces and beyond Canada. Fourth, due to lack of data availability, we were unable to examine the effects of the pandemic across different subgroups (eg, defined by race or income). A more pronounced effect on mortality and other outcomes may have been observed in specific at-risk populations.35,36 Fifth, selection bias is a consideration, as we did not capture those individuals who did not undergo bloodwork, missing the capture of their advanced CKD and thus inclusion in our study. Finally, there is potential for misclassification of non–COVID-19-related deaths and hospitalization, as it is difficult to differentiate deaths/hospitalizations with COVID-19 vs from COVID-19.
This study quantified the impact of the COVID-19 pandemic on numerous health care outcomes in adults with advanced CKD. Despite reduced health care utilization, non–COVID-19-related deaths did not increase during the first 21 months of the pandemic. Continued surveillance by nephrologists may have helped mitigate some of the adverse pandemic effects. The study results advance our understanding of the effect the pandemic has on patients with advanced CKD and helps inform health service planning in future health care emergencies.
Supplemental Material
sj-docx-1-cjk-10.1177_20543581251350030 – Supplemental material for Clinical Outcomes and Health Care Utilization in Patients with Advanced Chronic Kidney Disease not on Dialysis After the Onset of the COVID-19 Pandemic in Ontario, Canada
Supplemental material, sj-docx-1-cjk-10.1177_20543581251350030 for Clinical Outcomes and Health Care Utilization in Patients with Advanced Chronic Kidney Disease not on Dialysis After the Onset of the COVID-19 Pandemic in Ontario, Canada by Carol Wang, Yuguang Kang, Stephanie N. Dixon, Nivethika Jeyakumar, K. Scott Brimble, Amit X. Garg, Peter G. Blake, Therese A. Stukel, Matthew J. Oliver, Ahmed Al-Jaishi, Kristin K. Clemens, Longdi Fu, Jane Ip, Susan McKenzie, Louise Moist, Amber O. Molnar, Flory Muanda-Tsobo, Marian Reich, Pavel Roshanov, Samuel A. Silver, Ronald Wald, Matthew A. Weir, Kevin Yau, Ann Young and Kyla L. Naylor in Canadian Journal of Kidney Health and Disease
Footnotes
Acknowledgements
Dr. Naylor is supported by a Health System Impact Embedded Early Career Researcher Award Canadian Institutes of Health Research. Dr. Garg was supported by the Kay Family Chair in Transformational Kidney Care. This study was supported by ICES, which is funded by an annual grant from the Ontario Ministry of Health (MOH) and the Ministry of Long-Term Care (MLTC). This document used data adapted from the Statistics Canada Postal CodeOM Conversion File, which is based on data licensed from Canada Post Corporation, and/or data adapted from the Ontario Ministry of Health Postal Code Conversion File, which contains data copied under license from ©Canada Post Corporation and Statistics Canada. Parts of this material are based on data and/or information compiled and provided by: MOH, CIHI. The analyses, conclusions, opinions and statements expressed herein are solely those of the authors and do not reflect those of the funding or data sources; no endorsement is intended or should be inferred. Parts of this material are based on data and information provided by Ontario Health (OH). The opinions, results, view, and conclusions reported in this paper are those of the authors and do not necessarily reflect those of OH. No endorsement by OH is intended or should be inferred. We thank IQVIA Solutions Canada Inc. for use of their Drug Information File. Parts of this material are based on data and information compiled and provided by the Ontario Ministry of Health. The analyses, conclusions, opinions and statements expressed herein are solely those of the authors and do not reflect those of the funding or data sources; no endorsement is intended or should be inferred. This study was supported by the Ontario Health Data Platform (OHDP), a Province of Ontario initiative to support Ontario’s ongoing response to COVID-19 and its related impacts. The opinions, results and conclusions reported in this paper are those of the authors and are independent from the funding sources. No endorsement by the OHDP, its partners, or the Province of Ontario is intended or should be inferred.
Declaration of Conflicting Interests
The author(s) declared no potential conflicts of interest with respect to the research, authorship, and/or publication of this article.
Funding
The author(s) disclosed receipt of the following financial support for the research, authorship, and/or publication of this article: Supported by a project grant from the Canadian Institutes of Health Research (Funding Reference Number 178016).
ORCID iDs
Availability of Data and Materials
The dataset from this study is held securely in coded form at ICES. While legal data sharing agreements between ICES and data providers (e.g., healthcare organizations and government) prohibit ICES from making the dataset publicly available, access may be granted to those who meet pre-specified criteria for confidential access, available at www.ices.on.ca/DAS (email: das@ices.on.ca). The full dataset creation plan and underlying analytic code are available from the authors upon request, understanding that the computer programs may rely upon coding templates or macros that are unique to ICES and are therefore either inaccessible or may require modification.
Supplemental Material
Supplemental material for this article is available online.
References
Supplementary Material
Please find the following supplemental material available below.
For Open Access articles published under a Creative Commons License, all supplemental material carries the same license as the article it is associated with.
For non-Open Access articles published, all supplemental material carries a non-exclusive license, and permission requests for re-use of supplemental material or any part of supplemental material shall be sent directly to the copyright owner as specified in the copyright notice associated with the article.