
Abstract
Objectives:
Chronic kidney disease (CKD) is associated with disability, low quality of life, and mortality. However, most cases are asymptomatic, often detected incidentally, or only recognized when they have progressed to the later stages with complications. The present study aimed to determine the prevalence of CKD and develop a predictive nomogram for CKD in Vietnamese adults.
Methods:
This cross-sectional, population-based study involved 533 men and 957 women aged 18 years and older who were screened for CKD. The CKD was diagnosed using the albumin-to-creatinine ratio and/or estimated glomerular filtration rate by the CKD-EPI 2009 equation based on serum creatinine, age, gender, and race (these tests included a baseline measurement and a repeat measurement after 3 months) according to the KDIGO 2012 guideline. We used the Bayesian Model Averaging method to identify the optimal model for predicting CKD. A predictive nomogram was also developed to enable risk prediction.
Results:
The overall CKD prevalence was 13.1% (95% confidence interval [CI] = 11.6-14.6), with a prevalence of 11.8% (95% CI = 9.1-14.5) in men and 13.8% (95% CI = 11.6-16) in women. The optimal model for predicting CKD included age (odds ratio [OR] per 5-year increase = 1.19; 95% CI = 1.11-1.28), hypertension (OR = 2.08; 95% CI = 1.50-2.89), and diabetes (OR = 1.69; 95% CI = 1.18-2.43). The area under the receiver operating characteristic curve was 0.7, with a 95% CI ranging from 0.65 to 0.73.
Conclusions:
The CKD is relatively common among Vietnamese adults. A simple model—including age, hypertension, and diabetes—is helpful for the selective screening of CKD in Vietnamese individuals.
Introduction
The prevalence of chronic kidney disease (CKD) is increasing, 1 and CKD is becoming a global health concern. 2 The CKD increases the burden on patients because of treatment costs, 3 the risk of disability, 4 and reduced quality of life. 5 Notably, individuals with CKD have a 39% higher risk of mortality, 2 which correlates directly with the decline in kidney filtration rates. 6 Specifically, after age adjustment, the mortality risk in individuals with CKD is 3.2 times higher if the estimated glomerular filtration rate (eGFR) is 15 to 29 mL/min/1.73 m2 and increases to 5.9 times if eGFR is less than 15 mL/min/1.73 m2. 7 Remarkably, CKD has been proven to be the only non-communicable chronic disease where the age-adjusted mortality rate continuously increases 8 and is predicted to become the fifth leading cause of death globally by 2040. 8
The prevalence of CKD has been evaluated in several large studies using data from the Global Burden of Disease study.2,9,10 Regional differences in CKD prevalence have been found in studies assessing CKD prevalence in specific populations, potentially due to geographical and sociodemographic reasons, or differences in diagnostic methods. Indeed, in some Western countries, the prevalence of CKD ranges from 14.7% to 43.3%.11 -13 In Asia, the rate varies from 7% to 34.3%,14 -18 and in low- and middle-income countries including Vietnam, where an increase in the burden of CKD has been reported. However, the data on community prevalence remains scarce. 19
As CKD G1-3 is mostly asymptomatic, it is often detected incidentally or only recognized once it has progressed to the later stages with complications. 2 Consequently, a large number of people in the community suffer from undiagnosed CKD. 1 Indeed, the research in the United Kingdom has noted that nearly half of the individuals with CKD would remain undiagnosed if not been screened. 20 However, the screening should be selectively conducted on high-risk individuals to avoid wasting resources and unnecessary costs. In recent years, to assess the risk of CKD, many studies have applied nomograms to predict and prognosticate.13,21 -23 The method of constructing a nomogram has advantages such as individualized risk assessment for each patient, ease of application, and development of a predictive model using variables collected from a simple questionnaire. There are currently few predictive models for CKD risk based on nomograms worldwide. In Vietnam, patients typically develop kidney failure at a relatively young age; 24 therefore, early detection and treatment of CKD are crucial. In this population-level study, we sought to determine the prevalence of CKD in Vietnamese adults and develop a practical tool for CKD screening, which has practical significance in screening high-risk individuals for further workup with more specialized tests, and hopefully, it also contributes to the global medical literature on CKD data in the community—especially in developing countries where research data is still scarce.
Methods
Study Settings and Participants
This study was a cross-sectional, population-based study conducted in 2023 in Can Tho City, Vietnam. Can Tho City, with a population of 1.26 million, is the central economic hub of the Western part of the country. We used a probabilistic sampling method. Firstly, districts were selected using stratified random sampling. Then, communes, wards, and townships were also chosen using stratified random sampling. Next, smaller levels, such as villages and hamlets, and finally, the household level, were selected through systematic random sampling. We coordinated with local authorities to compile a list of households, then selected households as follows: the first household was chosen using a random number table, and subsequent households were selected through a method of adjacent houses. Within each household, we invited all individuals aged 18 and older to participate in interviews and data collection, adhering to the selection criteria until the sample size was met for each village, hamlet, and area.
All individuals aged 18 years and older who agreed to voluntarily participate in the study underwent free-of-charge biochemistry tests and measurements at the Can Tho University of Medicine and Pharmacy Hospital and did not receive any other benefits. Those with life-threatening acute conditions (such as acute respiratory failure, acute myocardial infarction, acute cerebral stroke, etc), those unable to communicate or respond to questions, those with psychiatric disorders, or those who could not sign the consent form were excluded from the study.
The formula for calculating the sample size n = Z2(1-α/2) x
The study’s procedure and protocol were approved by the research and ethics committee of Can Tho University of Medicine and Pharmacy, Vietnam (approval number: 535/PCT-HĐĐĐ) and was conducted according to the ethical principles of the Declaration of Helsinki, and all participants gave written informed consent.
Data Collection
A standardized questionnaire was used to collect the demographic and clinical data. The anthropometric parameters included age, weight, and standing height. Sociodemographic variables included occupation, level of educational attainment, and household income. Clinical variables included history of cardiovascular disease, kidney disease, autoimmune disease, kidney stone or recurrent urinary tract infection, history of chronic viral infection, cancer, and using non–steroidal anti-inflammatory drug (NSAID) or proton pump inhibitor (PPI). Body weight was measured using an electronic balance. Height was determined without shoes using a portable stadiometer with a mandible plane parallel to the floor. The body mass index (BMI) was derived as the weight in kilograms divided by the square meters of the height. The overweight-obesity group was defined as having a BMI of 23 or higher, according to the National Institutes of Health and World Health Organization Norms for Asian populations. 26 Hypertension was diagnosed according to the 2023 European Society of Cardiology guidelines. 27 The measurement procedure was standardized according to the 2020 International Society of Hypertension guidelines. 28 Blood pressure was measured using a Yamasu device and a Littmann stethoscope. The recorded blood pressure value is the average of the last 2 measurements. Patients in the study had their blood pressure measured at least twice during separate visits. Fasting blood glucose and HbA1c were tested using the Abbott Architect c4000 automated biochemistry analyzer, and diabetes was diagnosed based on the 2023 American Diabetes Association standards. 29
The urine albumin-to-creatinine ratio (ACR) (mg/mmol) was measured using a morning urine sample collected immediately upon awakening. Serum creatinine was measured using the Jaffé kinetic method (the only method available in Vietnam), where creatinine reacts with an alkaline picrate reagent to form a yellow-orange complex. The rate of complex formation is proportional to the creatinine level when compared with a standard. This was performed on the Abbott Architect c4000 automated biochemistry analyzer using the Biolabo reagents from Abbott. Participants had been instructed not to take drugs that can affect the serum creatinine measurement, such as cimetidine, trimethoprim, glucose, and aspirin, before and on the day of the blood test. The glomerular filtration rate was then estimated based on serum creatinine using the CKD-EPI 2021 formula.
Diagnostic Criteria
The ACR and serum creatinine tests were repeated after 3 months; if the ACR was ≥3 mg/mmol and/or the eGFR was ≤60 mL/min/1.73 m2 in 2 tests 3 months apart using the same type of testing, CKD was confirmed according to the 2012 KDIGO guideline. 30
Data and Statistical Analyses
Sampling weights were applied to ensure the representativeness of prevalence estimates. For each participant, the weight was calculated as the inverse of the probability of being selected across all stages of the sampling method.
The Wilson’s score technique 31 was used to estimate the 95% confidence interval (CI) for the population prevalence. The prevalence of CKD was also determined by gender and age groups (18-39, 40-59, and 60+ years old).
The Bayesian Model Averaging (BMA) method was used to search for the optimal model for predicting CKD, as it has been consistently found to be more robust than the stepwise model-building method in the selection of an optimal prediction model.32,33 In the presence of m variables, the regression analysis was carried out for 2m competing models in the BMA. The regression coefficients were averaged over all possible models. A uniform prior probability was given to each model, and together with the likelihood of each model, the posterior probability of the best model was determined by using the Bayesian theorem. The advantages of this method are that it eliminates insignificant variables and reflects the uncertainty of model 34 selection. The included variables in the BMA analysis were age, gender, body mass index, hypertension, diabetes, history of heart disease, kidney disease, and history of NSAID use.
The receiver operating characteristic (ROC) curve analysis and its corresponding area under the curve (AUC) were used to assess the discriminative performance of the prognostic models. 35 The 95% CI of the AUC was estimated using the bootstrap method with 100 iterations of 10-fold cross-validation samples. The calibration of prognostic models was assessed using the Brier score. We also developed a predictive nomogram to facilitate the implementation of the prediction model in clinical practice using the “rms” software package. 36 The analyses were conducted using the R Statistical Environment. 37
Results
A total of 1490 participants (553 men and 957 women) were recruited and followed until the end of the study. The 2 gender groups presented no significant disparity in the average age of 58.68 ± 14.40 for men vs 59.60 ± 13.08 for women (P = .207), and Vietnamese ethnicity constituted the majority. Regarding other characteristics, men generally exhibited higher level of educational attainment and financial earnings, whereas women were predominantly engaged in household or small business (all P < .05). The detailed information is presented in Table 1.
Baseline Characteristics of 1490 Participants Stratified by Gender.
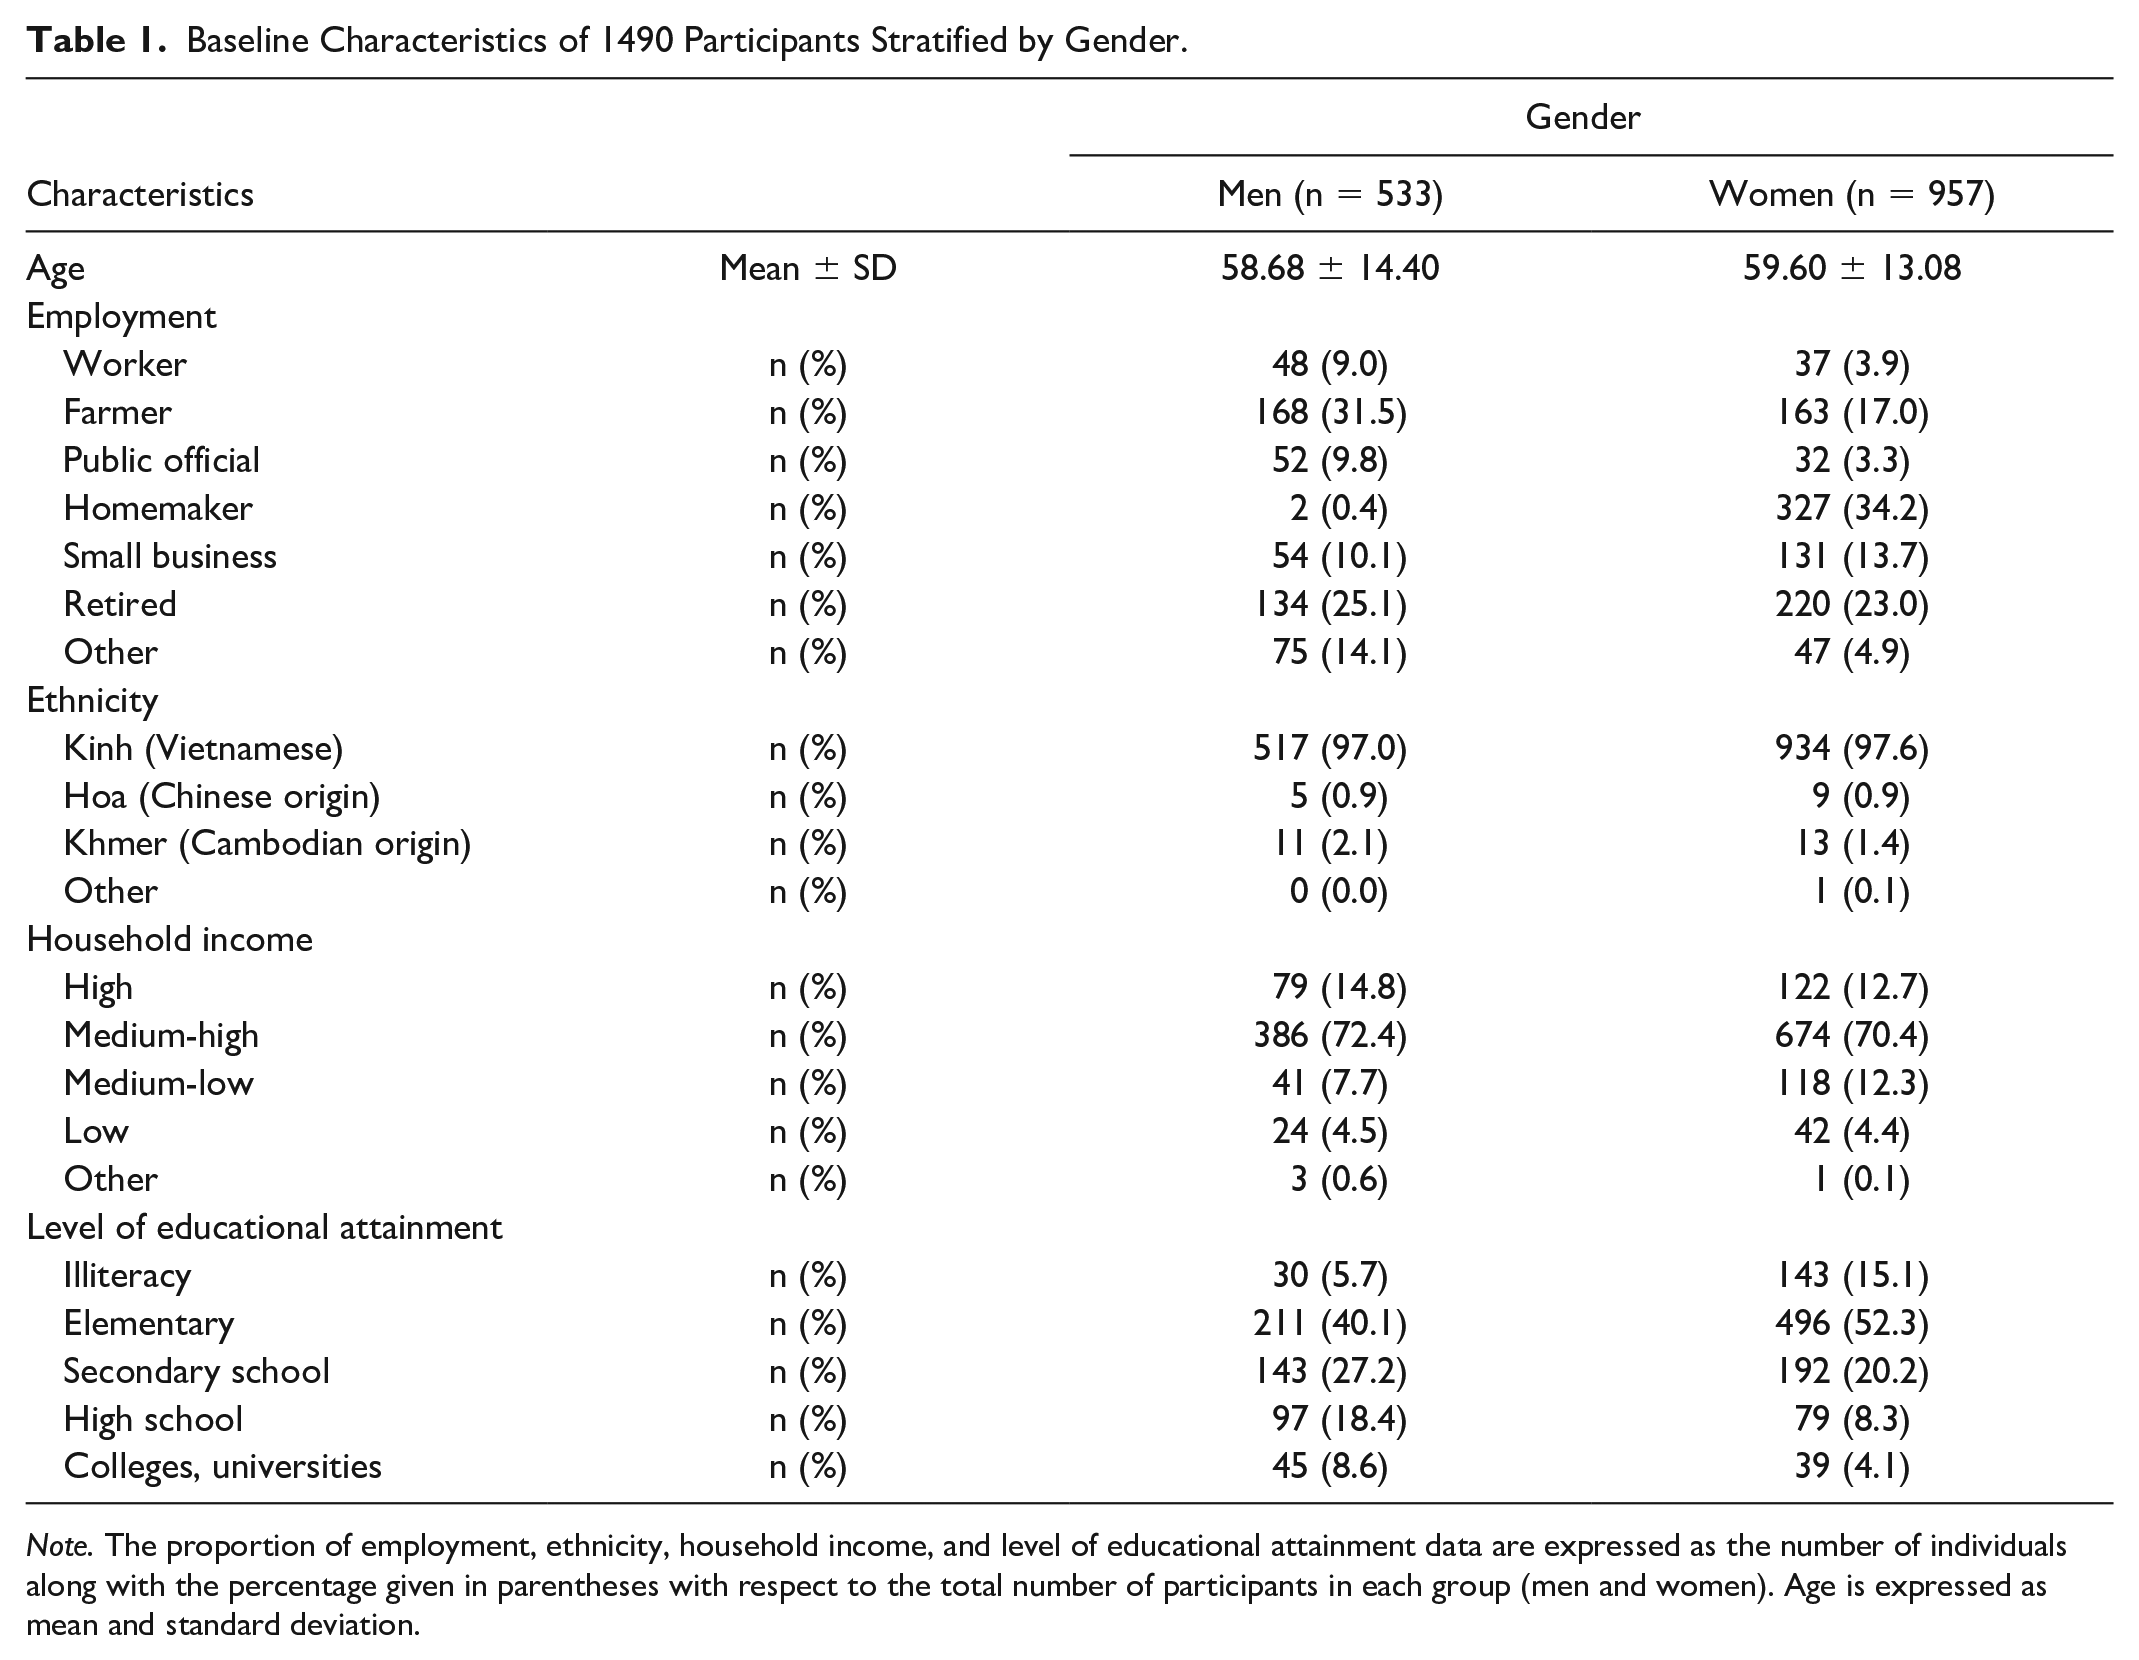
Note. The proportion of employment, ethnicity, household income, and level of educational attainment data are expressed as the number of individuals along with the percentage given in parentheses with respect to the total number of participants in each group (men and women). Age is expressed as mean and standard deviation.
Table 2 shows data on the medical history and medication of participants. Notably, the study results revealed that the prevalence of diabetes was higher in women than in men (12.4% vs 18.9%, P = .001). Similarly, we observed a higher trend among women participants using NSAID (13.7% vs 19.3%, P = .006) and PPI (9.4% vs 15.7%, P < .001). In addition, no other significant differences were recorded.
Risk Factors of 1490 Participants Stratified by Gender.

Note. The proportion of medical history and medication variables are expressed as the number of individuals along with its percentage given in parentheses with respect to the total number of participants in each group (men and women).
History of chronic viral infection, including HBV, HCV, and HIV. NSAID = non–steroidal anti-inflammatory drug; PPI = proton pump inhibitor.
Of the 1490 participants, the overall prevalence of CKD was 13.1% (95% CI = 11.6-14.6), with women having a numerically higher prevalence than men (13.8%; 95% CI = 11.6-16 vs 11.8%; 95% CI = 9.1-14.5), although the difference was not statistically significant (P = .279). Notably, the prevalence of CKD in the ≥60 age group was double that of the <60 age group (16.6 vs 8.7), with a statistically significant difference (P < .001) (Table 3).
Prevalence of CKD by Gender and Age Group.

Note. The prevalence of CKD is expressed as the number of individuals along with its percentage given in parentheses with respect to the total number of participants in each group. A comparison of the differences is given according to Pearson’s chi-squared test. CI = confidence interval; CKD = chronic kidney disease.
Statistical significance: P < .05.
The BMA method was used to search for the optimal prediction model with the fewest predictors and maximal predictive performance. A total of 5 models were selected for presentation (Table 4). These models were built based on 2, 3, or 4 common CKD-related variables. The results showed that the posterior probability gradually decreases from models 1 to 5 (0.47 to 0.04). At the same time, probability was also the lowest in models 1 and 3.
Characteristics of 5 Models With the BMA Method.

Models 1 and 2 were suitable for prognostic models for CKD. Of the 5 models under consideration, model 1 had the highest posterior probability (0.47) and the lowest Bayesian information criterion (BIC) and Akaike information criterion (AIC). On the contrary, model 2 had the fewest variables (age and hypertension) while exhibiting a high posterior probability (0.39) and low BIC and AIC, ranking only behind model 1 (Table 4). Specifically, in model 1, every 5-year age increase was associated with 19% higher odds of CKD, comorbidity with diabetes equated to 69% higher odds of CKD, and having hypertension was associated with a 2-fold increase in those odds. Similarly, in model 2, the risk of developing CKD increases by 19% for every additional 5 years of age, and patients with hypertension were 2.3 times more likely to develop CKD (Table 5).
Predictors of the Risk of CKD: Logistic Regression Analysis of Models 1 and 2.

Analysis of the ROC curve showed that our prediction models had an acceptably discriminative performance in distinguishing individuals with CKD from those without CKD (AUC = 0.70; 95% CI = 0.65-0.73 for model 1 and AUC = 0.68; 95% CI = 0.64-0.72 for model 2) (Figure 1).

The discriminative value expressed through the AUC of models 1 and 2.
Figure 2 represents a nomogram that can be used to predict the risk of CKD for an individual with a specific risk profile. For example, a 55-year-old individual with diabetes and hypertension would have a 20% risk of CKD. However, by the time when this individual reaches the age of 70, the risk of developing CKD will increase by 30%.

Nomogram for predicting the individual risk of chronic kidney disease.
The usage instruction is to mark an individual’s age on the “Age” axis and draw a vertical line to the “Points” axis to determine how many points toward the probability of CKD the individual receives for his/her age value. Repetition is required for each additional risk factor. Sum up the risk factors’ salient features. Extend a vertical line from the final sum on the “Total Points” axis to intersect with the “Risk of CKD” axis to determine the individual’s likelihood of sustaining CKD. The overall risk of CKD for a 70-year-old person with hypertension and diabetes is illustrated as follows: The “Age in Years” of 70 years old has 70 “Points”; “yes” at the “Diabetes” axis has 15 points; and “yes” at the “Hypertension” is approximately equivalent to 20 points. As a result, the sum of the individual point values yields 105. Extending a vertical line from the 105-point mark on the “Total Points” axis to intersect with the “Risk of CKD” axis, we can determine a probability of 0.3, equivalent to 30%.
Discussion
This was a large-scale study, which provided population-representative estimates of the prevalence of CKD and its associated risk factors in Vietnam. The study showed that of every 100 adults, there were about 13 (13.1%) experiencing CKD, and the risk of CKD was associated with age, hypertension, and diabetes. In addition, a simple nomogram has been developed to help predict the likelihood of CKD.
Overall, the observed prevalence of CKD in our study aligns with the data reported globally. For instance, the 2017 Global Burden of Disease Study recorded 697.5 million cases of CKD, with a general prevalence rate of 9.1% (8.5-9.8%). 2 Among white individuals, data from the United Kingdom, 38 the United States, Norway, 39 and Canada 40 showed CKD prevalence rates of 12.7%, 12.5%, 11.7%, and 10.2%, respectively. Similarly, a study of 610 adults in a community in Mexico found about 14.7% of individuals with CKD. 11 In Asia, a comprehensive and systematic review observed significant variations in CKD prevalence (ranging from 7.0 to 34.3%) and estimated about 434 million individuals with CKD in Eastern, Southern, and Southeastern Asia. 18 Another systematic review describing CKD rates in South Asian countries found 1 to 4 out of every 10 people in South Asia presenting CKD, with the highest and lowest rates recorded in Pakistan (21.2%) and India (10.2%), respectively. 41 Nationally, data from China—the world’s second most populous country—showed a significant increase in CKD prevalence from 6.7% to 10.6% between 1990 and 2019. 9 The Thai SEEK study in Thailand also identified 626 cases of CKD among 3459 adult participants, with an overall prevalence rate of 17.5%. 42 Besides, a previous report in Vietnam recorded an estimated prevalence of CKD in the general population at 12.8%, 25 a figure entirely consistent with our study. These findings indicated that the data on CKD prevalence in Vietnam were compatible with the global population despite being scarce and only recently documented in some studies. This consistency could be explained by the uniformity in diagnosing CKD based on the KDIGO guideline (ACR ≥3 mg/mmol or eGFR <60 mL/min/1.73 m2 persisting for more than 3 months). 30 However, the discrepancies between studies were inevitable, partly due to the differences in study design, testing methods, and eGFR calculation formulas (eg, MDRD, CKD-EPI, and Cockcroft-Gault). More importantly, the presence of risk factors significantly affects CKD rates, as previously proven. 25
The current study identified 3 factors, including age, hypertension, and diabetes, closely related to the risk of developing CKD. Age is a well-defined risk factor for the development of CKD.9,43 -45 As part of the normal physiological process, kidney function starts to decline after the age of 30 years, even in a healthy person. This decline is particularly quick and steady in the elderly due to structural kidney changes and increased susceptibility to kidney-insulting factors.46 -48 In addition, diabetes and hypertension are also seen as 2 other important traditional risk factors that lead to the development and progression of CKD in both pathophysiological 49 and clinical research aspects.9,50 Indeed, statistical data from a study in Thailand have demonstrated a significant association between CKD and age (increasing by 5% for each additional year), diabetes (odds ratio [OR] = 2.18 for presence and OR = 1.008 for each additional 1 mg/dL of fasting blood glucose), and hypertension (OR = 1.80 for presence and OR = 1.009 for each additional 1 mm Hg of systolic blood pressure). 46 Those results were corroborated by the previous Thai SEEK study. 42 Another study in Nepal indicated age as the strongest risk factor related to CKD; the authors observed that the incidence rates of CKD in the age groups 40 to 59 and ≥ 60 years old were, respectively, 1.4 times (95% CI = 1.0-1.8) and 2.6 times (95% CI = 1.9-3.6) higher than in those aged 20 to 39 years. Hypertension and diabetes also increased the risk of CKD by 2.4 times (95% CI = 2.0-3.0) and 3.2 times (95% CI = 2.5-4.1), respectively. 51 These findings highlighted the importance of early detection and optimal management of hypertension and diabetes to reduce the risk of CKD, especially in a context where non-communicable diseases are increasingly prevalent, and age is an unchangeable risk factor.
We have successfully developed dedicated prognostic models that enable the prediction of CKD to be done simply and rapidly. These models exhibited high posterior probabilities and incorporated just 3 variables: age, hypertension, and diabetes. These factors have been proven to be significant predictors of CKD risk 52 and are typically utilized as standard variables in many models for predicting CKD.25,53 -55 It is crucial that we use Bayesian analysis principles to identify key variables and select the optimal model for predicting CKD. The BMA approach allowed for the selection among all possible models and used the posterior probabilities of these models to carry out all inferences and predictions, thereby overcoming the limitations of the stepwise approach. 32 We identified and analyzed 5 optimal models, among which models 1 and 2 met the criteria for simplicity and reliability. Model 1 included only 3 variables (age, hypertension, diabetes), and model 2 consisted of 2 variables (age, hypertension), both of which can be easily collected in routine clinical practice. Importantly, these models exhibited the highest posterior probabilities (0.47 and 0.39, respectively), with the lowest BIC and AIC values. We also observed that models 1 and 2 provided acceptable discrimination effectiveness. The principal measure of discrimination is represented by the area under the ROC curve, with recorded AUC values of 0.7 (95% CI = 0.65-0.73) for model 1 and 0.68 (95% CI = 0.64-0.72) for model 2. To our knowledge, the current predictive models demonstrate comparable discriminatory performance compared to many reported CKD prediction models (AUC <0.8)25,55,56 and are lower than some of the more sophisticated models recently developed (AUC >0.8),53,54 but our models had significantly fewer variables. Overall, the model we developed demonstrated acceptable discrimination capabilities and holds promise as an effective tool for the early assessment and management of CKD. Ultimately, from the optimized prognostic model, we have developed a nomogram that helps determine the individual risk of CKD based on specific characteristics of the person regarding age, hypertension status, and diabetes.
Our findings hold significant implications for public health in preventing CKD. We have developed a predictive nomogram for assessing CKD risks that could be widely utilized across various populations. Specifically, our algorithm could be particularly applicable in low- and middle-income countries, with demographic and socio-economic characteristics similar to Vietnam and even worldwide, especially in Asia. Owing to its simplicity and ease of use, this nomogram could also hopefully be easily implemented in routine clinical practice. As previously stated, age, hypertension, and diabetes are straightforward to collect through patient history, examination, and routine testing at most health care facilities. The long-term benefits are clear: CKD reduces lifespan and increases mortality risk; thus, prevention and early detection of individuals at risk of developing CKD can prevent adverse outcomes. Screening also enhances cost-effectiveness not only for high-risk individuals but also for the general population through early prevention of cardiovascular disease (CVD), 57 benefiting from new therapeutic agents (such as SGLT2 inhibitor) and home-based screening. 58 However, we also advocate for the necessity of external validation to ensure the reliability of the predictive model.
The interpretation of our research findings should consider the context of strengths and weaknesses. The large-scale study sample, drawn from the general population through a standardized sampling scheme, ensures representativeness and validity. However, all participants were from a single city in the Mekong Delta, and generalization to other provinces may require further validation to ensure diversity. Although our model has been fully internally validated by using the Bootstrap method according to BMA, the absence of any external validation cohorts is a major limitation of the predictive nomogram developed in this study.
Conclusions
Our population-based study showed that the prevalence of CKD was approximately 13.1% among adults in Vietnam, suggesting that CKD should be considered a national health care priority. The independent risk factors for CKD identified in this study were utilized to construct the predictive model. This model demonstrated acceptable predictive performance, highlighting its potential as a clinical tool in identifying individuals at risk for CKD who would benefit most from timely monitoring and intervention.
Footnotes
Acknowledgements
The authors are grateful to express their sincere gratitude to the Rectorate Board of Can Tho University of Medicine and Pharmacy for creating favorable conditions for this study to be carried out. The authors also thank doctors and medical students of the Can Tho University of Medicine for the data collection, clinical measurements, and laboratory tests. We extend our gratitude to the participants who contributed their time and effort to this research study.
Ethical Approval and Consent to Participate
The study’s methodology and protocol received approval from the Research and Ethics Committee of Can Tho University of Medicine and Pharmacy, Vietnam (approval number: 535/PCT-HĐĐĐ). The research was conducted in accordance with the ethical principles outlined in the Declaration of Helsinki. All participants provided written informed consent prior to participation.
Consent for Publication
All the authors consented to publication.
Availability of Data and Materials
Data and Materials are made available upon request to the authors.
Author Contributions
NHV, BPV, NNN, and BTN contributed to the conception and design of the study. NHV, BPV, NNN, and BTN contributed to the acquisition of data, analysis, and interpretation of data. NHV, BPV, NNN, and BTN contributed to drafting the article. NHV, BPV, NNN, and BTN contributed to the final approval.
Declaration of Conflicting Interests
The author(s) declared no potential conflicts of interest with respect to the research, authorship, and/or publication of this article.
Funding
The author(s) received no financial support for the research, authorship, and/or publication of this article.