
Abstract
Background:
Acute kidney injury (AKI) occurs in up to 50% of cardiac surgical patients and is often hemodynamically mediated. Point-of-care ultrasound is a non-invasive tool that has the potential to characterize intrarenal hemodynamics and predict the risk of AKI.
Objectives:
We aimed to determine the predictive characteristics of intrarenal arterial and venous Doppler markers for postoperative AKI in cardiac surgical patients.
Design:
This study is the secondary analysis of a prospective cohort study.
Setting:
This study is carried out in a care academic cardiac surgical center in Montreal, Quebec, Canada.
Patients:
Adult patients undergoing cardiac surgery with the use of cardiopulmonary bypass.
Measurements:
Point-of-care ultrasound assessments were performed preoperatively and at intensive care unit admission. Arterial measurements included the renal resistive index (RRI) and intrarenal artery velocity-time integral normalized to peak systolic velocity (VTI/PSV). Venous measurements included intrarenal venous flow (IRVF) pattern and renal venous stasis index (RVSI).
Methods:
We used area under the receiving operating characteristic curves (AUCs) with net reclassification index (NRI) and multivariable logistic regression to determine predictive characteristics for postoperative AKI. Furthermore, we used hierarchical clustering to identify potential groups with similar Doppler parameters and performed comparisons of patients’ characteristics and outcomes between groups.
Results:
We included 136 patients with 47 (34.6%) developing postoperative AKI. At intensive care unit admission, arterial indices showed similar discrimination for the prediction of AKI (RRI: AUC = 0.64; 95% confidence interval (CI) = 0.55 to 0.74; and VTI/PSV: AUC = 0.67; 95% CI = 0.57 to 0.77). Venous Doppler indices including IRVF patterns (AUC = 0.64; 95% CI = 0.53 to 0.74) and RVSI (AUC = 0.60; 95% CI = 0.50 to 0.71) also showed similar performance. The combined model of RRI and IRVF pattern (AUC = 0.69; 95% CI = 0.59 to 0.78) improved the prediction of AKI compared to either RRI (NRI = 0.50; 95% CI = 0.17 to 0.84) or IRVF pattern (NRI = 0.38; 95% CI = 0.04 to 0.70) alone. Through hierarchical clustering, we identified 3 groups (1: low RRI, 2: high RRI/low RVSI, and 3: high RRI/high RVSI) with different patient characteristics and outcomes. The patient in group 3 had a higher risk of AKI and worse clinical outcomes compared with other groups.
Limitations:
Single-center design in cardiac surgical patients limits generalizability.
Conclusions:
Although more complex indices of intrarenal Doppler indices including the VTI/PSV and RVSI did not improve prediction of postoperative AKI, combining RRI and IRVF pattern improved risk prediction for AKI. Intrarenal arteriovenous Doppler subphenotypes identified patient groups at high risk of postoperative AKI.
Introduction
Acute kidney injury (AKI) is a common complication following cardiac surgery, occurring in up to 50% of patients depending on the definition applied. 1 Patients who experience AKI after cardiac surgery have poorer outcomes including an increased mortality risk that remains elevated for at least 10 years following surgery. 2 The mechanisms of AKI after cardiac surgery are multifactorial including hemodynamic, mechanical (eg, cholesterol and air embolization), inflammatory (eg, oxidative stress), and other (eg, neurohormonal) factors.3-5 Hemodynamic contributors to AKI after cardiac surgery include low cardiac output, hypotensive states, and venous congestion that impair renal perfusion.4,6 Therefore, a detailed assessment of intrarenal hemodynamics has the potential to improve the prediction, prevention, and management of AKI by identifying cardiac surgical patients who may benefit the most from interventions aimed at hemodynamic improvement.
Point-of-care ultrasound (POCUS) is a rapid and non-invasive bedside tool that has increasing application in the optimization of hemodynamics and renal perfusion in cardiac surgical patients. 7 Multiple intrarenal arterial and venous Doppler measurements have been defined to better characterize intrarenal perfusion and potentially lead to more informed hemodynamic management decisions. Intrarenal arterial Doppler measurements include the renal resistive index (RRI) and intrarenal artery velocity-time integral (VTI), which aim to characterize intrarenal arterial flow and are predictive of AKI in cardiac surgical and heart failure populations.8,9 Intrarenal venous Doppler markers are potentially useful assessments of renal venous congestion in cardiac surgical patients, as venous congestion measured by elevated central venous pressure is known to be the primary hemodynamic disturbance that leads to AKI in the decompensated heart failure population. 10 The most well-studied Doppler markers of intrarenal venous blood flow in the cardiac surgical and acute heart failure populations include intrarenal venous flow (IRVF) patterns and renal venous stasis index (RVSI).6,9,11-14
As ultrasound measures of intrarenal hemodynamics have rarely been collected concomitantly, the optimal arterial and venous Doppler markers to predict AKI and optimize renal perfusion are yet to be determined. Therefore, the objective of this study was to determine the predictive ability of intrarenal arterial (RRI and VTI normalized to peak systolic velocity [VTI/PSV]) and venous (IRVF patterns and RVSI) Doppler markers for AKI after cardiac surgery. We hypothesized that VTI/PSV and RVSI would be superior arterial and venous Doppler markers, respectively, relative to RRI and IRVF pattern to predict AKI. We further hypothesized that a combined model of arterial and venous Doppler markers would have significantly greater AKI predictive ability than isolated arterial or venous markers and may lead to the identification of more specific Doppler phenotypes.
Methods
Study Design
We conducted a secondary analysis of a prospective cohort study published previously. 6 The study was conducted at a specialized cardiac surgery center in Montreal, Quebec, Canada. Briefly, patients 18 years and older scheduled to undergo cardiac surgery with the use of cardiopulmonary bypass were consecutively recruited to undergo POCUS studies conducted preoperatively, postoperatively, and then daily for 3 days. Patients with a critical preoperative state (aborted sudden death, preoperative cardiac massage, preoperative mechanical ventilation, preoperative vasopressor or inotrope support, or intra-aortic counterpulsation balloon pump before surgery), pre-existing AKI, severe chronic kidney disease (estimated glomerular filtration rate <15 mL/min per 1.73 m2), renal transplantation, delirium before surgery, or conditions interfering with Doppler evaluation of the portal system were excluded. Pulse-wave Doppler was used to assess portal vein, hepatic vein, and intrarenal arteries and veins. The study was approved by the Montreal Heart Institute ethics board. Written informed consent was obtained for all participants. We followed the Strengthening the Reporting of Observational Studies in Epidemiology guidelines. 15
Population
In addition to the inclusion criteria of the original study, patients were excluded from this substudy if they did not have at least 1 successful evaluation preoperatively and upon intensive care unit (ICU) admission with interpretable arterial or venous intrarenal pulse-wave Doppler images.
Data Collection
Demographic and clinical data were collected preoperatively including comorbidities, baseline estimated glomerular filtration rate (calculated with Modified Diet in Renal Disease formula), the New York Heart Association functional classification score, baseline left ventricular ejection fraction, diuretic use, blood pressure, and European System Operative Score Risk Evaluation score (EuroSCORE II).16-18 Intraoperative data included type of cardiac surgery, duration of cardiopulmonary bypass, urine output, vasopressor use, and cardiac index. Postoperative data included blood pressure, pulmonary artery pressure, cerebral oximetry, vasopressor support, NT-pro-BNP, AKI, delirium, 30-day mortality, and duration of ICU stay.
Intrarenal Doppler Arterial and Venous Flow Measurement
The method of ultrasound image acquisition is described previously. 6 OsiriX DICOM Viewer (Pixmeo SARL, Switzerland, Version 13.0.1, 2022) was used to measure VTI/PSV and RVSI (Figure 1). The RVSI is calculated with the formula: (cardiac cycle time—venous flow time)/cardiac cycle time, as previously described. 12 The VTI was divided by PSV to minimize variation in absolute VTI quantification due to Doppler insonation angle and vessel size, resulting in the creation of the VTI/PSV index. When patients had multiple Doppler scans recorded, the average VTI/PSV was calculated by measuring the Doppler waveform from a single cardiac cycle from each scan. The RRI was calculated by the following formula: (peak systolic velocity − end-diastolic velocity)/peak systolic velocity. The IRVF patterns were classified based on the following: (1) continuous Doppler signals from systole to the end of diastole, (2) interrupted with signal both in systole and diastole, and (3) interrupted with signal only present in diastole. The IRVF pattern was considered abnormal when either pattern 2 or 3 was present. Intrarenal Doppler markers for each patient preoperatively and upon ICU admission were analyzed.

Measurement of arterial and venous intrarenal Doppler markers. (A) Measurement of renal resistive index (RRI) and intrarenal artery velocity-time integral normalized to peak systolic velocity (VTI/PSV). (B) Identification of intrarenal venous flow (IRVF) patterns. (C) Measurement of the renal venous stasis index (RSVI). EDV = end-diastolic velocity; PSV = peak systolic velocity.
Reproducibility
Interobserver agreement was measured for RVSI. Two investigators (CG and WB-S) measured RVSI for 20 random studies without knowledge of the other observer’s measurements. The intraclass correlation coefficient (ICC) was calculated with 95% confidence interval (CI). This is a convenience sample, and no sample size calculation was performed.
Clinical Outcomes
The primary outcome was AKI as defined by the Kidney Disease Improving Global Outcomes (KDIGO) criteria as an increase of serum creatinine >26 µmol/L within a 48-hour period or 50% from baseline creatinine within a week from cardiac surgery. Urine output AKI criteria were omitted due to the inconsistent reporting and accuracy of urine output data. Severe AKI was defined as an increase of 100% or more in baseline creatinine or to ≥354 µmol/L or initiation of kidney replacement therapy (KDIGO stage 2 or 3). 19
Statistical Analysis
The association between IRVF patterns and RVSI was determined with a box plot, whereas RRI and VTI/PSV were compared using the Pearson correlation coefficient. The distribution of ultrasound parameters before and after surgery was compared using paired t-tests or Wilcoxon test for continuous variables according to the distribution of data and with the McNemar test for categorical variables.
To determine the ability of each Doppler marker assessment at ICU admission after surgery to predict AKI, the values of RRI, VTI/PSV, RVSI, and IRVF patterns were used to generate receiver operating characteristic (ROC) curves. The results are presented in area under the receiver operating characteristic curves (AUCs) with 95% CIs for each Doppler marker.
To determine whether both arterial and venous markers remained associated with AKI after adjustment, a multivariable logistic regression model was created including both arterial and venous Doppler markers as predictors of AKI. The results are presented as odds ratio (OR) with 95% CIs. The predicted probabilities of AKI based on this multivariable model were exported for each patient and were used to generate an ROC curve analysis as previously described.
The AUCs were compared using the DeLong test. The improvement in predicting the risk of AKI between individual Doppler markers as well as with the multivariable model combining arterial and venous markers was assessed by computing the continuous net reclassification improvement (NRI) index with 95% CIs generated by bootstrap sampling (1000 iterations).
Hierarchical clustering was used to identify potential categories based on the value of the RRI and RVSI at ICU admission. A Euclidean distance was used with complete linkage analysis. The number of clusters was decided through the visual analysis of the dendrogram. The characteristics and outcomes of patients included in each cluster are presented. Comparisons were made using 1-way analysis of variance (ANOVA) (or Kruskal-Wallis test, as appropriate in case of non-normal distribution) for continuous variables or chi-squared tests (or Fisher’s exact test as appropriate in case of low cell number <5). When a significant result was observed, post hoc comparisons were performed with the Bonferroni correction for multiple testing.
Throughout this article, data are presented in counts (%) and in mean ± standard deviation (SD) or median (interquartile range [IQR]) based on the distribution of continuous variables on Q-Q plots. Data analysis was performed in SPSS version 2.6 and R (version 4.2) using the cluster package (2.1.6). 20
Results
Patients’ Characteristics
After excluding patients without concomitant Doppler assessment of arterial and venous, the present study consisted of 136 patients from the initial study cohort. Baseline characteristics are presented in Table 1.
Patient Characteristics.

Note. AKI = acute kidney injury; BMI = body mass index; BP = blood pressure; CABG = coronary artery bypass graft; CPB = cardiopulmonary bypass; COPD = chronic obstructive pulmonary disease; DBP = diastolic blood pressure; eGFR = estimated glomerular filtration rate; ICU = intensive care unit; IRVF = intrarenal venous flow; LVEF = left ventricular ejection fraction; NYHA = New York Heart Association; RRI = renal resistive index; RVSI = renal venous stasis index; SBP = systolic blood pressure; VTI/PSV = intrarenal artery velocity-time integral normalized to peak systolic velocity.
Most participants had a normal RRI before surgery (0.71 ± 0.08), and few patients had an abnormal IRVF pattern (6 [4.5%]) or high RVSI (median = 0.00 [IQR = 0.00-0.05]). The distribution of RRI remained similar (0.70 ± 0.09, P = .37) after ICU admission, although a significant reduction of the VTI/PSV was observed (0.48 ± 0.10 vs 0.40 ± 0.11, P < .001). A greater proportion had an abnormal IRVF pattern (41 [30.1%], P < .001), and a higher distribution of RVSI (median = 0.00 [IQR = 0.00-0.29], P < .001) was also observed after surgery compared with preoperative assessment. Interobserver reliability on the calculated value of RVSI was excellent (ICC = 98; 95% CI = 0.04 to 0.99).
During the week following cardiac surgery, 47 (34.6%) patients developed AKI and 9 (6.6%) developed severe AKI. During the 30 days following surgery, 1 participant died.
Individual Doppler Markers and Postoperative Acute Kidney Injury
Prior to cardiac surgery, neither arterial (RRI and VTI/PSV) nor venous (IRVF pattern and RVSI) Doppler markers predicted the development of postoperative AKI (Table 2 and Supplemental Figures S1, S3, S5, and S7).
Performance of Intrarenal Doppler Markers to Identify Patients Who Will Develop Acute Kidney Injury After Cardiac Surgery.

Note. AKI = acute kidney injury; AUC = area under the receiver operating characteristic curve; CI = confidence interval; ICU = intensive care unit; IRVF = intrarenal venous flow; RRI = renal resistive index; RVSI = renal venous stasis index; VTI/PSV = intrarenal artery velocity-time integral normalized to peak systolic velocity.
The ROC analysis for arterial markers upon ICU admission (Supplemental Figures S2 and S4) showed similar discrimination of AKI development for RRI and VTI/PSV (RRIAUC = 0.64; 95% CI = 0.55 to 0.74 vs VTI/PSVAUC = 0.67; 95% CI = 0.57 to 0.77, P = .38) and produced no improvement in classification (NRI = 0.32; 95% CI = −0.06 to 0.69). The RRI and VTI/PSV were also significantly correlated (Pearson r = .49, P < .001) (Supplemental Figure S10).
The ROC analysis for venous markers upon ICU admission (Supplemental Figures S6 and S8) also showed similar discrimination of AKI development for IRVF patterns and RVSI (IRVFAUC = 0.64; 95% CI = 0.53 to 0.74 vs RVSIAUC = 0.60; 95% CI = 0.50 to 0.71, P = .19), although the use of RVSI resulted in a worsening of classification (NRI = −0.52; 95% CI = −0.82 to −0.20). The correlation between IRVF patterns and RVSI is depicted in Supplemental Figure S9.
Combination of Doppler Markers and Postoperative Acute Kidney Injury
In the multivariable model combining arterial and venous Doppler assessment on postoperative day 0, a higher RRI and worsening IRVF were independently associated with higher odds of developing AKI (Table 3). The combined model of RRI and IRVF pattern (RRI-IRVFAUC = 0.69; 95% CI = 0.59 to 0.78) resulted in an improvement of the classification regarding the risk of AKI compared to either RRI (NRI = 0.50; 95% CI = 0.17 to 0.84) or IRVF pattern (NRI = 0.38; 95% CI = 0.04 to 0.70) in isolation (Figure 2).
Association Between Doppler Markers at ICU Admission and Postoperative Acute Kidney Injury.

Note. Multivariable logistic regression model variables: RRI and IRVF pattern. CI = confidence interval, IRVF = intrarenal venous flow, OR = odds ratio, RRI = renal resistive index.

Receive operating characteristic (ROC) plots for the prediction of postoperative AKI based on arterial and venous Doppler markers measured at intensive care unit admission. Renal resistive index (RRI), intrarenal venous flow (IRVF) pattern, and combined model of RRI and IRVF pattern.
In a sensitivity analysis, similar results were found for the multivariable model of RRI and RVSI on postoperative day 0, with higher RRI and RVSI associated with higher odds of developing AKI (Supplemental Table S1). The combined model of RRI and RVSI (RRI-RVSIAUC = 0.69; 95% CI = 0.59 to 0.78) was more predictive of AKI than either RRI (NRI = 0.50; 95% CI = 0.14 to 0.86) or RVSI (NRI = 0.38; 95% CI = 0.04 to 0.73) in isolation (Supplemental Figure S11).
In sensitivity analysis, we compared the performance of the combined model to two validated prediction models. There were no significant differences in the discrimination compared to either model (Supplemental Figure S12).
Identification of Subphenotypes Based on Arterial and Venous Doppler Markers
In exploratory analyses, we included RRI and RVSI as continuous variables in a hierarchical clustering process to identify groups with similarities regarding these parameters. This process led to the identification of 3 subphenotypes (Figure 3). Cluster 1 (39 [28.7%]) had a low RRI and variable RVSI, cluster 2 (80 [58.8%]) with a higher RRI and low/intermediate RVSI was most frequently found, and cluster 3 (17 [12.5%]) had a high RRI and a high RVSI. The characteristics of each group are presented in Table 4. Compared with cluster 2 (majority), patients in cluster 1 were younger with a lower burden of comorbidities, lower preoperative risk assessment (EuroSCORE II), and the shortest duration of ICU stay, whereas patients in cluster 3 were older and at higher risk. There were no differences between clusters in baseline eGFR, cardiac function (left ventricular ejection fraction [LVEF] %), or type of cardiac surgery. Patients in cluster 1 with low RRI required less intraoperative and postoperative vasopressor support. Patients in cluster 3 with high RVSI had greater preoperative diuretic use, higher systolic pulmonary artery pressures at ICU admission, and higher postoperative NT-pro-BNP levels. The incidence of AKI was disproportionally higher in patients classified in cluster 3 (64.7%) compared with patients classified in cluster 1 (25.6%) or 2 (32.5%), although there was no difference in the frequency of severe AKI between clusters (Table 4).
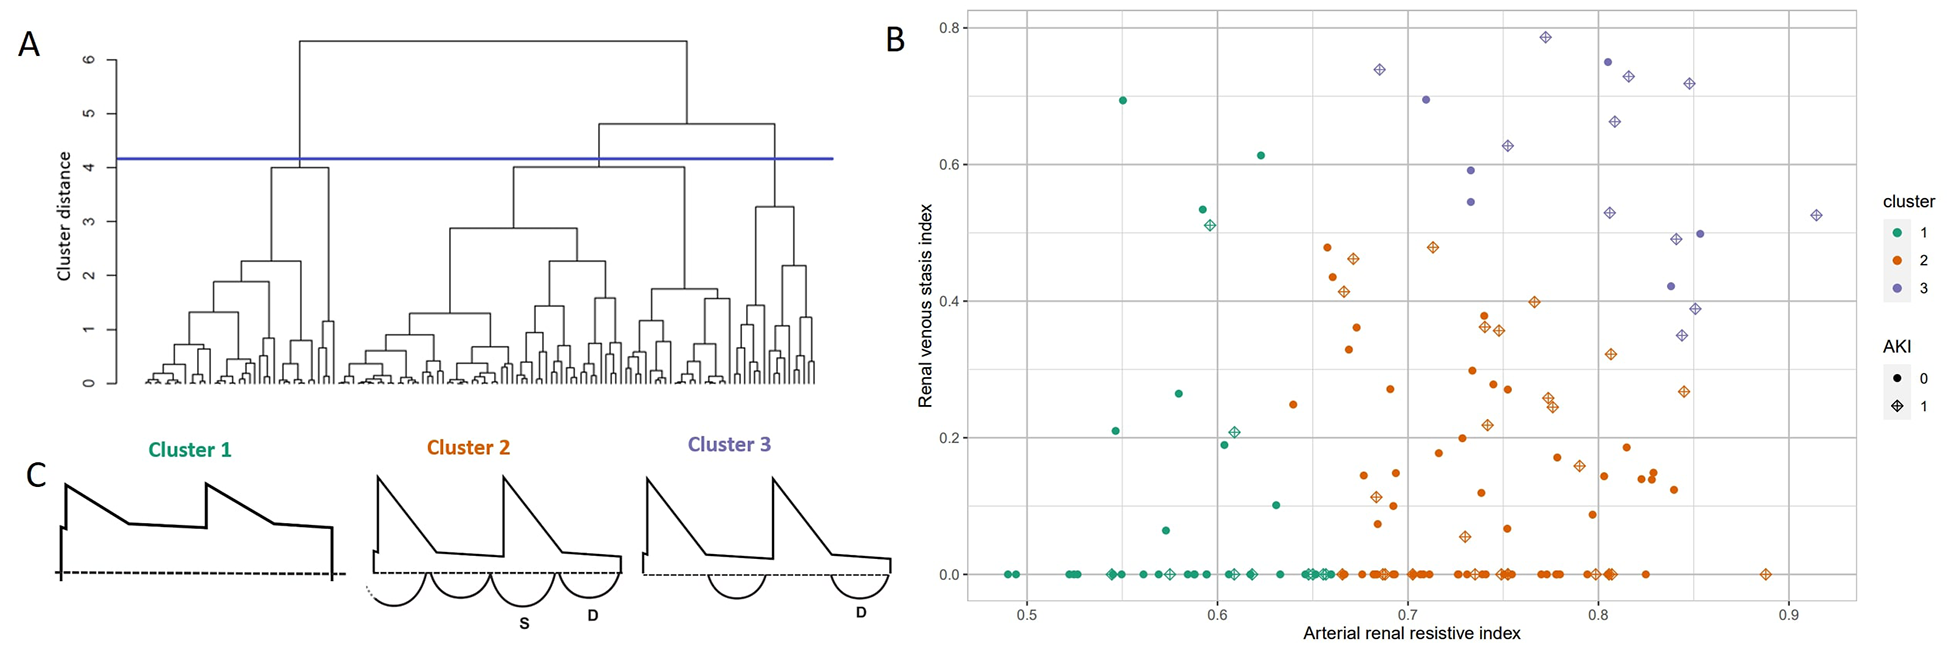
Hierarchical clustering based on the renal resistive index (RRI) and the renal venous stasis index (RVSI) at day 0 after cardiac surgery. (A) Dendrogram with the cutoff (blue line) used for cluster attribution. (B) Cluster membership and occurrence of acute kidney injury (AKI) in the postoperative period. The incidence of AKI was disproportionally higher in patients classified in cluster 3 (64.7%) compared with patients classified in cluster 1 (25.6%) or 2 (32.5%). (C) Schematic representation of typical Doppler waveforms in each cluster (1 = Low RRI, 2 = High RRI, Low RVSI, 3 = High RRI, High RVSI).
Characteristics of Patients Based on the Arteriovenous Doppler Subphenotypes.

Note. Subgroup differences after the Bonferroni correction for multiplicity: aSignificant difference between clusters 1 and 2; bSignificant difference between clusters 1 and 3; cSignificant difference between clusters 2 and 3.
BMI = body mass index; BP = blood pressure; CABG = coronary artery bypass graft; COPD = chronic obstructive pulmonary disease; CPB = cardiopulmonary bypass; DBP = diastolic blood pressure; eGFR = estimated glomerular filtration rate; IRVF = intrarenal venous flow; LVEF = left ventricular ejection fraction; NIRS = near-infrared spectroscopy; NYHA = New York Heart Association; RRI = renal resistive index; RVSI = renal venous stasis index; SBP = systolic blood pressure.
Discussion
In a cohort of patients undergoing cardiac surgery with the use of cardiopulmonary bypass, we identified that intrarenal Doppler markers of arterial and venous flow are predictive of postoperative AKI independently of each other. The VTI/PSV and RVSI, more complex markers of intrarenal arterial and venous flow, respectively, were not superior to the simpler markers RRI and IRVF pattern in their prediction of postoperative AKI. Furthermore, the combined model of arterial and venous flow Doppler markers only demonstrated marginal improvement in the prediction of postoperative AKI relative to arterial and venous markers in isolation.
The RRI is a non-invasive marker of blood pulsatility that is simply measured at the bedside using intrarenal arterial systolic and diastolic flow velocities. 21 Previous work has shown that the RRI is a useful marker for the prediction of postoperative AKI.8,22 In our cluster analysis, patients with low RRI were younger, had less hypertension and diabetes, and required less vasopressor support, which may all contribute to improved renal perfusion and reduced risk of AKI in this subgroup. However, multiple intrarenal and extrarenal factors may influence RRI, including vascular compliance, cardiac function, and renal capillary wedge pressure, which may limit its predictive ability for AKI. 21 The VTI is a more recently developed marker of intrarenal perfusion. Previous work in patients with decompensated heart failure demonstrated that low VTI was associated with lower cardiac index and eGFR, suggesting it may be used as a non-invasive measure of renal perfusion. 9 While a lower VTI was found to be associated with an increased risk of cardiac events in the heart failure population, this parameter had never previously been studied to predict the risk of AKI. 9 Our study is the first to identify that a reduced VTI when normalized to PSV predicts postoperative AKI, further corroborating that VTI is a non-invasive measure of intrarenal perfusion. However, the utility of assessing VTI to optimize renal perfusion through fluid management and vasoactive and/or ionotropic medications in the perioperative setting remains to be determined given its complexity and similar performance characteristics to the RRI.
Mechanistically, animal models have demonstrated that renal perfusion is dependent not only on arterial flow but also on renal venous pressure. 23 Elevations in renal venous pressure reduce renal artery blood flow and increase neurohormonal activation of the renin-angiotensin-aldosterone system, leading to reduced glomerular filtration rate and increased proteinuria. 23 When assessed non-invasively by Doppler ultrasound, renal venous flow follows a predictable pattern of increasing discontinuity as right atrial pressure and venous congestion increases.24,25 The abnormal pattern of venous flow representative of severe venous congestion, characterized by a signal only restricted to a brief period during diastole, has been associated with AKI following cardiac surgery. 6 Unlike IRVF patterns which are categorical, the RVSI provides a continuous quantitative measurement of renal venous congestion. A higher RVSI, suggesting a greater degree of renal venous congestion, has been associated with AKI in both cardiac surgery and acute decompensated heart failure populations.12-14 However, whether RVSI is superior to IRVF patterns in predicting clinically important outcomes such as hospitalization, AKI, and mortality had previously remained uncertain.12,14 Here, we provided further evidence that a higher RVSI indicates worsening renal venous congestion, as the patients in cluster 3 with high RVSI had increased preoperative diuretic use, higher systolic pulmonary artery pressures at ICU admission, and higher NT-pro-BNP levels in the postoperative period. Furthermore, the high RVSI cluster also experienced the highest rates of AKI at 64.7%, indicating that renal venous congestion either predisposes or directly contributes to the development of AKI. However, despite its more complex continuous measurement, the RVSI did not outperform the categorical IRVF patterns in the prediction of postoperative AKI. Therefore, a more expedient qualitative interpretation of IRVF patterns appears to be a suitable alternative to the RVSI in understanding renal venous hemodynamics to implement interventions such as diuresis or inhaled pulmonary vasodilators that could possibly mitigate the risk of postoperative AKI. 26
Organ perfusion, including renal blood flow and glomerular filtrate rate, is dependent on both mean arterial pressure (MAP) and renal venous pressure. 27 In a study of 11 patients with septic shock, increasing the MAP target from 65 to 75 mm Hg significantly increased urine output and reduced RRIs, suggesting that individualized MAP targets based on RRIs may improve renal perfusion and function. 28 In a study of 15 patients with acute heart failure, decongestive therapy with loop diuretics led to a significant improvement toward a continuous venous flow pattern in IRVF patterns and RVSIs without a significant change in RRIs. 29 These data suggest that a combined analysis of intrarenal arterial and venous Doppler markers is necessary to fully capture a patient’s intrarenal hemodynamics and to implement therapies to improve renal perfusion such as vasoactive medications or decongestion with diuretics. Here, we found that our combined model of RRI and IRVF pattern evaluating intrarenal hemodynamics on postoperative day 0 marginally improved the prediction of postoperative AKI when compared with each Doppler marker in isolation. Although the predictive performance of intrarenal Doppler markers was found to only be satisfactory for postoperative AKI, combined RRI and IRVF pattern monitoring may have a greater role therapeutically by assisting in optimization of intrarenal perfusion and warrants further study. Intrarenal Doppler may add to existing strategies, such as urine oximetry, goal-directed oxygen therapy on cardiopulmonary bypass, and continuous cardiac output monitoring, that aim to improve oxygen delivery to the kidney and optimize renal perfusion to prevent AKI in cardiac surgery.30-32
There are several limitations to this study. Urine output AKI criteria were omitted, and so AKI may have been underdiagnosed with the application of the serum creatinine AKI definition. Furthermore, patients were not subclassified based on AKI etiology, and so the predictive performance may have been hindered by including patients with primarily non-hemodynamic AKI (eg, acute interstitial nephritis). The VTI/PSV and RVSI were calculated on images already acquired for another purpose, and the performance could have differed if measurements would have been performed during primary data collection. Furthermore, although hierarchical clustering was used to provide a better description of combinations of arterial and venous Doppler markers, external validation would be required to determine whether these subgroups can be reliably found and truly represent subphenotypes. The single-center design in cardiac surgical patients also limits generalizability to other diverse patient populations.
Conclusions
In summary, we found that a combined approach to assessing intrarenal hemodynamics using both arterial and venous Doppler markers, such as the RRI and IRVF pattern, can be used to identify cardiac surgical patients at higher risk of hemodynamic AKI in the postoperative setting. We found that VTI/PSV is an arterial Doppler marker of renal perfusion. However, its performance characteristics in the prediction of postoperative AKI in cardiac surgical patients are not significantly greater than the simpler RRI. We demonstrated that the RVSI does not outperform the IRVF pattern as a venous congestion marker to predict postoperative AKI. We further characterized 3 subphenotypes of intrarenal arteriovenous flow, with nearly two thirds of patients with high RRI and RVSI experiencing postoperative AKI. Future interventional research is necessary to determine whether optimization of these intrarenal Doppler markers reduces the risk of AKI in cardiac surgical and other populations.
Supplemental Material
sj-docx-1-cjk-10.1177_20543581241309976 – Supplemental material for Prediction of Acute Kidney Injury After Cardiac Surgery With Combined Arterial and Venous Intrarenal Doppler
Supplemental material, sj-docx-1-cjk-10.1177_20543581241309976 for Prediction of Acute Kidney Injury After Cardiac Surgery With Combined Arterial and Venous Intrarenal Doppler by Cameron Giles, Karel Huard, André Denault and William Beaubien-Souligny in Canadian Journal of Kidney Health and Disease
Footnotes
Ethics Approval and Consent to Participate
Written consent was obtained for all participants and the project was approved by the Montreal Heart Institute Ethics Committee (2016–1946).
Consent for Publication
All participants provided written consent for publication.
Availability of Data and Materials
We certify that this manuscript nor one with substantially similar content has been published or is being considered for publication elsewhere, except in abstract form. The data that support the findings of this study are available from the corresponding author. Access to the data will be granted contingent upon the approval of the relevant ethics committee.
Author Contributions
CG and WB-S contributed to study concept and design. All authors contributed to acquisition, analysis, or interpretation of data. CG and WB-S contributed to drafting of the manuscript. All authors contributed to critical revision of the manuscript for important intellectual content. CG and WB-S contributed to statistical analysis. WB-S contributed to study supervision. All authors approved the final version of the submitted manuscript.
Declaration of Conflicting Interests
The author(s) declared the following potential conflicts of interest with respect to the research, authorship, and/or publication of this article: All authors have completed the ICMJE uniform disclosure form at ![]() . WB-S reports receiving research funding from Displaid and consulting honoraria from GSK and Bayer. AD reports receiving a research grant from Edwards and consulting fees from CAE Healthcare and speaker honoraria from Masimo. The remaining authors declare no support from any organization for the submitted work; no financial relationships with any organizations that might have an interest in the submitted work in the previous 3 years; and no other relationships or activities that could appear to have influenced the submitted work.
. WB-S reports receiving research funding from Displaid and consulting honoraria from GSK and Bayer. AD reports receiving a research grant from Edwards and consulting fees from CAE Healthcare and speaker honoraria from Masimo. The remaining authors declare no support from any organization for the submitted work; no financial relationships with any organizations that might have an interest in the submitted work in the previous 3 years; and no other relationships or activities that could appear to have influenced the submitted work.
Funding
The author(s) disclosed receipt of the following financial support for the research, authorship, and/or publication of this article: WB-S work is supported by the Fonds de recherche du Québec—Santé (Junior 1 research scholar) and from the Kidney Foundation of Canada (KRESCENT program). The funding sources had no role in study design; data collection, analysis, or interpretation; writing the report; or the decision to submit the report for publication.
Supplemental Material
Supplemental material for this article is available online.
References
Supplementary Material
Please find the following supplemental material available below.
For Open Access articles published under a Creative Commons License, all supplemental material carries the same license as the article it is associated with.
For non-Open Access articles published, all supplemental material carries a non-exclusive license, and permission requests for re-use of supplemental material or any part of supplemental material shall be sent directly to the copyright owner as specified in the copyright notice associated with the article.