
Abstract
Background:
Patients receiving maintenance hemodialysis have multiple comorbidities and are at high risk of presenting to the hospital. However, the incidence and cost of acute health care utilization in the in-center hemodialysis population and how this compares with other populations is poorly understood.
Objective:
To determine the rate, pattern, and cost of emergency department visits and hospitalizations in patients receiving in-center hemodialysis compared with a matched general population.
Design:
Population-based matched cohort study.
Setting:
We used linked administrative health care databases from Ontario, Canada.
Patients:
We included 25 379 patients (incident and prevalent) receiving in-center hemodialysis between January 1, 2010, and December 31, 2018. Patients were matched on birth date (±2 years), sex, and cohort entry date using a 1:4 ratio to 101 516 individuals from the general population.
Measurements:
Our primary outcomes were emergency department visits (allowing for multiple visits per individual) and hospital admissions from the emergency department. We also assessed all-cause hospitalizations, all-cause readmissions within 30 days of discharge from the original hospitalization, length of stay for hospital admissions (including multiple visits per individual), and the financial cost of these admissions.
Methods:
We presented the rate, percentage, median (25th, 75th percentiles), and incidence rate per 1000 person-years for emergency department visits and hospitalizations. Individual-level health care costs for emergency department visits and all-cause hospitalization were estimated using resource intensity weights multiplied by the cost per weighted case.
Results:
Patients receiving in-center hemodialysis had substantially more comorbidities (eg, diabetes) than the matched general population. Eighty percent (n = 20 309) of patients receiving in-center hemodialysis had at least 1 emergency department visit compared with 56% (n = 56 452) of individuals in the matched general population, over a median follow-up of 1.8 years (25th, 75th percentiles: 0.7, 3.6) and 5.2 (2.5, 8.4) years, respectively. The incidence rate of emergency department visits, allowing for multiple visits per individual, was 2274 per 1000 person-years (95% confidence interval [CI]: 2263, 2286) for patients receiving in-center hemodialysis, which was almost 5 times as high as the matched general population (471 per 1000 person-years; 95% CI: 469, 473). The rate of hospital admissions from the emergency department and the rate of all-cause hospital admissions in the in-center hemodialysis population was more than 7 times as high as the matched general population (hospital admissions from the emergency department: 786 vs 101 per 1000 person-years; all-cause hospital admissions: 1056 vs 139 per 1000 person-years). The median number of all-cause hospitalization days per patient year was 4.0 (0, 16.5) in the in-center hemodialysis population compared with 0 (0, 0.5) in the matched general population. The cost per patient-year for emergency department visits in the in-center hemodialysis population was approximately 5.5 times as high as the matched general population while the cost of hospitalizations in the in-center hemodialysis population was approximately 11 times as high as the matched general population (emergency department visits: CAN$ 1153 vs CAN$ 209; hospitalizations: CAN$ 21 151 vs CAN$ 1873 [all costs in 2023 CAN$]).
Limitations:
External generalizability and we could not determine whether emergency department visits and hospitalizations were preventable.
Conclusions:
Patients receiving in-center hemodialysis have high acute health care utilization. These results improve our understanding of the burden of disease and the associated costs in the in-center hemodialysis population, highlight the need to improve acute outcomes, and can aid health care capacity planning. Additional research is needed to address the risk of hospitalization after controlling for patient comorbidities.
Trial registration:
This is not applicable as this is a population-based matched cohort study and not a clinical trial.
Introduction
Over the last 20 years, the number of Canadians receiving maintenance dialysis nearly doubled with more than 29 000 individuals receiving dialysis in 2021. 1 Worldwide this number is expected to increase to 5.4 million by the year 2030, up from 2 million in 2010. 2 Nearly, three quarters of patients in Canada receiving maintenance dialysis do so at a hospital or at a community or satellite hemodialysis unit (ie, in-center hemodialysis). 3 Patients receiving in-center hemodialysis are generally older (average age 65 years), have more comorbidities, and have higher health care resource utilization (CAN$100 000 per patient per year) compared with other dialysis types (eg, peritoneal dialysis).3-5
There are an increasing number of studies examining health care utilization in patients receiving maintenance dialysis. These studies have consistently found that individuals receiving maintenance dialysis frequently visit the emergency department or require hospitalization.4,6-14 For example, Komenda et al 6 found the rate of emergency department visits in patients receiving dialysis was 8.5 times as high as the general population. However, these previous studies had limitations, including a lack of detailed information on multiple aspects of health care utilization (eg, emergency department visits, in-patient hospitalizations, and costs).
Understanding health care utilization in patients receiving in-center hemodialysis and their associated costs could be used to guide resource planning, impact future funding decisions, and encourage the development of approaches that might improve patient care while reducing costs. Therefore, we conducted this study to examine acute health care utilization, including emergency department visits, hospitalizations, and costs among patients receiving in-center hemodialysis in Ontario, Canada compared with a matched general population.
Methods
Design and Setting
We conducted a population-based matched cohort study using administrative health care databases in Ontario, Canada. These data sets were linked using unique encoded identifiers and analyzed at ICES Western (ices.on.ca). ICES is an independent, non-profit research institute whose legal status under Ontario’s health information privacy law allows it to collect and analyze health care and demographic data, without consent, for health system evaluation and improvement. The use of data in this project was authorized under section 45 of Ontario’s Personal Health Information Protection Act, which does not require review by a Research Ethics Board. We followed the reporting of studies conducted using observational routinely collected health data guidelines (RECORD) (Supplementary Table S1). 15
Data Sources
We used several databases to obtain information on patient demographics, comorbidities, and outcomes. To identify patients receiving in-center hemodialysis we used the Ontario Renal Reporting System (ORRS) database, a provincial reporting system in which reporting by the hospital-based Regional Renal Programs is mandatory to receive financial reimbursement for their activities. 16 Vital status (mortality can be accurately ascertained in our data sources) 17 and demographic information were obtained from the Registered Persons Database. We used the Canadian Institute for Health Information (CIHI) Discharge Abstract Database to identify hospital admissions, and procedural and diagnostic codes associated with hospitalizations; submission of data is mandated by the provincial ministry of health. 18 The CIHI Same Day Surgery Database was used to identify day surgeries. The CIHI National Ambulatory Care Reporting System database was used to identify emergency department visits. Reasons for emergency department visits and hospitalizations could not be accurately determined from our administrative health care databases. The Ontario Health Insurance Plan contains information on inpatient and outpatient physician submitted diagnostic and billing codes. Supplementary Table S2 contains further information on the databases and coding definitions.
Cohort
In-center hemodialysis
We included patients receiving in-center hemodialysis between January 1, 2010 and December 31, 2018. We excluded individuals aged < 18 years. To ensure we were not capturing patients receiving acute dialysis, we required all patients to remain on in-center hemodialysis for at least 90 days. To ensure continuity of care, we required that patients received care at the same Regional Renal Program for at least 28 days; there are 27 Regional Renal Programs in Ontario that oversee 97 hemodialysis units with over 10 000 patients receiving in-center hemodialysis. 19 Patients already receiving in-center hemodialysis at the beginning of the accrual period had an index date (ie, cohort entry date) of January 1, 2010, while individuals initiating in-center hemodialysis between January 2, 2010 and December 31, 2018 had an index date of 90 days after dialysis initiation. If a patient’s index date overlapped with an emergency department visit or hospital admission, the index date was reassigned to the day after hospital discharge.
General population
Since the general population is very large (more than 14 000 000 residents in Ontario), we randomly selected 200 individuals from the general population that were matched (on sex and birth date within 2 years) with each individual from the in-center hemodialysis population. We assigned the general population the same index date as the matched individuals receiving in-center hemodialysis. If the index date overlapped with an emergency department visit or hospital admission, we reassigned the index date to the day after hospital discharge. We excluded individuals aged < 18 years and anyone who previously received maintenance dialysis (including home hemodialysis and peritoneal dialysis) prior to the index date. Finally, we randomly selected 4 unique individuals from the general population for each individual receiving in-center hemodialysis.
Outcomes
Our primary outcomes included the rate of emergency department visits (allowing for multiple visits per individual) and the rate of all-cause hospitalizations from the emergency department visits (allowing for multiple visits per individual).
Our secondary outcomes included all-cause hospital admissions (including admissions for elective procedures and admissions that are from the emergency department or bypass the emergency department), all-cause hospitalizations that bypassed the emergency department, and all-cause readmission within 30 days of being discharged from the original hospitalization. We also reported the method of entry into hospital (ie, the last entry point prior to being admitted as an inpatient) 20 as well as whether admissions were elective. Methods of entry into the hospital, included direct admission to the hospital (ie, patient admitted through the admitting department or admitted directly to the unit), day procedure (ie, patient admitted through the day surgery department), patient admitted directly from a hemodialysis unit or medical clinic (eg, cardiac clinic), or patient admitted through the emergency department. 20
We used the ICES case-costing macro to compute individual-level health care costs for emergency department visits (allowing for multiple visits per individual) and all-cause hospitalization (including admissions for elective procedures and allowing for multiple hospitalizations per individual). The macro calculates costs using resource intensity weights multiplied by the cost per weighted case (ie, cost of a hypothetical average patient in Ontario). 21 Resource intensity weights do not provide a direct cost estimate, rather it is an average of over 20 Ontario organizations (and 2 in Alberta) that submits data to CIHI’s costing group. Costs related to physician services provided in hospital are not included in the cost per weighted case. 21 Costs that are paid by private insurers, out-of-pocket costs, indirect costs (eg, lost productivity), and costs related to public health services are also not included. Costs were presented as CAD 2023.
Statistical Analysis
We reported categorical variables as proportions, while continuous variables were reported as medians (25th, 75th percentiles) or means (± standardized deviation). We used standardized differences to compare baseline characteristics between the in-center hemodialysis population and the matched general population. Standardized differences allow for comparisons between groups independent of sample size with a standardized difference of ≥ 10% between groups considered substantially different. 22
For all outcomes, we reported the rate and percentage of events, the total person-years of follow-up, and the event rate per 1000 person-years (95% confidence interval [CI]), 23 allowing for multiple events per person. The 95% CIs are not adjusted for multiplicity. We followed the in-center hemodialysis population until death, emigration from the province (defined as no evidence of a health care interaction in the last 7 years), receipt of a kidney transplant, dialysis modality switch (eg, switch to home dialysis), or no longer receiving hemodialysis (ie, recovered kidney function, withdrew from dialysis or loss to follow-up). We followed individuals in the matched general population until death, initiation of maintenance dialysis, or receipt of a kidney transplant. The maximum follow-up date was March 31, 2019 (maximum follow-up 9.25 years). All analyses were conducted using SAS version 9.4 (SAS Institute, Cary, NC).
Additional Analyses
We stratified all outcomes in patients receiving in-center hemodialysis by prevalent (ie, entered the cohort on January 1, 2010) and incident status (ie, entered the cohort [started dialysis] between January 2, 2010 and December 31, 2018); the risk of being hospitalized is highest in the initial period after dialysis initiation. 24 Post hoc, among those with a hospital admission from the emergency department, we calculated the median in-hospital length of stay (days). This was calculated by subtracting the day of hospital admission from the day of discharge or the day of a censoring event, if the event occurred in the hospital (eg, death). Individuals who entered and left the hospital on the same day had a length of stay of 1 day. We did not count transfers from 1 acute care hospital to another as being discharged from the hospital. We reported this allowing for multiple admissions during follow-up (ie, adding the length of stay for each separate hospital admission) and we also calculated this restricting to the first hospital admission.
Post hoc, we examined the proportion of individuals who had high acute health care utilization during the study period. Specifically, we examined the proportion of individuals who had more than 5 emergency department visits per person-year and more than 4 all-cause hospital admissions (including elective procedures) per person-year. These cutoffs were selected as they were considered to represent substantial health care resource consumption by clinical experts.
Results
Baseline Characteristics
We included 25 379 individuals receiving in-center hemodialysis and 101 516 individuals in the general population, matching 4 individuals from the general population to each patient receiving dialysis (Figure 1).
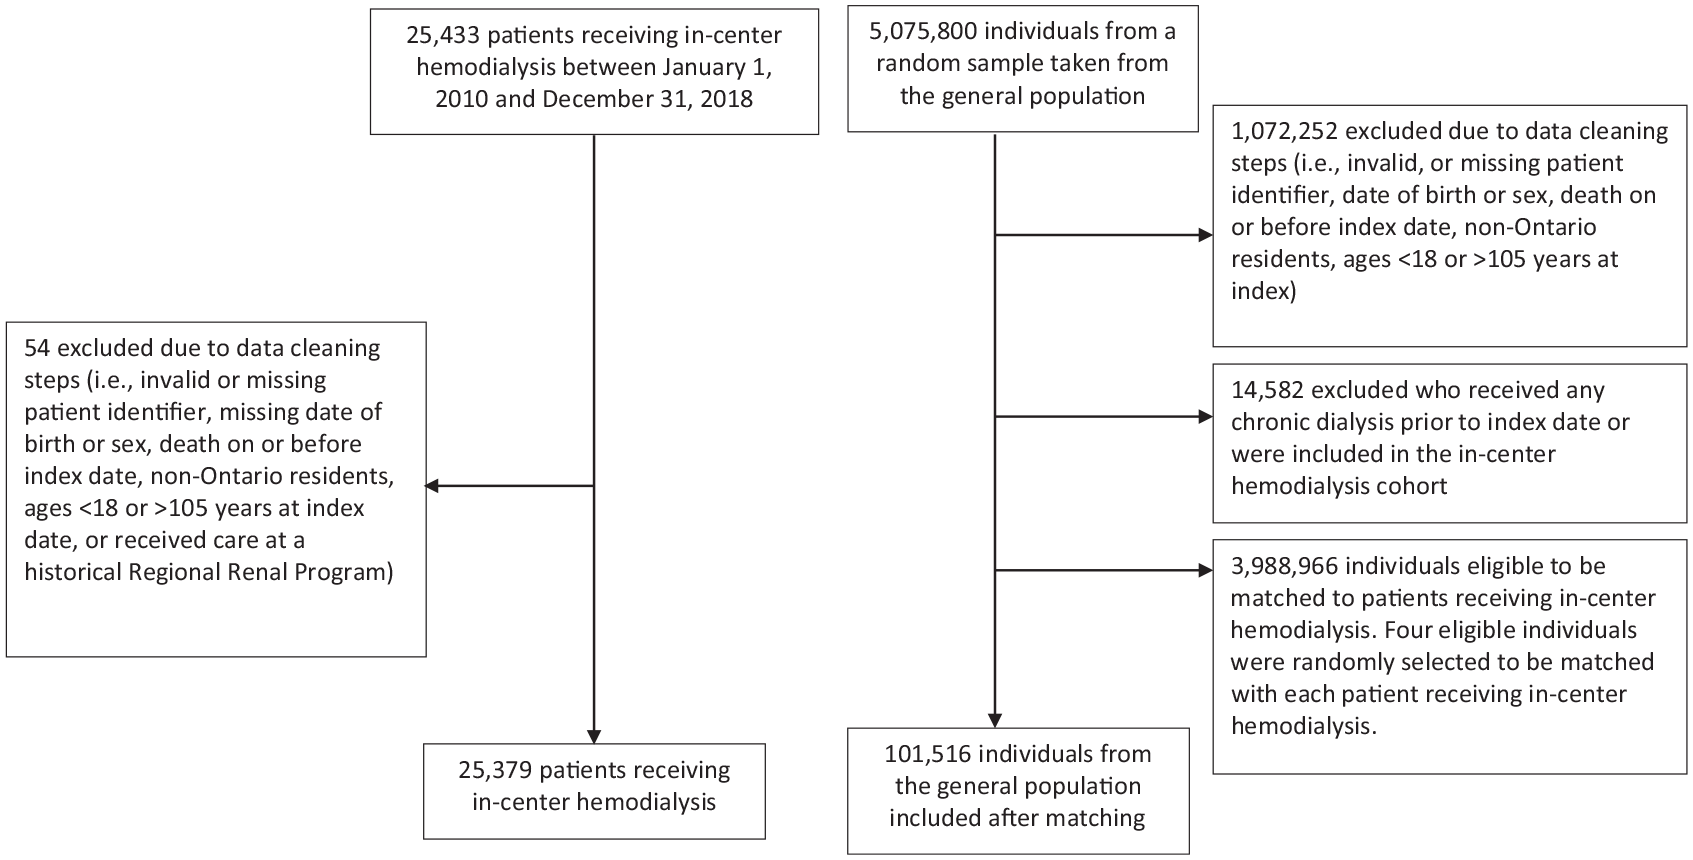
Flow diagram of the in-center hemodialysis cohort and matched general population.
Baseline characteristics for the in-center hemodialysis and the matched general population are presented in Table 1. Compared with the matched general population, patients receiving in-center hemodialysis were more likely to live in the lowest neighborhood income quintile (28.3% vs 19.6%) and more likely to live in long-term care (6.8% vs 2.0%). Patients receiving in-center hemodialysis also had substantially higher previous health care utilization and substantially more comorbidities compared with the matched general population. The most common cause of end-stage kidney disease in the in-center dialysis population was diabetes (38%) (Table 2).
Baseline Characteristics of Individuals Receiving In-Center Hemodialysis Compared With the Matched General Population.

Note. Data are presented as n (%) or median (25th, 75th percentiles).
Standardized differences are used as an index to measure the discrepancy between 2 groups and is independent of sample size. Bold font indicates a difference of >10%, which was considered to be a meaningful difference.
Missing imputed as urban for urban residence.
Neighborhood income and marginalization subscale indices categorized into quintiles. For the marginalization indices, there were 535 individuals in the in-center hemodialysis population with missing data and 835 individuals in the matched general population; these individuals were not included in the marginalization indices. The Ontario Community Health Profiles Partnership is the source of the marginalization indices.
All baseline comorbidities were assessed 5 years prior to index date unless otherwise indicated.
The Charlson comorbidity index is a method of predicting mortality and resource use based on categories of patient comorbidities identified in administrative data. This index was assessed in the 3 years prior to index date.
A diagnosis of diabetes could occur at any time prior to the index date and was defined as 2 Ontario Health Insurance Plan (OHIP) codes, 1 medication drug claim for diabetes, or 1 hospital admission for diabetes within 1 year.
A diagnosis of hypertension could occur at any time prior to the index date and was defined as 1 hospital admission with a hypertension diagnosis or an OHIP claim for a hypertension diagnosis followed by another OHIP claim or a hospital admission with evidence of a hypertension diagnosis within the 2 years of an OHIP diagnosis code for hypertension.
Major cancers included: skin, mouth (lip, tonsils, etc), throat, stomach, small/large intestine, liver, gall bladder, pancreas, breast, reproductive organs, heart, lung, bone, urinary system (kidney, bladder, etc), endocrine glands, leukemias, and lymphomas.
Additional Baseline Characteristics for the In-Center Hemodialysis Cohort.

Note. Data are presented as n (%) or median (25th, 75th percentiles).
Includes both inpatient and outpatient nephrology visits.
Over a median follow-up of 1.8 years, 11 452 (45%) patients receiving in-center hemodialysis died, 2729 (10.8%) received a kidney transplant, 392 (1.5%) left the province, 479 (1.9%) were alive but no longer receiving dialysis, and 3921 (15.5%) switched dialysis modalities. In the matched general population (median follow-up 5.2 years), 14 420 (14.2%) died, and 67 (0.07%) received a kidney transplant or initiated maintenance dialysis during follow-up.
Emergency Department Visits
Eighty percent (n = 20 309) of patients receiving in-center hemodialysis had at least 1 emergency department visit with a median of 3 (1, 7) visits per person and an incidence rate of 2274 visits per 1000 person-years (95% CI: 2263, 2286) (allowing for multiple visits per individual). In comparison, 56% (n = 56 452) in the matched general population had at least 1 emergency department visit with a median of 1 (0, 3) visit per person and an incidence rate of 471 visits per 1000 person-years (95% CI: 469, 473) (Table 3). When examining the incidence rate of emergency department visits in patients receiving in-center hemodialysis stratified by incident versus prevalent status at cohort entry, incident patients had a higher rate of visits per 1000 person-years (2373; 95% CI: 2358, 2388) compared with prevalent patients (2102; 95% CI 2083, 2121) (Supplementary Table S3). When examining the proportion of individuals who had more than 5 emergency department visits per person-year, we found 17.7% (n=4483) of individuals receiving in-center hemodialysis met this criterion compared with 1.6% (n=1648) of matched individuals from the general population.
Emergency Department Visits and All-Cause Hospitalizations in the In-Center Hemodialysis population Compared With the General Population Matched on Birth Date, Sex, and Index Date.
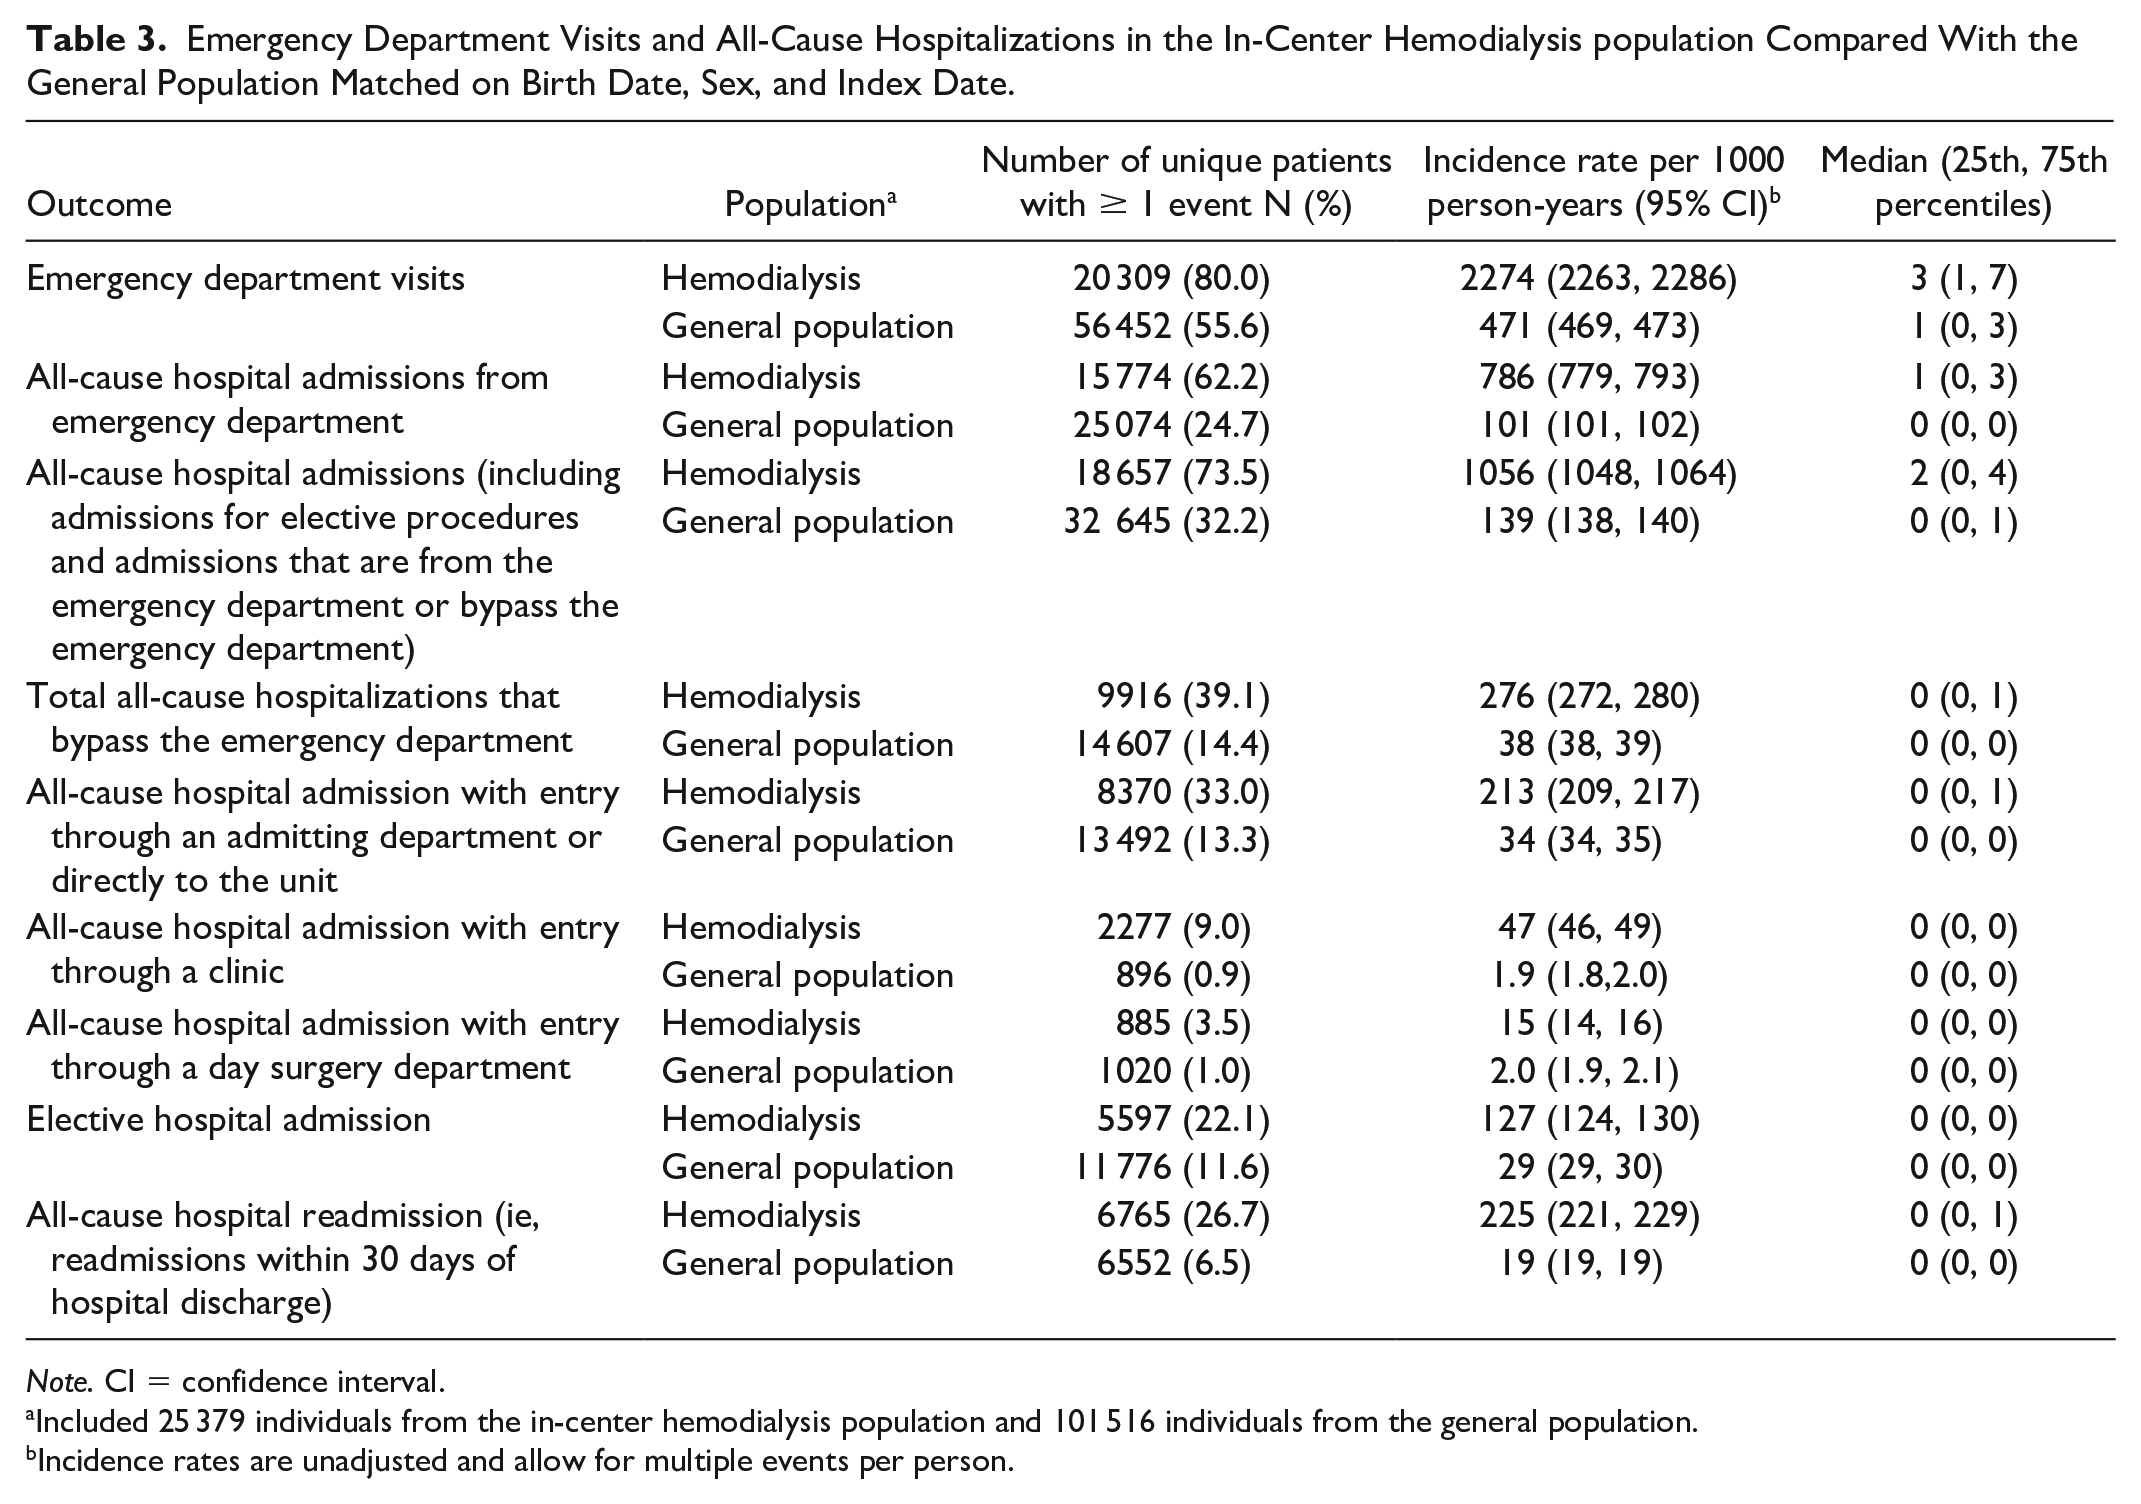
Note. CI = confidence interval.
Included 25 379 individuals from the in-center hemodialysis population and 101 516 individuals from the general population.
Incidence rates are unadjusted and allow for multiple events per person.
All-Cause Hospitalizations From the Emergency Department
Sixty-two percent of individuals receiving in-center hemodialysis had at least 1 all-cause hospital admission from the emergency department compared with 25% in the matched general population. The rate of hospital admissions from the emergency department in the in-center hemodialysis population was more than 7 times as high as the matched general population (786 [95% CI: 779, 793] vs 101 per 1000 person-years [95% CI: 101, 102]) (Table 3). In the in-center hemodialysis population, 36.3% of all emergency department visits ended up with a transfer to an inpatient hospital admission compared with 22.2% of visits in the matched general population. The median length of stay when including all-cause hospital admissions from the emergency department was 18 days (7, 44) in the in-center hemodialysis population versus 10 days (4, 26) in the matched general population. When restricting to the first hospitalization episode the median length of stay was similar in both groups with a median stay of 5 days (2, 12) in the in-center hemodialysis population and 5 days (2, 10) in the matched general population.
All-Cause Hospitalization (Including Admissions for Elective Procedures and Admissions That Are From the Emergency Department or Bypass the Emergency Department)
Seventy-four percent of individuals receiving in-center hemodialysis had at least 1 all-cause hospital admission compared with 32% of the matched general population with the rate of hospital admissions in the hemodialysis population more than 7 times as high as the general population. When examining the proportion of individuals who had more than 4 all-cause hospitalizations per person-year, we found 11.0% (n=2801) of individuals receiving in-center hemodialysis met this criterion compared with 0.8% (n=823) matched individuals from the general population. The median and mean number of all-cause hospitalization days per patient year was 4.0 (0, 16.5) and 16.3 ± 33.9 in the in-center hemodialysis population, respectively, compared with 0 (0, 0.5) and 2.2 ± 11.1 in the matched general population.
All-Cause Hospitalizations That Bypass the Emergency Department
During follow-up, 39% of the in-center hemodialysis population had at least one hospitalization that bypassed the emergency department (Table 3) compared with 14% in the matched general population group with an incidence rate in the in-center hemodialysis population more than 7 times as high as the matched general population (276 vs 38 per 1000 person-years).
Method of Entry Into the Hospital
When examining method of entry (allowing for multiple visits per individual), in the in-center hemodialysis population, the greatest proportion of all-cause hospital admissions came from the emergency department (74.0%), followed by directly from the admitting department (20.1%), directly from a hemodialysis unit or medical clinic (4.5%), and day surgery (1.4%) (Figure 2A). Similarly, in the general population the greatest proportion of all-cause hospital admissions came from the emergency department (72.7%), with a smaller degree coming directly from a medical clinic (1.3%) (Figure 2B).

Method of entry into the hospital (ie, the last entry point prior to being admitted as an inpatient).
Other Outcomes
In the in-center hemodialysis population 22.1% had at least one elective admission compared with 11.6% in the general population. Over one quarter (27%) of the in-center hemodialysis group had at least 1 all-cause readmission (ie, readmission within 30 days of being discharged from the original hospitalization) in follow-up with an incidence rate of 225 per 1000 person-years (95% CI: 221, 229), which is roughly 12 times that observed in the matched general population (Table 3).
Costs
For all-cause hospitalization (including hospitalization for elective procedures) the total cost over follow-up was over CAN$ 1 billion (CAN$ 1 357 347 438) for the in-center hemodialysis population. The cost per person-year in the dialysis population was approximately 11 times as high as the general population (CAN$ 21 151 per person-year vs CAN$ 1873 per person-year). For emergency department visits the total cost for the in-center hemodialysis population was CAN$ 73 909 686, while the cost per person-year was CAN$ 1153 in the in-center hemodialysis population compared with CAN$ 209 per person-year in the general population.
Discussion
In this study, we found that patients receiving in-center hemodialysis had high acute health care utilization with a substantially higher incidence and cost of emergency department visits and hospitalizations compared with a matched general population. These findings highlight the high burden of disease in the in-center hemodialysis population and the need to test and develop strategies to reduce acute health care utilization.
Our findings are consistent with previous studies.4,6-10 For example, a study conducted in Manitoba, Canada found patients receiving maintenance dialysis (ie, in-center hemodialysis, peritoneal, and home dialysis) visited the emergency department more than eight-times as frequently compared with the general population, a statistically significant difference after adjusting for age and sex. 6 This was slightly higher than our Ontario patients receiving in-center hemodialysis where the rate of emergency department visits was almost 5 times as high as the general population. Unlike previous publications, our study provided detailed information on multiple aspects of acute health care utilization (eg, categorizing hospitalizations by method of entry). We found that patients receiving in-center hemodialysis had substantially higher rates of all hospitalization types, including elective hospitalizations and hospital readmissions. This allowed for a more complete understanding of acute health care use in patients receiving in-center hemodialysis.
Our rate of all-cause hospitalization was lower than what has been found in the United States. For example, we found a rate of all-cause hospitalization in the in-center hemodialysis population of 1.06 hospitalizations per person-year while the United States found a rate of 1.6 per person-year. 24 It is important to note that the US rate only included acute hospitalizations, while we also included hospitalizations for elective surgeries. The US hospitalization rate also only included patients covered by Medicare, which may represent a slightly different patient population.
The large number of emergency department visits and hospitalizations in the in-center hemodialysis population are concerning. In 2014, patients receiving dialysis accounted for more than 1.1% of the total health expenditures in Canada (approximately $2.28 billion per year [value updated to 2021 CAN$] excluding Quebec) despite only making up 0.08% of the Canadian population; these costs have undoubtedly increased, with more Canadians requiring dialysis. 4 Similarly, in the United States, Medicare expenditures are over $35.9 billion per year and account for over 7% of all Medicare spending. 25 In our study, we found that the cost of hospitalization per person-year in the in-center hemodialysis population was approximately 11 times as high as the general population (CAN$ 21 151 vs CAN$ 1873). The total cost of hospitalizations in the 25 379 in-center hemodialysis patients in our study (median follow-up, 1.8 years) was over CAN$ 1.3 billion. It is important to note that these costs do not include many of the other dialysis costs, including the cost of in-center hemodialysis itself (eg, equipment, overhead, staff) and the cost of medications and physician services. It has been estimated that dialysis costs the health care system close to $100 000 per patient year, 26 with hospital admissions often the second-largest cost for these patients after the dialysis treatment itself. 27 In Ontario, there are approximately 12 000 individuals currently receiving maintenance dialysis 28 (representing one-third of patients receiving hemodialysis in Canada), resulting in over CAN$ 1.2 billion in total health care costs for dialysis per year in Ontario. This highlights the need for capacity planning to anticipate the increased number of hospitalizations in this growing population and the urgent need for strategies to decrease acute health care utilization.
Several strategies have been proposed to reduce acute health care utilization in the dialysis population. Of note, before many of these strategies can be implemented an understanding of the most common causes of admissions is required. First, similar to what was done in the United States, Canadian provinces and territories could form a task force responsible for monitoring, reporting and reducing hospitalizations among patients receiving maintenance dialysis with a focus on preventable visits (ie, infection, vascular access-related). 29 Second, in the general population numerous interventions (eg, home visits and telephone follow-up) have been found to be effective in reducing the risk of early hospital readmission 30 ; interventions applied to the general population could be adopted, and validated in the dialysis population. 31 In the chronic obstructive pulmonary disease population, a program that provides patients and their families with supports to improve the management of their disease at home resulted in a reduction in hospital admissions by 80%. 32 Third, there needs to be a continued focus on increasing the number of patients receiving home dialysis. A previous report found that patients who received home dialysis treatments had a significantly lower risk of all-cause hospitalization compared with patients who received dialysis at a facility; however, results should be interpreted cautiously, as patients receiving home hemodialysis are often healthier, potentially resulting in fewer hospitalizations. 4 Fourth, for patients who are transplant eligible, reducing the amount of time it takes to get a transplant may reduce dialysis-associated hospitalizations. Fifth, other components of dialysis care may need to be further examined, such as interdialytic time,6,8 dialysis schedule, 8 early pre-dialysis care access,7,33 increased monitoring by health care professionals, infection control strategies related to dialysis access,34,35 remote patient monitoring, 10 and multispecialty care coordination. 36 Sixth, predictive analytics (eg, machine learning) could be used to identify patients at high risk for hospitalization, allowing physicians to preemptively intervene to prevent these patients from being hospitalized.37,38 Seventh, patients receiving in-center hemodialysis commonly require urgent hemodialysis treatments due to fluid overload or high potassium levels and are subsequently sent to the emergency department if the hemodialysis clinic is not open (eg, weekend closures). The development of methods for these patients to receive care without having to go to the emergency department might reduce the number of visits. Finally, a focus on strategies to prevent or delay the progression to kidney failure is needed (eg, lifestyle modifications, medications).39,40
There are several limitations that should be considered. First, we only matched the in-center hemodialysis population to the general population on age, sex and cohort entry date. There are many other factors that drive differences in emergency department visits and hospital admissions that were not measured. For example, in our study the prevalence of several comorbidities (eg, diabetes) were substantially higher in the in-center hemodialysis population compared with the general population. However, controlling for differences in comorbidities would diminish the magnitude of disparity between the 2 groups making it appear that the rate of acute health care utilization is more similar between the 2 populations, potentially leading to the incorrect conclusion that equivalent resources are needed for both populations. 41 Nonetheless, future research to address the risk of hospitalization after controlling for patient comorbidities would be beneficial. Second, our results may not be generalizable outside of Ontario or to different dialysis modalities (eg, home hemodialysis or peritoneal dialysis). Finally, we could not accurately determine the reasons for emergency department visits and hospitalizations, including whether they were preventable, as detailed clinical data would be required. Future work may benefit from examining ambulatory care sensitive conditions (ie, conditions, such as diabetes, where appropriate ambulatory care avoids or decreases hospital admission) in the dialysis population. 42
This population-based study highlights the high rate and cost of acute health care utilization in patients receiving in-center hemodialysis, with substantially more use compared with the general population. The results of this study are a call to develop and test interventions to reduce acute health care use in the in-center hemodialysis population. These results also highlight the need for health care capacity planning to fund this growing population.
Supplemental Material
sj-docx-1-cjk-10.1177_20543581241231426 – Supplemental material for Comparison of Acute Health Care Utilization Between Patients Receiving In-Center Hemodialysis and the General Population: A Population-Based Matched Cohort Study From Ontario, Canada
Supplemental material, sj-docx-1-cjk-10.1177_20543581241231426 for Comparison of Acute Health Care Utilization Between Patients Receiving In-Center Hemodialysis and the General Population: A Population-Based Matched Cohort Study From Ontario, Canada by Kyla L. Naylor, Marlee Vinegar, Peter G. Blake, Sarah Bota, Bin Luo, Amit X. Garg, Jane Ip, Angie Yeung, Joanie Gingras, Anas Aziz, Carina Iskander and Phil McFarlane in Canadian Journal of Kidney Health and Disease
Footnotes
Acknowledgements
This study was supported by ICES, which is funded by an annual grant from the Ontario Ministry of Health (MOH) and the Ministry of Long-Term Care (MLTC). The study was completed at the ICES Western site. This document used data adapted from the Statistics Canada Postal CodeOM Conversion File, which is based on data licensed from Canada Post Corporation, and/or data adapted from the Ontario Ministry of Health Postal Code Conversion File, which contains data copied under license from ©Canada Post Corporation and Statistics Canada. Parts of this material are based on data and/or information compiled and provided by CIHI and the Ontario Ministry of Health. The analyses, conclusions, opinions, and statements expressed herein are solely those of the authors and do not reflect those of the funding or data sources; no endorsement is intended or should be inferred. Parts of this material are based on data and information provided by Ontario Health (OH). The opinions, results, view, and conclusions reported in this paper are those of the authors and do not necessarily reflect those of OH. No endorsement by OH is intended or should be inferred. We thank the Toronto Community Health Profiles Partnership for providing access to the Ontario Marginalization Index. We thank ORN for their content advice, including Doneal Thomas and Yiwen Tang.
Ethics Approval and Consent to Participate
ICES is a designated prescribed entity under Section 45 of the Personal Health Information Protection Act (PHIPA). Section 45 authorizes ICES to collect personal health information, without consent, for the purpose of analysis or compiling statistical information with respect to the management, evaluation, or monitoring of the allocation of resources to or planning for all or part of the health system. Projects conducted under section 45, by definition, do not require review by a Research Ethics Board. This project was conducted under section 45 and approved by ICES’ Privacy and Compliance Office. Participant informed consent was not required for this study.
Consent for Publication
All authors consent to the publication of this study.
Availability of Data and Materials
The data set from this study is held securely in coded form at ICES. While legal data sharing agreements between ICES and data providers (eg, health care organizations and government) prohibit ICES from making the data set publicly available, access may be granted to those who meet pre-specified criteria for confidential access, available at ![]() (email:
(email:
Author Contributions
Research idea and study design: A.X.G., P.M., and P.G.B.; data acquisition: B.L. and S.B.; data analysis/interpretation: B.L., S.B., K.L.N., P.G.B, P.M., and M.V.; statistical analysis: B.L.; drafting of initial manuscript: K.L.N and M.V. Each author contributed important intellectual content during manuscript drafting or revision, accepts personal accountability for the author’s own contributions, and agrees to ensure that questions pertaining to the accuracy or integrity of any portion of the work are appropriately investigated and resolved.
Declaration of Conflicting Interests
The author(s) declared no potential conflicts of interest with respect to the research, authorship, and/or publication of this article.
Funding
The author(s) disclosed receipt of the following financial support for the research, authorship, and/or publication of this article: This study was conducted with funding and the support of the Ontario Renal Network (ORN), a division of Ontario Health (OH). The opinions, results, view, and conclusions reported in this paper are those of the authors and do not necessarily reflect those of OH. No endorsement by OH is intended or should be inferred.
Supplemental Material
Supplemental material for this article is available online.
References
Supplementary Material
Please find the following supplemental material available below.
For Open Access articles published under a Creative Commons License, all supplemental material carries the same license as the article it is associated with.
For non-Open Access articles published, all supplemental material carries a non-exclusive license, and permission requests for re-use of supplemental material or any part of supplemental material shall be sent directly to the copyright owner as specified in the copyright notice associated with the article.