
Abstract
Background:
At the time a kidney offer is made by an organ donation organization (ODO), transplant physicians must inform candidates on the pros and cons of accepting or declining the offer. Although physicians have a general idea of expected wait time to kidney transplantation by blood group in their ODO, there are no tools that provide quantitative estimates based on the allocation score used and donor/candidate characteristics. This limits the shared decision-making process at the time of kidney offer as (1) the consequences of declining an offer in terms of wait-time prolongation cannot be provided and (2) the quality of the current offer cannot be compared with that of offers that could be made to the specific candidate in the future. This is especially relevant to older transplant candidates as many ODOs use some form of utility matching in their allocation score.
Objective:
We aimed to develop a novel method to provide personalized estimates of wait time to next offer and quality of future offers for kidney transplant candidates if they refused a current deceased donor offer from an ODO.
Design:
A retrospective cohort study.
Setting:
Administrative data from Transplant Quebec.
Patients:
All patients who were actively registered on the kidney transplant wait list at any point between March 29, 2012 and December 13, 2017.
Measurements:
The time to next offer was defined as the number of days between the time of the current offer and the next offer if the current one were declined. The quality of the offers was measured with the 10-variable Kidney Donor Risk Index (KDRI) equation.
Methods:
Candidate-specific kidney offer arrival was modeled with a marked Poisson process. To derive the lambda parameter for the marked Poisson process for each candidate, the arrival of donors was examined in the 2 years prior to the time of the current offer. The Transplant Quebec allocation score was calculated for each ABO-compatible offer with the characteristics that the candidate presented at the time of the current offer. Offers where the candidate’s score was lower than the scores of actual recipients of the second kidneys transplanted were filtered out from the candidate-specific kidney offer arrival. The KDRIs of offers that remained were averaged to provide an estimate of the quality of future offers, to be compared with that of the current offer.
Results:
During the study period, there were 848 unique donors and 1696 transplant candidates actively registered. The models provide the following information: average time to next offer, time to which there is a 95% probability of receiving a next offer, average KDRI of future offers. The C-index of the model was 0.72. When compared with providing average group estimates of wait time and KDRI of future offers, the model reduced the root-mean-square error in the predicted time to next offer from 137 to 84 days and that of predicted KDRI of future offers from 0.64 to 0.55. The precision of the model’s predictions was higher when observed times to next offer were 5 months or less.
Limitations:
The models assume that patients declining an offer remain wait-listed until the next one. The model only updates wait time every year after the time of an offer and not in a continuous fashion.
Conclusion:
By providing personalized quantitative estimates of time to and quality of future offers, our new approach can inform the shared decision-making process between transplant candidates and physicians when a kidney offer from a deceased donor is made by an ODO.
Introduction
Kidney transplantation is considered the best renal replacement therapy, improving both longevity and quality of life when compared with dialysis,1,2 and reducing overall health care costs for chronic kidney disease. 1 Between 60% and 70% of kidney transplantations in Canada originate from deceased donors. 3 The important and rising gap between organs available and organs needed for kidney transplantation results in more than 3400 Canadians waiting for a kidney. 3 In Canada, provincial organ donation organizations (ODOs) allocate deceased donor kidneys available for transplantation to transplant candidates through scores that combine elements of justice and utility. 4 Using a model of shared decision-making, 5 the final decision to accept or refuse an organ offered must then be made by the transplant physician and the candidate to achieve the most appropriate outcome for each individual patient after their health professional has conveyed the relevant information to make that decision.
Although many statistical and machine learning models based on donor and recipient characteristics have been developed to predict kidney graft survival if an offer is accepted,6,7 the decision to accept or decline an offer is also heavily affected by the potential consequences of declining an organ. If a kidney offer is declined, the intended recipient will remain on dialysis until a next offer comes. However, longer wait time on dialysis before transplantation is associated with poorer graft and patient survival after transplantation. 8 Hence, choosing to decline an offer can be beneficial, but only if an offer of better quality is expected to occur in a relatively short time frame. Many ODOs include some elements of utility in their allocation score, such as points for age matching between kidney donors and kidney transplant candidates 9 or points for candidate life expectancy/donor quality matching. 10 This results in older and/or sicker transplant candidates having a lower probability of being offered kidneys from ideal donors. Hence, providing information to transplant candidates on the wait time to next offer if a current one is declined and on the expected quality of future kidneys that could be offered to the candidate (vs the quality of the current one) is crucial in helping transplant physicians and candidates making the decision to accept or decline the current offer. Our group has conducted qualitative research with focus groups of kidney transplant recipients and candidates to evaluate their perspectives on the decision to accept or decline an offer. Patients often felt ill-prepared to make that decision and the consequences of declining an offer on wait-time prolongation was one of the important information required to facilitate the decision-making process in their opinion. 11
Hence, the aims of this study were to develop a statistical method to provide personalized estimates of wait time to next offer if a current one is declined, estimate the average quality of kidney offers that could be proposed to the candidate, and illustrate our approach through information provided by the model in real examples.
Methods
We performed a retrospective cohort study on the administrative data set of Transplant Quebec, the ODO managing and allocating kidneys of deceased donors for the province of Quebec, Canada. Data on all deceased donor kidney offers that occurred between March 29, 2012 and December 13, 2017 were retrieved, as well as data on all kidney transplant candidates that were actively registered on the wait list at any time point during the study period. We excluded offers that went to medical emergencies, to the highly sensitized national program, to pediatric recipients, those that were transplanted outside of Quebec, as well as those that went to simultaneous combined organ transplants (ie, liver-kidney or kidney-pancreas transplantations). Hence, all kidneys in this study were offered using the Transplant Quebec allocation score. The allocation score for the province of Quebec (Table 1) includes elements of justice (wait time on dialysis, points for higher calculated panel reactive antibodies [cPRA]) and utility (points for younger recipient age, for donor-recipient human leukocyte antigen [HLA] and age match).
Kidney Allocation Score Used By Transplant Québec, 2012-2017.

Note. HLA = human leukocyte antigen.
The 2 primary outcomes were the estimated time to the next kidney offer if the current offer were declined and the expected quality of the next kidneys that might, in the future, be offered to the transplant candidate who declined the current offer. The time to next offer was defined as the number of days between the time of the current offer (T0) and the next offer if the current one were declined. The quality of the offers was measured with the 10-variable Kidney Donor Risk Index (KDRI) equation, 12 which has been validated in Canadian kidney transplant recipients. 13
We proceeded with the following approach (Figure 1). First, the arrival of donors was examined in the 2 years prior to T0 for a particular candidate (C0) to derive λ, the candidate-specific rate of kidney offer arrival to be used in the Poisson process. The Transplant Quebec allocation score (Table 1) was then calculated for C0 (with the characteristics that he/she presented at T0, eg, wait time on dialysis, age) and all ABO-compatible donors that presented in the 2 years prior to T0. Then, the score obtained by C0 for each past offer was compared with the score of the actual recipient of the second kidney from the same donor that was placed. Offers where C0’s score were lower than the scores of actual recipients of the second kidneys transplanted were filtered out from the candidate-specific kidney offer arrival, as they would have not been proposed to C0. An update in C0’s allocation score for the donors arriving in the 2 years prior to T0 was then made for each year passed after T0, to account for the increase in C0’s age and wait time on dialysis. This changes the allocation score and results in having more donors retained in the candidate-specific kidney offer arrival history as time goes on. A correction for cPRA was included to account for a lower probability of encountering offers in patients who have elevated levels of preformed anti-HLA antibodies, which results in wait-time prolongation for hypersensitized patients. The KDRIs of offers that remained in the candidate-specific kidney offer arrival history were averaged to provide an estimate of the quality of future offers, to be compared with that of the current offer. The KDRI can be converted to Kidney Donor Profile Index (KDPI) by recentering it around the distribution of donors used in any given year and expressing it in percentiles of that distribution, with higher percentiles reflecting lower donor quality. 12 Here, we provide examples for 5 offers that took place during the study period. These offers were selected to illustrate the model’s predictions when candidate wait time is short versus long. We report the raw KDRI value (ie, not divided by the median value of the distribution) for the actual offer and the model-based estimates of the average KDRI of future offers. We then provide KDPI values regarding the KDRI of deceased donor kidneys that were transplanted in the province of Quebec in 2015.
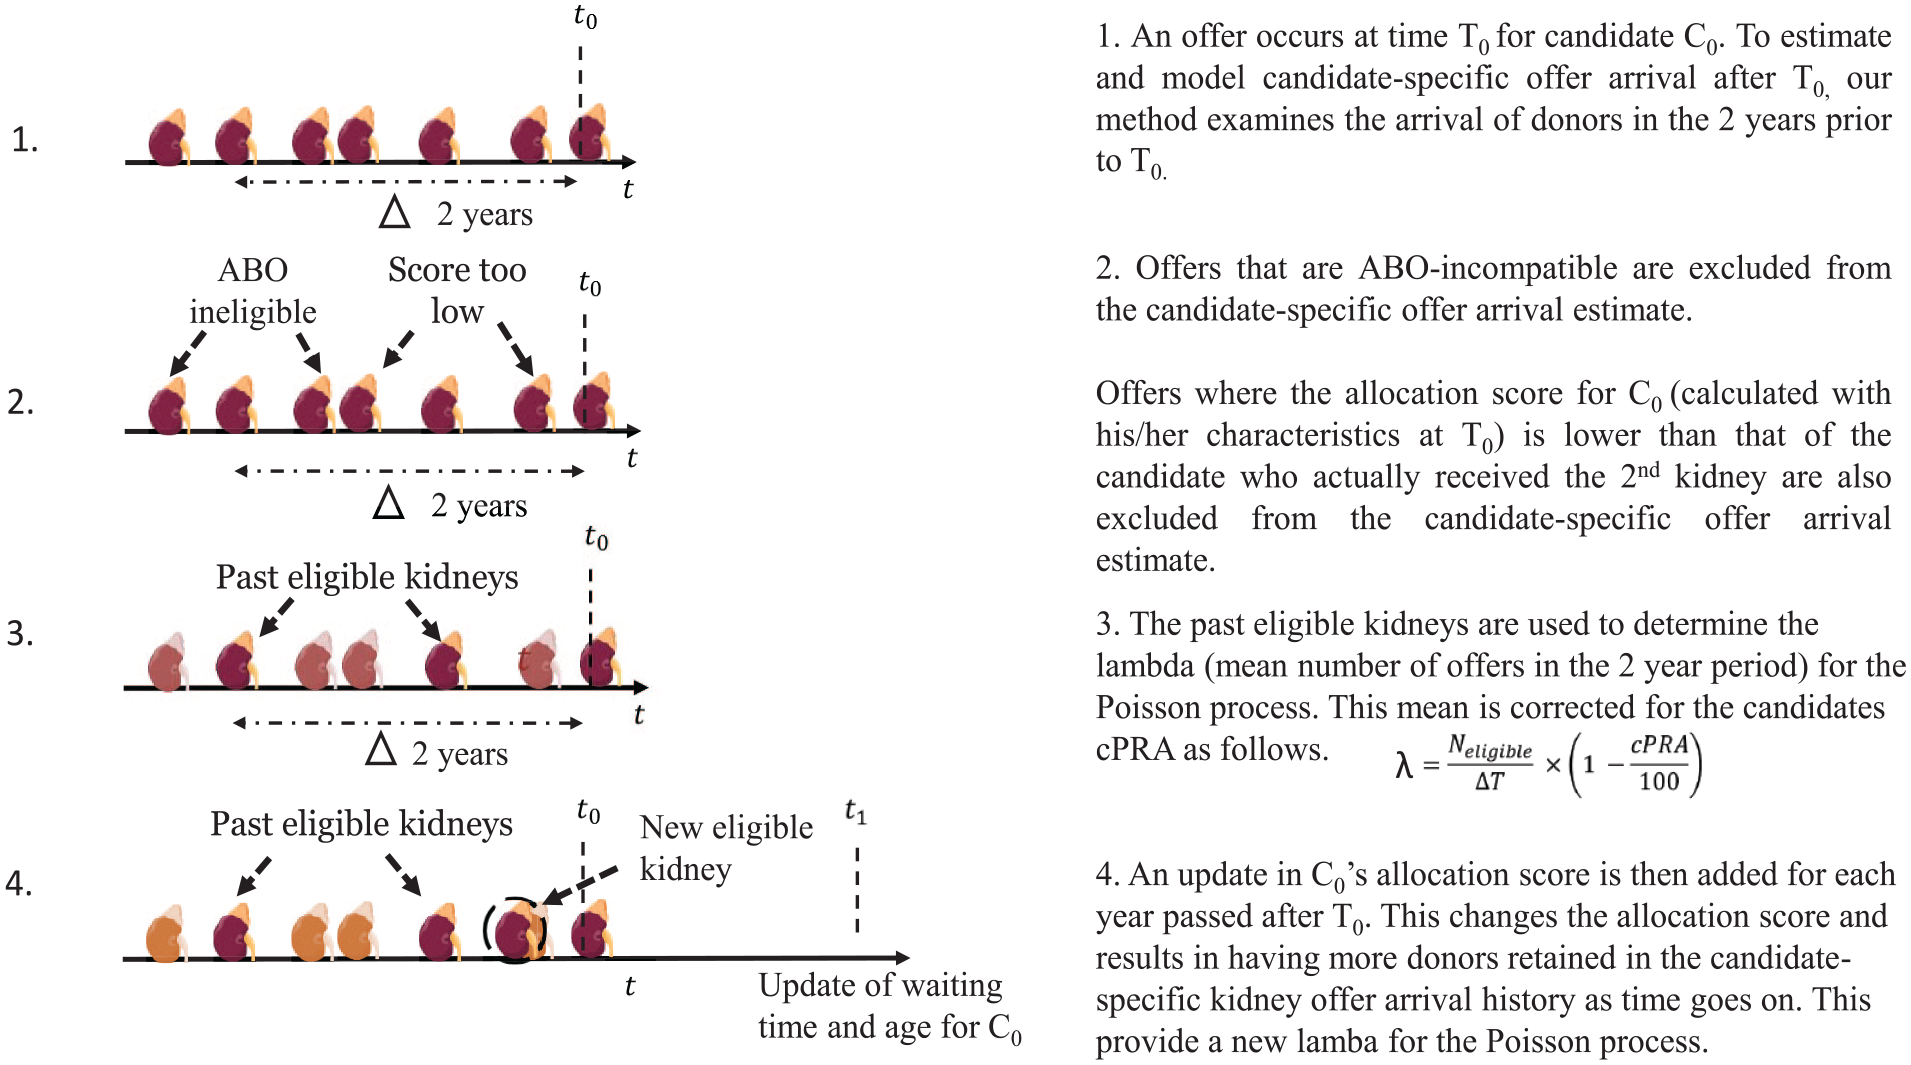
Approach used to estimate and model candidate-specific kidney offer arrival and time to next offer if an offer is refused.
The candidate-specific kidney offer arrival (times and qualities) was modeled with a marked Poisson process (MPP) where the ground Poisson process modeled the offer arrival process, and the mark modeled the offer quality. Additional mathematical details and the parameter estimation procedure are described elsewhere. 14 The MPP was tailored for the specific candidate’s characteristics and it was assumed that the process was the same for the future offers. Using the fitted MPP model to the candidate-specific kidney offer arrival, it was possible to estimate the time before the next offer to the candidate and average quality of future offers. We used the C-index and the root-mean-square error (RMSE), which reflects the differences between observed and predicted values, to evaluate prediction accuracy in terms of wait time to next offer and quality of next offers. A lower RMSE for a model shows better predictive accuracy than a higher one. We also examined the precision of predicted times to next offer stratified by the time to observed next offers (ground truth) in the validation set to illustrate the calibration of the model.
Results
After applying the exclusion criteria mentioned above, there were 848 unique deceased donors that led to 1385 kidney transplantations on the general attribution list (Figure 2), representing 90% of the kidney transplantations that were performed in the province of Quebec during the study period. Overall, there were 1696 kidney transplant candidates actively registered on the wait list at any time point during the study period. Candidate and donor characteristics can be found in Table 2. Total wait time to transplantation and time between offers if at least one offer was declined were both higher in candidates with blood groups O or B. Transplant candidates who were registered during the study period had a higher probability of receiving a kidney transplant than of dying or being permanently withdrawn from the wait list (Figure 3). The mean rank of the candidate who received the second kidney from the same donor was 4.78 (SD: 5.97) and the mean minimal score at which a kidney was placed was 10.15 (SD: 4.11).

Flow of kidney offers at Transplant Quebec during the study period.
Characteristics of Kidney Donors and Transplant Candidates.

Note. IQR = interquartile range.
All donors for whom at least 1 kidney was allocated on the general attribution list during the study period.
Relative to the distribution of Kidney Donor Risk Index of donors transplanted in 2015.
Characteristics at the time of wait-list registration except for wait time to transplantation, which is provided for all patients who were transplanted during the study period as the time elapsed between transplantation and the date dialysis was initiated.
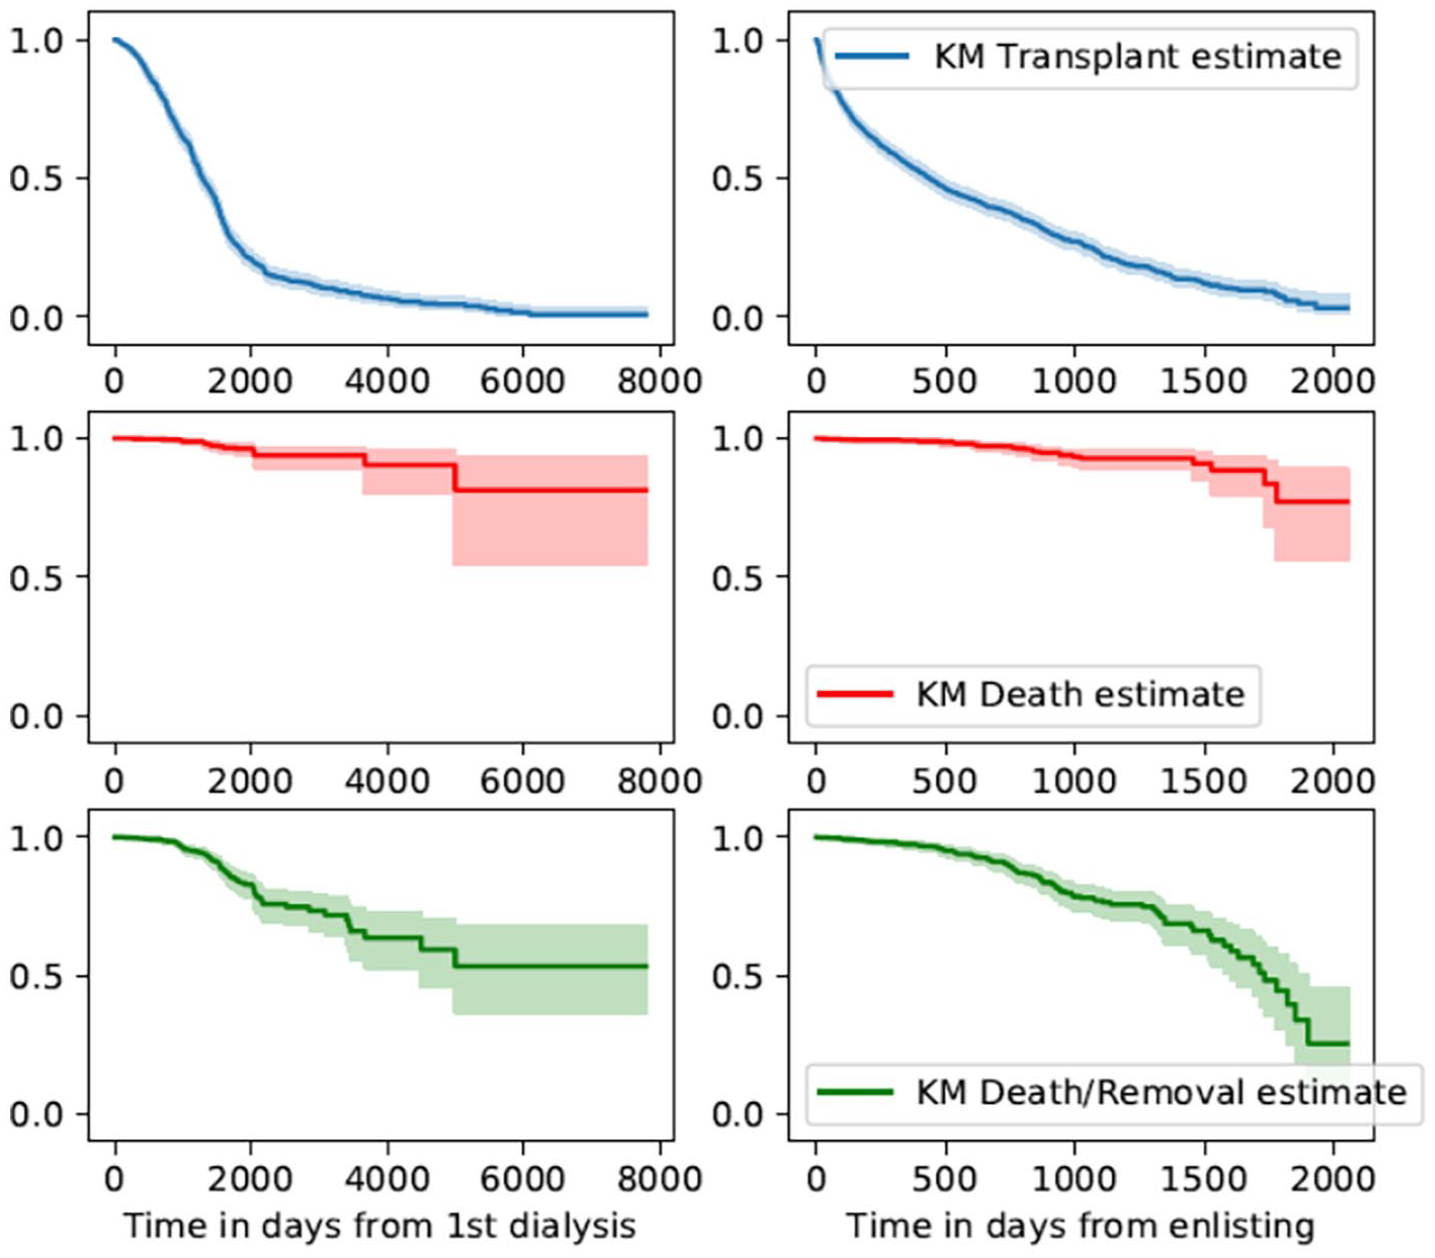
Kaplan-Meier estimates for transplant candidate time to transplantation (upper panels), time to death (middle panels), and time to death or permanent withdrawal from the wait list (lower panels).
Model Validation
We built a training set and a validation set of 712 observations each. Each observation is an individual donor offer that was made to a transplant candidate. A candidate could have multiple offers, each of which would count as a different observation as it came from a different donor. The C-index of the model predicting wait time to next offer on the validation set was 0.72, indicating a relatively good model. Using our proposed approach, the RMSE prediction of wait time to next offer was reduced from 137 to 84 days. This demonstrates that the proposed candidate-specific method is much more accurate in estimating the time to next offer than providing group descriptive statistics. The predicted candidate-specific average quality of future offers using our approach is also more accurate than with the naive method, where the quality is estimated by the average KDRI of all historical offers regardless of the candidate’s characteristics. Using the average KDRI of donors retained in the candidate-specific kidney offer arrival model, the RMSE on the predicted KDRI is 0.55, whereas it is 0.63 for the naive approach. The calibration and precision of the predicted times to next offer vary by the observed length of time between offers. Figure 4 illustrates this by showing that for candidates who had actual observed time to next offer (ground truth, y axis) within 5 months of a declined offer, the average of candidate-specific predicted times and related 95% confidence interval were narrow. Beyond that, the average point estimates of predicted time to next offer were still close to the ground truth but the 95% confidence intervals were wide.

Average candidate-specific predicted times to next offer and 95% confidence intervals stratified by observed times to next offer.
Estimates of Time to Next Offer and Average Quality of Future Offers for Single Patients
To illustrate the information that can be provided by the approach we have developed, we will use the examples of 5 patients in the data set.
Patient 1 is a 64-year-old, blood group AB, nonsensitized man who was on the wait list without having initiated dialysis. He was offered a deceased donor with a KDRI of 2.07 (KDPI: 85%). The mean/median time between offers (group statistic) for patients with blood group AB were 62 and 43 days, respectively. When our approach is used, the model predicts an average wait time of a little over 49 days to the next offer if the current one is declined, with 95% probability of having a next offer within 146 days, and an average KDRI of 1.82 (KDPI: 78%) for future offers. These estimates are derived from 10 eligible donors retained in the candidate-specific kidney donor arrival history. The ground truth is that 210 days after having refused the initial offer, Patient 1 received another offer that had a KDRI of 1.95 (KDPI: 81%) and was accepted.
Patient 2 is a 35-year-old, nonsensitized woman of blood group AB with a 3-month wait time on dialysis. She was offered a deceased donor with a KDRI of 1.52 (KDPI: 44%). When our approach is used, the model predicts an average wait time of a little over 7 months to the next offer if the current one is declined, with 95% probability of having a next offer within 20 months, and an average KDRI of 1.70 (KDPI: 56%) for future offers. These estimates are derived from 4 eligible donors retained in the candidate-specific kidney donor arrival history. The ground truth is that 3.4 months after having refused the initial offer, Patient 2 received an offer that had a KDRI of 1.45 (KDPI: 41%) and was refused.
Patient 3 is a 73-year-old man with a cPRA of 26%, blood group A, who had been on dialysis for 16 months. He was offered a deceased donor with a KDRI of 2.61 (KDPI: 88%). The mean/median time between offers for patients with blood group A were 61 and 29 days, respectively. When our approach is used, the model predicts that the average wait time to next offer is 18 days, with a 95% probability of having a next offer within 51 days. The average KDRI of future offers is 2.28 (KDPI: 82%). These estimates are derived from 54 eligible donors retained in the candidate-specific kidney donor arrival history. The ground truth is that 12 days after having refused the initial offer, Patient 3 received another offer which had a KDRI of 2.18 (KDPI: 80%). This offer was also refused. Patient 3 received another offer with a KDRI of 2.78 (KDPI: 93%) 8 days afterward. This offer was accepted.
Patient 4 is a 66-year-old, nonsensitized blood group A man with a 50-month wait time on dialysis. He was offered a deceased donor with a KDRI of 2.25 (KDPI: 91%). When our approach is used, the model predicts an average wait time of 5 days to the next offer, with a 95% probability of having a next offer within 15 days, and an average KDRI of 1.83 (KDPI: 79%) for future offers. These estimates are derived from 130 eligible donors retained in the candidate-specific kidney donor arrival history. The ground truth is that 2 days after having refused the initial offer, Patient 4 received another offer with a KDRI of 1.79 (KDPI: 76%), which was refused. Within a period of 3 weeks, he received 2 more offers: he refused one with a KDRI of 3.08 (KDPI 100%) and accepted the other (KDRI 1.37, KDPI 53%).
Patient 5 is a 63-year-old, nonsensitized blood group O man with a 74-month wait time on dialysis. He was offered a deceased donor with a KDRI of 3.00 (KDPI: 100%). The mean/median time between offers for patients with blood group O were 80 and 50 days, respectively. When our approach is used, the model predicts an average wait time of 4 days to the next offer, with a 95% probability of having a next offer within 11 days, and an average donor KDRI of 1.75 (KDPI: 72%) for future offers. These estimates are derived from 122 eligible donors retained in the candidate-specific kidney donor arrival history. The ground truth is that 20 days after having refused the initial offer, Patient 5 received an offer that had a KDRI of 1.55 (KDPI: 65%). This offer was accepted.
In all case vignettes except Patient 2, the difference in days between model-based time to next offer estimates and the ground truth (observed times of next offer) were smaller than the differences between the mean/median times between offers for patients of same blood groups and the ground truth. Similarly, in all case vignettes except Patient 2, model-based estimates of the KDPIs of future offers were closer to the ground truth (observed KDPI of future offers) than just providing the median KDPI of all donors transplanted during the study period relative to the 2015 KDRI distribution (ie, 55%). The bad predictions provided for Patient 2 are associated with a low number of donors retained in the candidate-specific kidney donor arrival history for this patient (n = 4), which makes model-based estimates unstable. In contrast, when there is a high number of donors retained in the candidate-specific donor arrival history (eg, Patients 3, 4, and 5), the model-based estimates are closer to the ground truth than group statistics.
Discussion
Here, we have developed a novel method to provide personalized estimates of wait time until the next offer and the average quality of future offers for kidney transplant candidates. This information is crucial for patients and transplant physicians when they commonly decide to accept or decline a kidney for transplantation, as it helps quantifying the consequences of refusing an offer, which can improve the quality of the shared decision-making process. Refusing an offer can have an adverse impact on patients, given the association between longer wait time on dialysis and post-transplant mortality/graft loss and lower quality of life while patients remain on the wait list.1,8 Despite an abundant literature that focuses on predicting kidney graft survival if the offer is accepted,6,7 very few data are available on the adverse consequences of declining a kidney offer or on models that provide a quantitative integration of expected survival with a functioning graft if a current offer is accepted or if it is declined.15,16
In a recent study, Bertsimas et al 16 used a random forest model to predict the probability for a candidate to receive a deceased donor kidney offer of different estimated qualities (based on the KDRI) at various time points. This approach was associated with a very good predictive accuracy (C-statistic = 0.86-0.88). Another group has developed a tool that provides the probabilities of being alive with a functioning graft 3 years after an initial offer if it is either accepted or declined. 15 Last, a model based on decision trees was developed to quantify the pros and cons of accepting or declining offers of various qualities in terms of graft survival. 17 This approach takes into account various options at different time points: accepting or declining a current offer and then future offers of various KDRIs, dying, being withdrawn from the list. These prior studies provide clinically relevant information but have some limitations, for instance, the absence of a readily available web calculator,16,17 survival prediction probabilities provided only for a short-term (3-year) horizon, 15 and differences in allocation scores used and in the characteristics/number of donors and candidates for kidney transplantation in other jurisdictions than the United States.15 -17 Last, a machine learning–based approach to predict wait time to transplantation has recently been described. 18 However, the expected quality of future offers was not provided and the latter is a crucial element to consider when patients must decide if it is worth waiting for a better offer.
Hence, we set out to develop a novel approach to provide personalized estimates of time to next offer and expected quality of future offers. We chose these outcomes as our focus groups with transplant recipients and candidates revealed that patients comprehended the concept of time to an offer better than the probability of an offer at time T, and because this information was deemed very relevant to convey at the time an offer is made by the patients who participated in our focus groups. 11
We provide 5 examples (case vignettes, Table 3) from the data set to demonstrate how the model performs in candidates of different blood groups and wait times. We show that in all but one case, the estimates provided using the model are closer to the ground truth than the estimates transplant physicians could have provided using descriptive group statistics. In the case where the model predictions (expected time to next offer and expected quality of next offers) were further away from the ground truth than just providing group descriptive statistics, the number of donors retained in the candidate-specific kidney donor arrival history was small (n = 4). The number of donors retained in the candidate-specific kidney donor arrival history will be elevated if the high score obtained for the current offer depends on recipient characteristics only (ie, long wait time on dialysis, high cPRA), as those will remain the same when calculating the hypothetical candidate scores for past offers in the 2 years preceding the current one. In contrast, if the high score for the current offer depends on donor characteristics (ie, HLA match, age match), then the hypothetical scores for past offers may be low, resulting in a low number of donors retained in the candidate-specific kidney donor arrival history. As the output of the model can specify the number of donors present in the candidate-specific donor arrival history, physicians can convey to patients an idea of the certainty around predictions, which is very high if there are multiple donors in the candidate-specific donor arrival history (Patients 3, 4, and 5), low when there are very few donors (Patient 2), and moderate otherwise (Patient 1).
Examples of Estimates of Model-Based, Naive, and Ground Truth: Wait Time to Next Offer and Average Quality of Future Offers.

Note. KDRI = Kidney Donor Risk Index; KDPI = Kidney Donor Profile Index.
For candidates of same blood group.
Relative to the distribution of the KDRI of donors transplanted in 2015.
Offer was accepted.
When our approach is used, we suggest to convey the information to transplant candidates who receive an offer as follows: If you refuse the current offer, we expect that on average you will wait x days before receiving another one, and we are 95% certain that it will be before y days. On average, we expect that you will receive offers that are of similar/lower/higher quality than the current one. For instance, for Patient 1 and Patient 3, the model shows that the wait time to next offer is more than a month and that the average predicted KDPI of future offers is only marginally lower than that of the current ones. This suggests that there is little expected benefit in choosing to refuse the current offer. In contrast for Patient 4 and Patient 5, the predicted wait times are very short and the expected KDPIs of future offers are substantially lower than that of the current ones. In this case, the information provided would favor declining the offer. For cases like Patient 2, where a low number of donors are retained in the candidate-specific donor arrival history, we suggest not to use the model to inform patients.
Our approach has many strengths. It provides relevant and easily interpretable information to transplant physicians and patients. It also provides an estimate of the uncertainty around the estimates. It was developed to provide predictions in the province of Quebec, but could be adapted to other ODOs by modifying the allocation score used in the model and having access to the wait list and to the history of offers in other jurisdictions. It was also developed to provide a prediction of future offers if an initial one is declined but can also provide a personalized estimate of time to next offer at any time point if the candidate is wait-listed, a query that is often asked by the patient. Our study also has some limitations. Because our initial data set comprised only 5 years, the candidate-specific kidney donor arrival history sometimes comprised few offers, which could diminish the precision of predicted estimates of the average quality of next offers. We plan to conduct future studies to validate the model with more recent data from Transplant Quebec and prospectively as well. Our estimates also assume that patients declining an offer remain wait-listed until the next one. While the survival data we presented suggest that this is reasonable, we plan to perform future studies to integrate the possibility of death and/or withdrawal from the wait list. Last, the correction in predicted wait time for high cPRA was made assuming a linear relationship between cPRA and probability of finding a suitable donor. In future studies, we will verify whether the precision of our estimates varies according to sensitization status.
Conclusions
In conclusion, shared decision-making between transplant candidates and physicians has been hampered by the lack of reliable quantitative data on the outcomes associated with different options such as accepting or declining a kidney offer. Here, we have developed a new approach that will help transplant physician inform their patients by providing personalized estimates of wait time to the next offer and average quality of future offers. This is of particular relevance as up to 50% of kidneys recovered for transplantation and having KDPI of 80% to 100% are discarded. 19 Our approach, by providing better personalized estimates of the expected quality of future offers for a given transplant candidate, has the potential to increase the use of high KDRI donors. If candidates understand that the current offer is of similar quality as the expected average quality of future offers, they may be more likely to accept it. In turn, this could increase the number of kidney transplantations performed, enhancing both life expectancy and quality of life for Canadians suffering from end-stage kidney disease, while saving costs to the Canadian health system.
Footnotes
Author Contributions
All authors agree with the content of the manuscript and have made substantial contributions to the work; J.J., J.-N.W., A.L., and H.C. participated in research design, and J.J., J.-N.W., M.T., S.L., M.P., A.L., and H.C. participated in the performance of the research. J.J., J.-N.W., M.T., P.-L.B., and A.L. participated in data analysis and new analytic tools. J.J., J.-N.W., S.L., M.T., M.P., A.L., and H.C.in the writing of the paper. All authors provided critical feedback and helped shape the research, analysis, and manuscript.
Ethics Approval and Consent to Participate
The project was approved by the Centre hospitalier de l’Université de Montréal ethics review board (project number CE16.188, amendment 2017-6870).
Consent for Publication
All authors provided critical feedback, helped shape the manuscript, and agree with its content and its publication.
Availability of Data and Materials
The raw data is not readily accessible given the requirement of patient data confidentiality by the ethics committee that approved the project.
Declaration of Conflicting Interests
The author(s) declared no potential conflicts of interest with respect to the research, authorship, and/or publication of this article.
Funding
The author(s) disclosed receipt of the following financial support for the research, authorship, and/or publication of this article: This research was supported by the Astellas CHUM CNTRP Research Innovation Grant award funded by Astellas Canada, le Centre Hospitalier de l’Université de Montréal (CHUM), and jointly established with the Canadian National Transplant Research Program (now called Canadian Donation and Transplantation Research Program). This research also received funding from Institut de valorisation des données (IVADO)
Ethical Considerations
The project was approved by the Centre hospitalier de l’Université de Montréal ethics review board (project number CE16.188, amendment 2017-6870).