
Abstract
Background:
Establishing a customized reference chart and curve of renal size for a specific population of the same sociodemographic characteristics enables a better interpretation of sonographic assessments.
Objective:
To evaluate the morphology of kidneys using ultrasound and establish the normal limits and percentile curves among apparently healthy children in northwest Ethiopia, 2021.
Design:
A hospital-based cross-sectional study design.
Setting:
The study was conducted in Debre Markos comprehensive specialized hospital, Finote Selam general hospital, and Bichena primary hospitals.
Patients:
The study participants were 403 apparently healthy school-age children, from December 2019 to June 2020.
Methods:
Data were collected using a structured questionnaire, physical examination, and ultrasound. We used EPI-Data Version 3.1 for data entry. Height and body surface area–related kidney length and volume curves and tables were generated after lambda-mu-sigma (LMS) quantile regression with a Box-Cox Transformation to Normality using the vector generalized additive model (VGAM) method and generalized additive model for location, scale and shape (GAMLSS) (R, VGAM, and GAMLSS package).
Results:
The height and body surface area of children was the best predictor of the sonographic dimensions of the kidneys. Reference intervals were established using height and body surface area specific for clinically practical dimensions of the kidney (length and volume).
Limitations:
Calibration of measuring tools in the hospitals was not conducted frequently; community fatigue due to presence of many research projects in the selected hospitals was observed.
Conclusions:
According to this study, the children are considered to have normal sonographic dimensions if ultrasound values lie between the 2.5th and 97.5th percentile based on their respective height and body surface area.
Introduction
Renal size assessment is vital in the evaluation, diagnosis, and follow-up of pediatric patients with kidney, ureters, and bladder pathology, as well as for urinary tract infection as many renal disorders will affect the kidneys’ growth and development.1,2 However, to detect changes, prior knowledge of the actual normal size of these viscera is required in the population being studied. 3
The development or increase in the size of the kidney stops at the age of 25 or 26 years. When the kidneys stop increasing in size, the average length usually reaches 12 cm while the breadth is approximately 6 cm, and the mean thickness of the kidney is around 3.0 cm. The size of the kidney can still grow after maturation if one of the kidneys was removed to compensate for the functions of the other kidney. 4
Medical imaging techniques permit the observation of anatomical structures in living people and the study of their movements in normal and abnormal activities. Identifying normal structures on radiographs makes it easier to recognize the changes caused by disease and injury. 5
However, routine computed tomography and magnetic resonance imaging for the diagnosis and serial follow-up of patients for kidney disease is difficult to justify because of the radiation exposure, the cost, and limited availability in many areas of the world, particularly in developing countries. So, ultrasonography is an established, safe, fast, and reliable method for measuring kidney sizes.6,7 Sonography is an essential tool in nephrology for not only the diagnosis and management of kidney disease but also the guidance of invasive procedures. Sonography is also useful in determining agenesis, hypertrophy, atrophy, and ectopic location of the kidneys. The evaluation is challenging because the normal size varies because of nutritional factors, body habitus, geographical location, physical activities, genetic differences, race, and ethnicity.8 -12
Size is a key parameter that should be measured carefully as it is the basis for important clinical decisions. Renal length and volume are important indicators for disease progression in urology and nephrology practice. They are also important clinical parameters in evaluating and following up with a kidney transplant recipient, patients with hypertension and renal insufficiency related to renal artery stenosis, and patients with recurrent urinary tract infections.13,14 Because therapeutic decisions frequently are based on the results of these dimensions, accurate and reproducible methods for assessing renal length and volume are of great importance. 15 In addition, an understanding of reference values of normal renal metrics is critical to assess alterations from these values.
The purpose of this study was to determine the normal range of kidney size in healthy pediatric patients and to establish the parameters for normal variation based on a large series of pediatric ultrasound examinations. The study provides percentile curves and charts for the objective determination of renal size.
Materials and Methods
Study Design and Setting
The institutional-based cross-sectional study design was conducted among 403 school-age children, from December 2019 to June 2020 in Debre Markos comprehensive specialized hospital, Finote Selam general hospital, and Bichena primary hospitals of east and west Gojjam zone, northwest Amhara.
Study Participants
All children of 7 to 15 years who came to the hospital pediatrics departments during study periods for a follow-up examination for mildly treated conditions or examined because of problems unrelated to the kidneys or for a routine check-up were included in the study. Children with any clinical evidence of kidney disease were excluded from the study. Any abnormal sonographic findings of kidney-like parenchymal mass lesions and hydronephrosis were excluded from the study. In total, 403 children who fulfilled the inclusion criteria were included in the study.
Data Collection Procedure and Quality Control
The sociodemographic characteristics of the study participants were collected using a structured interviewer-administered questionnaire. Anthropometric measurements of the participants, height (cm), weight (kg), waist circumference (cm), body mass index (BMI), xipho-pubic distance (cm), and abdominal volume were rigorously evaluated. Height was measured by a stadiometer and weight with a standard beam balance scale (digital). Waist circumference was got at the midpoint between the lowest rib and the iliac crest using a tape meter. We calculated BMI as body weight (kilograms) divided by body height (meters) squared. Body surface area (BSA) was calculated according to the Mosteller formula: BSA (m2) = square root of ([Height (cm) × Weight (kg)] / 3600). 16 The abdominal volume was computed according to the standard formula: (waist Circumference / 6.28)2 × xipho-pubic distance × 3.14. 17 All anthropometric measurements were taken by 3 trained data collectors.
Sonographic evaluation: Kidney measurements were performed in a lateral decubitus position using a curvilinear probe. All measurements of kidneys were made during quiet breathing in younger children and in older children, measurements were made while they were holding their breath. The kidney was identified as having a brightly echogenic renal capsule with a central (sinus) echogenicity. The superior and inferior poles were identified and marked in the longitudinal scan of the kidney; the renal length was taken as the longest distance between the poles using an electronic caliper. The thickness was measured on the longitudinal scan, and the maximum distance between the anterior and posterior walls at the mid-third of the kidney was taken as thickness. The renal width (W) was measured on the transverse scan, and the maximum transverse diameter was taken at the hilum as the renal width. Scanning was conducted 3 times, and the average dimension was taken by the same professionals. Intra-rater reliability was assessed for the longitudinal dimension and volume of both kidneys. Accordingly, intra-rater reliability of the length of the right kidney was 0.921, 0.901, and 0.93; and for the volume of the right kidney was 0.911, 0.90, and 0.901 in Debre Markos comprehensive specialized hospital, Finote Selam general hospital, and Bichena primary hospitals, respectively. Intra-rater reliability of volume of the right kidney was 0.923, 0.922, and 0.900; and for the left kidney was 0.901, 0.913, 0.933 in Debre Markos comprehensive specialized hospital, Finote Selam general hospital, and Bichena primary hospitals, respectively. Due to the lack of radiography professionals, repeated measurements were conducted by the same professional although it would have been better if measurements were recorded by different professionals. The volume of the kidney was calculated using the prolated ellipsoid formula (Length × Width × Thickness × 0.523). 18
Data Analysis
We used EPI-Data Version 3.1 for data entry. All analyses were performed using R v.4.2.1 (RStudio 2022.07.2+576). Descriptive statistics for continuous variables were described using central tendency (mean) and dispersion (standard deviation). A 1-way analysis of variance (ANOVA) was conducted to compare the means of anthropometric measurements among children of each age group. A Pearson product-moment correlation was run to determine the relationship between age, weight, height, waist circumference, xipho-pubic distance, BSA, abdominal volume, and sonographic measurements of the right and left kidneys. Height and BSA-related kidney length and volume curves and tables were generated after lambda-mu-sigma (LMS) quantile regression with a Box-Cox Transformation to Normality was fitted using the vector generalized additive model (VGAM) and generalized additive model for location, scale and shape (GAMLSS) method (R, VGAM, and GAMLSS package).
Results
Anthropometric Assessments of Children
A total of 403 apparently healthy children were enrolled in this study. A 1-way ANOVA was conducted to compare the means of anthropometric measurements among children of each age group. There was a statistically significant difference between groups as determined by 1-way ANOVA: F(8, 394) = 191.66, P < .001, for height; F(8, 394) = 73.06, P < .001, for weight; F(8, 394) = 24.97, P < .001, for waist circumference; F(8, 394) = 101.95, P < .001, for xipho-pubic distance; F(8, 394) = 103.61, P < .001, for BSA; and F(8, 394) = 44.53, P < .001, for abdominal volume (Table 1).
Descriptive Analysis of Anthropometric Measurements of Children Based on Age (N = 403).

BMI Z Scores of the Children
The BMI Z-score cut-points of <−2.0, >1.0, >2.0, >3.0 are recommended to define wasted, at risk of overweight, overweight, and obese. Accordingly, 1% of the children were wasted and 72 (17.9%) children were at risk of being overweight. Otherwise, there were no overweight and obese children in our study.
Sonographic Evaluation of the Kidneys and Anthropometric Measurements (Body Parameters)
The mean sonographic length, thickness, and width of the right kidney were 8.56 ± 0.85 cm, 4.41 ± 0.67 cm, and 5.57 ± 0.76 cm, respectively. Whereas the mean sonographic measurements of the left kidney were 8.52 ± 1.06 cm, 4.42 ± 0.60 cm, and 5.68 ± 0.63 cm, for length, thickness, and width, respectively. The mean volume of the right kidney was 112.88 ± 37.25 cm3, and that of the left kidney was 115.72 ± 31.99 cm3. There was no significant difference between the right and left kidneys.
A Pearson product-moment correlation was run to determine the relationship between age, anthropometric, and sonographic measurements of the right and left kidneys. The age and height of children were best correlated with the length (r = 0.609, N = 403, P < .001) and volume (r = 0.560, N = 403, P < .001) of the right kidney. The sonographic measurements of the length of the left kidney were moderately correlated with age (r = 0.286, N = 403, P < .001) whereas the volume of the left kidney was best correlated with the weight of the children (r = 0.628, N = 403, P < .001) (Table 2).
Pearson Correlation Matrix of Right and Left Kidney Sonographic Measurements and Anthropometric Profiles of Children (N = 403).

and bold-faced value shows the strong correlation.
Reference Intervals for Dimensions of the Kidneys and Body Parameters
Height and BSA-related kidney length and volume curves and tables were generated using nonparametric reference limits (2.5th-97.5th and 5th-95th percentiles) (Tables 3-10; Figures 1–8).
Limit of the Length of the Right Kidney According to the Body Surface Area of Children Using Nonparametric Reference Limits (2.5th-97.5th and 5th-95th Percentiles) (N = 403).

Limit of the Length of the Right Kidney According to the Height of Children Using Nonparametric Reference Limits (2.5th-97.5th and 5th-95th percentiles) (N = 403).

Limit of the Volume of the Right Kidney According to the Height of Children Using Nonparametric Reference Limits (2.5th-97.5th and 5th-95th Percentiles) (N = 403).

Limit of the Volume of the Right Kidney According to the Body Surface Area of Children Using Nonparametric Reference Limits (2.5th-97.5th and 5th-95th) Percentiles (N = 403).

Limit of the Length of the Left Kidney According to the Body Surface Area of Children Using Nonparametric Reference Limits (2.5th-97.5th and 5th-95th Percentiles) (N = 403).

Limit of the Length of the Left Kidney According to the Height of Children Using Nonparametric Reference Limits (2.5th-97.5th and 5th-95th Percentiles) (N = 403).

Limit of the Volume of the Left Kidney According to the Height of Children Using Nonparametric Reference Limits (2.5th-97.5th and 5th-95th Percentiles) (N = 403).

Limit of the Volume of the Left Kidney According to the Body Surface Area of Children Using Nonparametric Reference Limits (2.5th-97.5th and 5th-95th Percentiles) (N = 403).


Percentile curves of the model-based reference limits (2.5th-97.5th and 5th-95th) for the length of the right kidney by body surface area.

Percentile curves of the model-based reference limits (2.5th-97.5th and 5th-95th) for the length of the right kidney by height.

Percentile curves of the model-based reference limits (2.5th-97.5th and 5th-95th) for the volume of the right kidney by height.
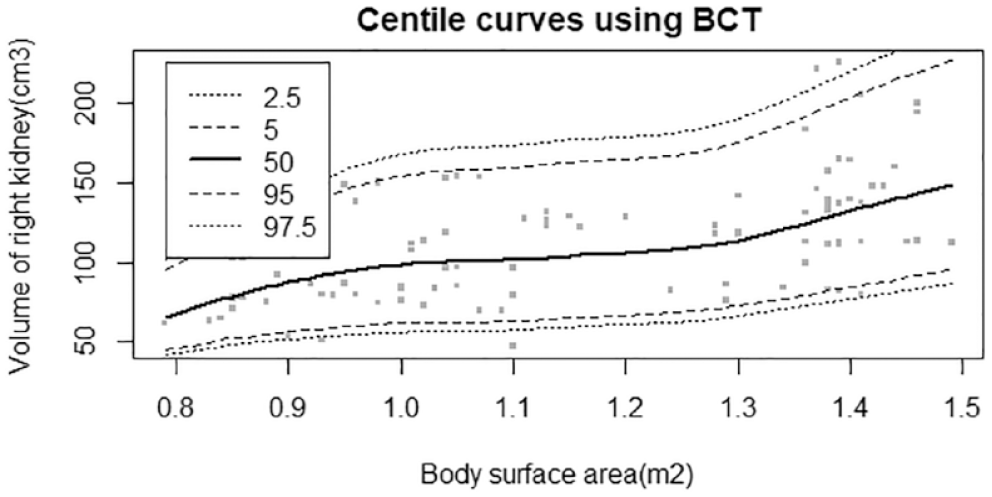
Percentile curves of the model-based reference limits (2.5th-97.5th and 5th-95th) for the volume of the right kidney by body surface area.

Percentile curves of the model-based reference limits (2.5th-97.5th and 5th-95th) for the length of the left kidney by body surface area.

Percentile curves of the model-based reference limits (2.5th-97.5th and 5th-95th) for the length of the left kidney by height.

Percentile curves of the model-based reference limits (2.5th-97.5th and 5th-95th) for the volume of the left kidney by height.

Percentile curves of the model-based reference limits (2.5th-97.5th and 5th-95th) for the volume of the left kidney by body surface area.
When to Say There Is Hypertrophy or Atrophy?
According to our study, the children are considered as having enlarged or atrophied kidneys when the length and/or volume of their kidneys are above 97.5th and below 2.5th percentile, respectively, based on the respective height and BSA.
Discussion
In the literature, there are few detailed studies to interpret the organ dimensions in school-aged children in Africa and Ethiopia. Sonographic determination of pathologic changes in the size of these abdominal organs necessitates knowing the normal ranges of their measurements especially concerning anthropometric assessments in school-age children. The morphology of visceral organs varies from person to person. During the maturation process from infancy through adolescence, the growth of visceral organs shows a high correlation with gains in age, height, and weight.6,19,20,21
There was no significant difference between the longitudinal dimension of the right and left kidneys as appeared in past investigations.22 -26 However, other studies reported that the longitudinal length of the left kidney was greater than that of the right kidney.19,27,28
There is no agreement on which anthropometric measurements are generally touchy for exploring the normal limit of organ measurements,6,24,29,30 as these parameters might show variations in different ethnic origins. Previous studies showed that the longitudinal dimensions of the kidneys were best correlated with body parameters.6,19,23,25,27,28,30 -34 The results of our study were under the findings of those studies. Height was best correlated with longitudinal dimensions and volume of the right kidney. Whereas weight was best correlated with the volume of the left kidney.
While renal volume is the most accurate parameter of kidney size, kidney length is the most useful parameter for clinical measurement of kidney size, because it is simple to obtain and is minimally affected by interobserver variability.35,36 We have established percentile curves and charts for the length and volume of the kidney based on the height and BSA of children. Growth charts for kidney length and volume in childhood are constructed and will provide the basis for objective intraindividual and interindividual determination of renal size.
In most other studies, sizes between the 5th and 95th percentiles were the accepted normal limits.37,38 However, this practice results in approximately 10% of children with normal visceral organs falling outside these limits. 30 We preferred to define the lowermost and uppermost dimensions of the kidneys using the 2.5th and 97.5th percentile values in addition to the 5th and 95th percentile values respectively as a guide.
Conclusions
The normal limits of the kidneys are important parameters during a sonographic examination. This study revealed that renal dimensions showed the best correlation with age, weight, and height. The study provides percentile curves and charts for objective determination of the renal size. We hope this study contributes to daily practice in radiology clinics to interpret the normal sizes of the kidneys of school-aged children in northwest Ethiopia.
Limitations
Calibration of measuring tools in the hospitals were not conducted frequently; community fatigue due to presence of many research projects in the selected hospitals was observed.
Footnotes
Acknowledgements
The authors thank the Debre Markos university research directorate that sponsored them while collecting data. They also thank Debre Markos comprehensive specialized hospital, Bichena primary hospital, and Finote Selam general hospital staffs of pediatric and radiology departments for their continuous support of the data collection procedure.
Ethics Approval and Consent to Participate
Written informed consent was obtained from the participants and parents. The ethical clearance was taken from Debre Markos University, School of Medicine Ethical Review Committee. A permission letter was also accepted from primary and referral hospitals.
Consent for Publication
Not applicable.
Availability of Data and Materials
Data will be available upon request from the corresponding author.
Author Contributions
BT and GS conceived and designed the study, and analyzed the data. BT also wrote the initial draft of the manuscript, which was critically reviewed by GS. Both have read and approved the final version of the manuscript.
Declaration of Conflicting Interests
The author(s) declared no potential conflicts of interest with respect to the research, authorship, and/or publication of this article.
Funding
The author(s) received no financial support for the research, authorship, and/or publication of this article.
Guarantor
Binalfew Tsehay