
Abstract
Background:
Online dialysis clearance monitors typically provide an accurate value for Kt. A value for V (total body water [TBW]) is required to calculate Kt/V, the measure of the adequacy of the delivered dialysis in hemodialysis (HD) patients. Using bioimpedance spectroscopy (BIS), we previously developed 2 sex-specific equations for the estimation of the TBW, which we have chosen to name the St Michael’s Hospital (SMH) equations.
Objective:
The objective of this study was to validate the SMH equations in a second distinct population of patients.
Design:
Cross-sectional study.
Setting:
Single center hemodialysis unit at St Michael’s Hospital, a tertiary care teaching hospital, in Toronto, Canada.
Patients:
Eighty-one adult HD patients who had been receiving conventional maintenance HD for at least 3 months.
Measurements:
Anthropometric measurements including weight, height, and waist circumference were collected. TBW was measured by BIS using the Body Composition Monitor (Fresenius Medical Care, Bad Homburg, Germany).
Methods:
The Bland-Altman method to calculate the bias and limits of agreement and the difference plot analysis were used to evaluate the difference between the BIS-TBW and the TBW derived from our equations (SMH equation) in this validation cohort.
Results:
The TBW values based on our equations had a high correlation with BIS-TBW (correlation coefficients = 0.93, P values < .01, bias = 1.8 [95% CI: 1-2.6] liter). Application of SMH equations closely predicted Kt/V, based on BIS value, in all categories of waist circumference.
Limitations:
Small sample size, single-center, not including peritoneal dialysis patients. A larger and more heterogeneous sample with more patients at the extremes of body mass index would allow for more detailed sub-group analyses in different races and different anthropometric categories to better understand the performance of these equations in discrete sub-groups of patients.
Conclusions:
In maintenance HD patients, our previously derived equations to estimate the TBW using weight and waist circumference appear to be valid in a distinct patient population. Given the centrality of TBW to the calculation of small molecule clearance, the SMH equations may enhance the measurement of dialysis adequacy and inform practice.
Introduction
Online dialysis clearance monitors typically provide an accurate value for Kt. In this case, a value for V ( total body water [TBW]) is required to calculate Kt/V, the measure of the adequacy of the delivered dialysis in hemodialysis (HD) patients. The TBW volume reflects the volume of distribution of urea and thus constitutes the denominator of the function Kt/Vurea, the widely used marker of small molecule clearance in a given HD session.1,2 An accurate assessment of the TBW is also needed for the online measurement of Kt/Vurea by sodium dialysance, a feature offered by many contemporary HD machines. 3 This assessment requires sophisticated measurement techniques, such as isotope dilution measurements, which are costly and time-consuming and, hence, not practical for routine clinical practice.4,5 Recently, bioimpedance spectroscopy (BIS), the most accurate bioimpedance technology available, has been demonstrated to be a validated surrogate for isotopic dilution techniques, which are considered the reference standard for the determination of TBW.6,7 The establishment of a simple and accurate equation to predict the patient’s TBW would facilitate a precise determination of the delivered small molecule clearance with each HD treatment.
Several formulae have been derived for the estimation of the TBW.8,9 Specifically, the use of the Watson formulae has been employed by the Kidney Disease Outcomes Quality Initiative (KDOQI) Clinical Practice Guidelines for HD adequacy for the calculation of TBW and is also used in the current generation of HD machines for estimation of the delivered Kt/V.1,9 The appropriateness of applying the Watson formulae, which are based on the patient’s weight and height, in the dialysis population has been questioned. These equations were derived in patients hospitalized for minor disorders and did not include dialysis patients. It has been shown that the body composition of the HD population is fundamentally different from that of the general population due to malnutrition, low lean tissue mass, high fat mass, and higher extracellular volume, all of which have major implications for TBW.10,11
In our previous study, in a population of 184 HD patients in St Michael’s hospital, we showed that the Watson formulae consistently overestimated the TBW as compared with bioimpedance technology using the Bland-Altman method. 12 Using multiple linear regression analyses with stepwise selection and least square method, we derived 2 practical and simple equations for the estimation of the TBW employing the measurement of the patient’s weight and waist circumference.
The objective of the current study was to validate the SMH TBW estimating equations, as compared with the TBW measured with BIS, in a new cohort of HD patients which consists of a distinct population of HD patients.
Methods
Study Design and Methods
This is a cross-sectional study of prevalent in-center chronic HD patients at St Michael’s Hospital, a tertiary care teaching hospital, in Toronto, Canada. We included adults 18 years or older who had been receiving conventional maintenance HD for at least 3 months and who were not included in our previous study in which our TBW estimating equations were first derived. Exclusion criteria were pregnancy or limb amputation. All patients were receiving conventional HD (3-4 hours per session, 3-4 times weekly) at the time of assessment. The dialysis machine was the Fresenius 5008 (Fresenius Medical Care, Bad Homburg, Germany) and the predominant dialyzer was Fx Cordiax 120 (Fresenius Medical Care). We collected relevant demographic and clinical data, which included age, race, sex, cause of end-stage renal disease (ESRD), time since initiation of dialysis, history of coronary artery disease (defined as previous myocardial infarction or revascularization procedure), hypertension, and diabetes status from the patient’s clinical record. This study was approved by the St Michael’s Hospital Research Ethics Board. As the BIS data were gleaned as part of routine patient care, a waiver of patient-level consent was authorized.
Anthropometric Measurements
Participants were weighed and waist circumference was measured, as previously described. 12
Bioimpedance Spectroscopy (BIS)-TBW
We used the Body Composition Monitor (BCM; Fresenius Medical Care) to measure body compartments using BIS. Electrodes were attached to one hand and one foot (in presence of arteriovenous access, the limbs contralateral to the access were used) after a 2- to 3-minute resting period in the supine position before the dialysis session. The following parameters were displayed in liters: TBW, extracellular water, intracellular water, and the extent of overhydration. Overhydration represents the excess fluid and is based on the fixed proportions of intracellular water and extracellular water within adipose and nonadipose tissue. As BIS was performed before dialysis (to avoid the problem of postdialysis fluid redistribution), we subtracted the ultrafiltration volume during dialysis to calculate the postdialysis TBW (dry weight TBW). 12
Clinical Measurements
Laboratory data from within the month prior to the BIS measurement, including hemoglobin, albumin, total cholesterol, creatinine, potassium, calcium and phosphorus, were collected. Dialysis session data (dialysis session duration, dialysate composition, ultrafiltration volume, relative blood volume changes, pre- and postdialysis systolic and diastolic pressure) were recorded. K in the Kt/Vurea was measured by sodium dialysance and generated by the dialysis machine by delivery of a brief pulse to increase the sodium concentration in the dialysate. 13 The dynamic input conductivity signal (pulse) at the dialyser inflow is continuously monitored by the conductivity sensor installed at that position: the signal at the outflow of the dialyser is registered by an equivalent sensor positioned there. The relative areas under the curves for the 2 recorded conductivity signals reflect the diffusion of sodium ions across the dialyser membrane. 13 As urea has a diffusion profile similar to that of sodium, urea clearance can be determined (using appropriate correction factors) irrespective of the actual concentration of urea in the blood. The value for “V” (TBW) was calculated using both previously derived SMH equations and the Watson equations, as detailed below.
Watson Equations for TBW in Liters
TBW (men) = 2.447 + 0.3362 × postdialysis weight (kg) + 0.1074 × height (cm) – 0.09516 × age 9
TBW (women) = −2.097 + 0.2466 × postdialysis weight (kg) + 0.1069 × height (cm)
Our Previously Derived SMH Equations for TBW in Liters
TBW (men) = 25.67450 + 0. 5880 × postdialysis weight (kg) − 0. 3556 × waist circumference (cm) 12
TBW (women) = 17.6071 + 0. 3823 × postdialysis weight (kg) − 0. 1573 × waist circumference (cm)
Data Analysis
Patient and dialysis characteristics and the TBW estimates were summarized by standard descriptive statistics (eg, mean, standard deviation). Interclass correlation (inter-observer agreement) statistical analysis, which addresses if different raters assign the same score to the same subject, was used to find the absolute agreement between BCM and SMH equation. To validate the SMH equations for TBW estimation, we used the Bland-Altman method to calculate the mean difference (the “bias”) and limits of agreement (reference range for difference) between the BIS-TBW, which we considered the reference standard for the purpose of this analysis, and the TBW derived from the SMH equations. As body composition might be different in males and females, we used sex-specific equations, as previously described. 12
To evaluate the impact of obesity on the performance of the SMH equations, the analyses were repeated in HD patients with body mass index (BMI) below and above 30 kg/m2. Finally, we compared Kt/Vurea measures in which the V component was calculated by the SMH and Watson equations with the BIS-TBW across the tertiles of waist circumference.
Unless otherwise stated, the results are summarized as mean ± SD (standard deviation). Statistical analyses were carried out with STATA statistical software version 11.0 (Stata Corporation, www.stata.com)
Results
Ninety-four chronic HD patients began their dialysis at St Michaels Hospital after the completion of our derivation study. Of these, the following patients were excluded: 9 due to an amputation, 3 who refused BIS, and 1 who refused measurement of waist circumference. We therefore studied 81 patients whose mean age was 63 ± 14 years and median time on dialysis was 2.9 (interquartile range: 2.2-3.6) years (Table 1). This validation cohort included more patients with diabetes and with a shorter duration of dialysis than the derivation cohort. There was no significant difference between the groups with respect to laboratory parameters except for the serum hemoglobin and albumin level which were higher in the derivation cohort (Table 1).
Demographic and Clinical Characteristics of Hemodialysis Patients in the Derivation and Validation Cohorts.

Abbreviation: ESRD = end-stage renal disease; IQR = interquartile range; BIS = bioimpedance spectroscopy; LDL = low-density lipoprotein.
Asian: Chinese, Japanese, Korean, Filipino, Laotian, Vietnamese. bSouth Asian: Indian, Indo-Caribbean, Pakistani, Sri Lankan. cKt/Vurea was measured using sodium dialysance during dialysis where V was based on the Watson equations.
P < .05.
Comparison of the BIS-TBW With That Predicted by the Watson and SMH Equations
The TBW as predicted by the SMH and Watson equations as compared with the BIS-TBW are presented in Table 2, divided into patients with a BMI above and below 30 kg/m2. The TBW prediction based on the SMH equations had a high correlation with the BIS-TBW (correlation coefficient = 0.92). Compared with the BIS-TBW, the SMH equations appeared to be accurate in predicting TBW, although a consistent measurement bias (mean bias = 1.8 L, absolute agreement 0.90 [0.75-0.94]) was observed. Figure 1 which shows the difference plot analyses between SMH TBW and BCM-TBW confirmed these findings.
Absolute Agreement (Inter-Class Correlations), 95% CI, and Limit of Agreement of BIS TBW With Watson’s and Our Equations in the Validation Population.

Abbreviation: SMH = St Michael’s Hospital.

Bland-Altman plots of the difference between BCM-TBW as reference standard and SMH equation TBW in the validation cohort of 81 hemodialysis patients.
In male sex, the SMH equation had a smaller mean difference (bias) in estimated TBW than in female sex (mean bias was 1.3 vs 2.4 L respectively). While the Watson equations also had a high correlation with the BIS-TBW, there was a higher bias in the Watson prediction of the TBW of 5.9 L (absolute agreement 0.72 [-0.06 to 0.91]). This overestimation was consistent in both male and female sex and across all categories of BMI.
To evaluate the impact of obesity on the performance of our equations, the analyses were repeated in HD patients with BMI below and above 30 kg/m2. As evident in Figure 2, in the lower BMI group, the SMH equations’ regression line is very close to the line of identity (the line that represents 100% accuracy in predicting TBW); however, the Watson equations’ regression line consistently overestimates the TBW. Paired t tests were conducted to check for any significant difference in the TBW calculated by both Watson’s and the SMH equations vs BIS-TBW. In patients with BMI < 30 kg/m2, the TBW overestimation by Watson’s and the SMH equations was 4.8 L (P < .01) and 0.6 L (P = .2), respectively. In patients with higher BMI, the SMH equations and the Watson formulae both overestimated the TBW, but the magnitude of overestimation was more prominent with the Watson formulae (7.4 L, P < .01 vs 3.4 L, P < .05 TBW for Watson’s and SMH equations, respectively). Also, as we see in the patients with a high BMI (Panel B), the 2 regression lines diverge indicating that the higher the BMI, the more the Watson formulae overestimate the TBW (correlation coefficients between BMI and the amount of TBW overestimation was 0.38 [P < .01]). As the magnitude of this overestimation increases with increasing BMI, there is no single factor with which to correct this overestimation.

Scatter plots and regression line, reflecting the correlations between the BIS-TBW and the TBW estimated by the Watson and SMH equations in the validation cohort of 81 HD patients (Panel A: BMI < 30 kg/m2, B: BMI ≥ 30 kg/m2).
A comparison of the estimated TBW by the SMH equations in both our initial derivation cohort 12 and the current validation cohort, with the measured BIS-TBW (Figure 3), further validated the SMH equations. The correlation coefficient between the derived SMH equations and BIS-TBW was 0.86 and 0.93 in the derivation and validation cohorts, respectively.
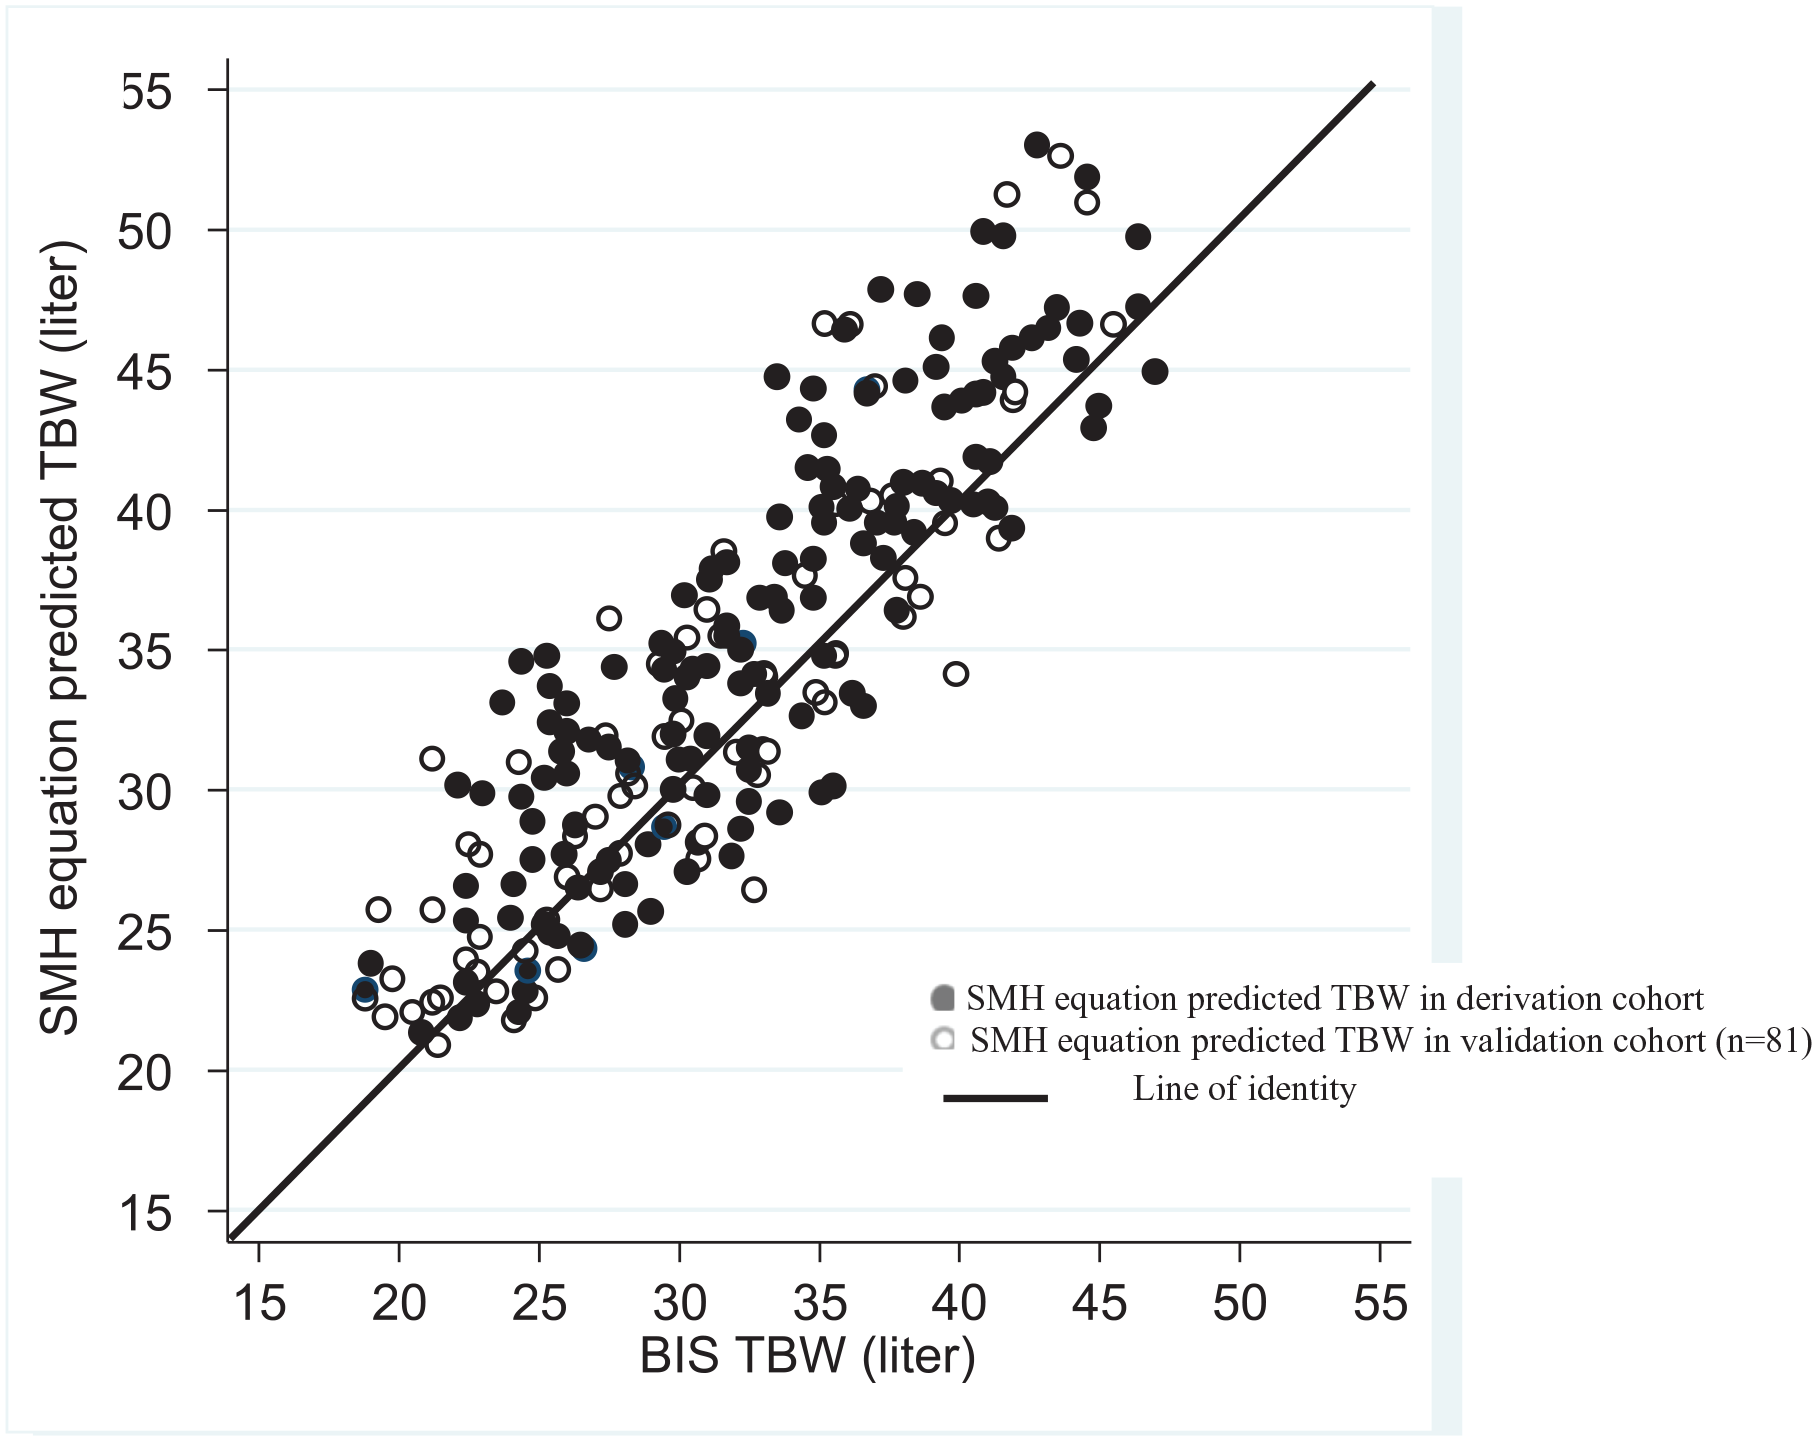
Scatter plots, reflecting the correlations between the BIS-TBW and the TBW estimated by the SMH equations in both the derivation and validation cohorts.
We compared the Kt/Vurea calculations in which the V component was calculated by the Watson formulae with the SMH equations and with the BIS-TBW across the tertiles of waist circumference (Figure 4). The Watson equations led to underestimation of Kt/Vurea in all 3 tertiles, and most prominently in the higher waist circumference tertile.
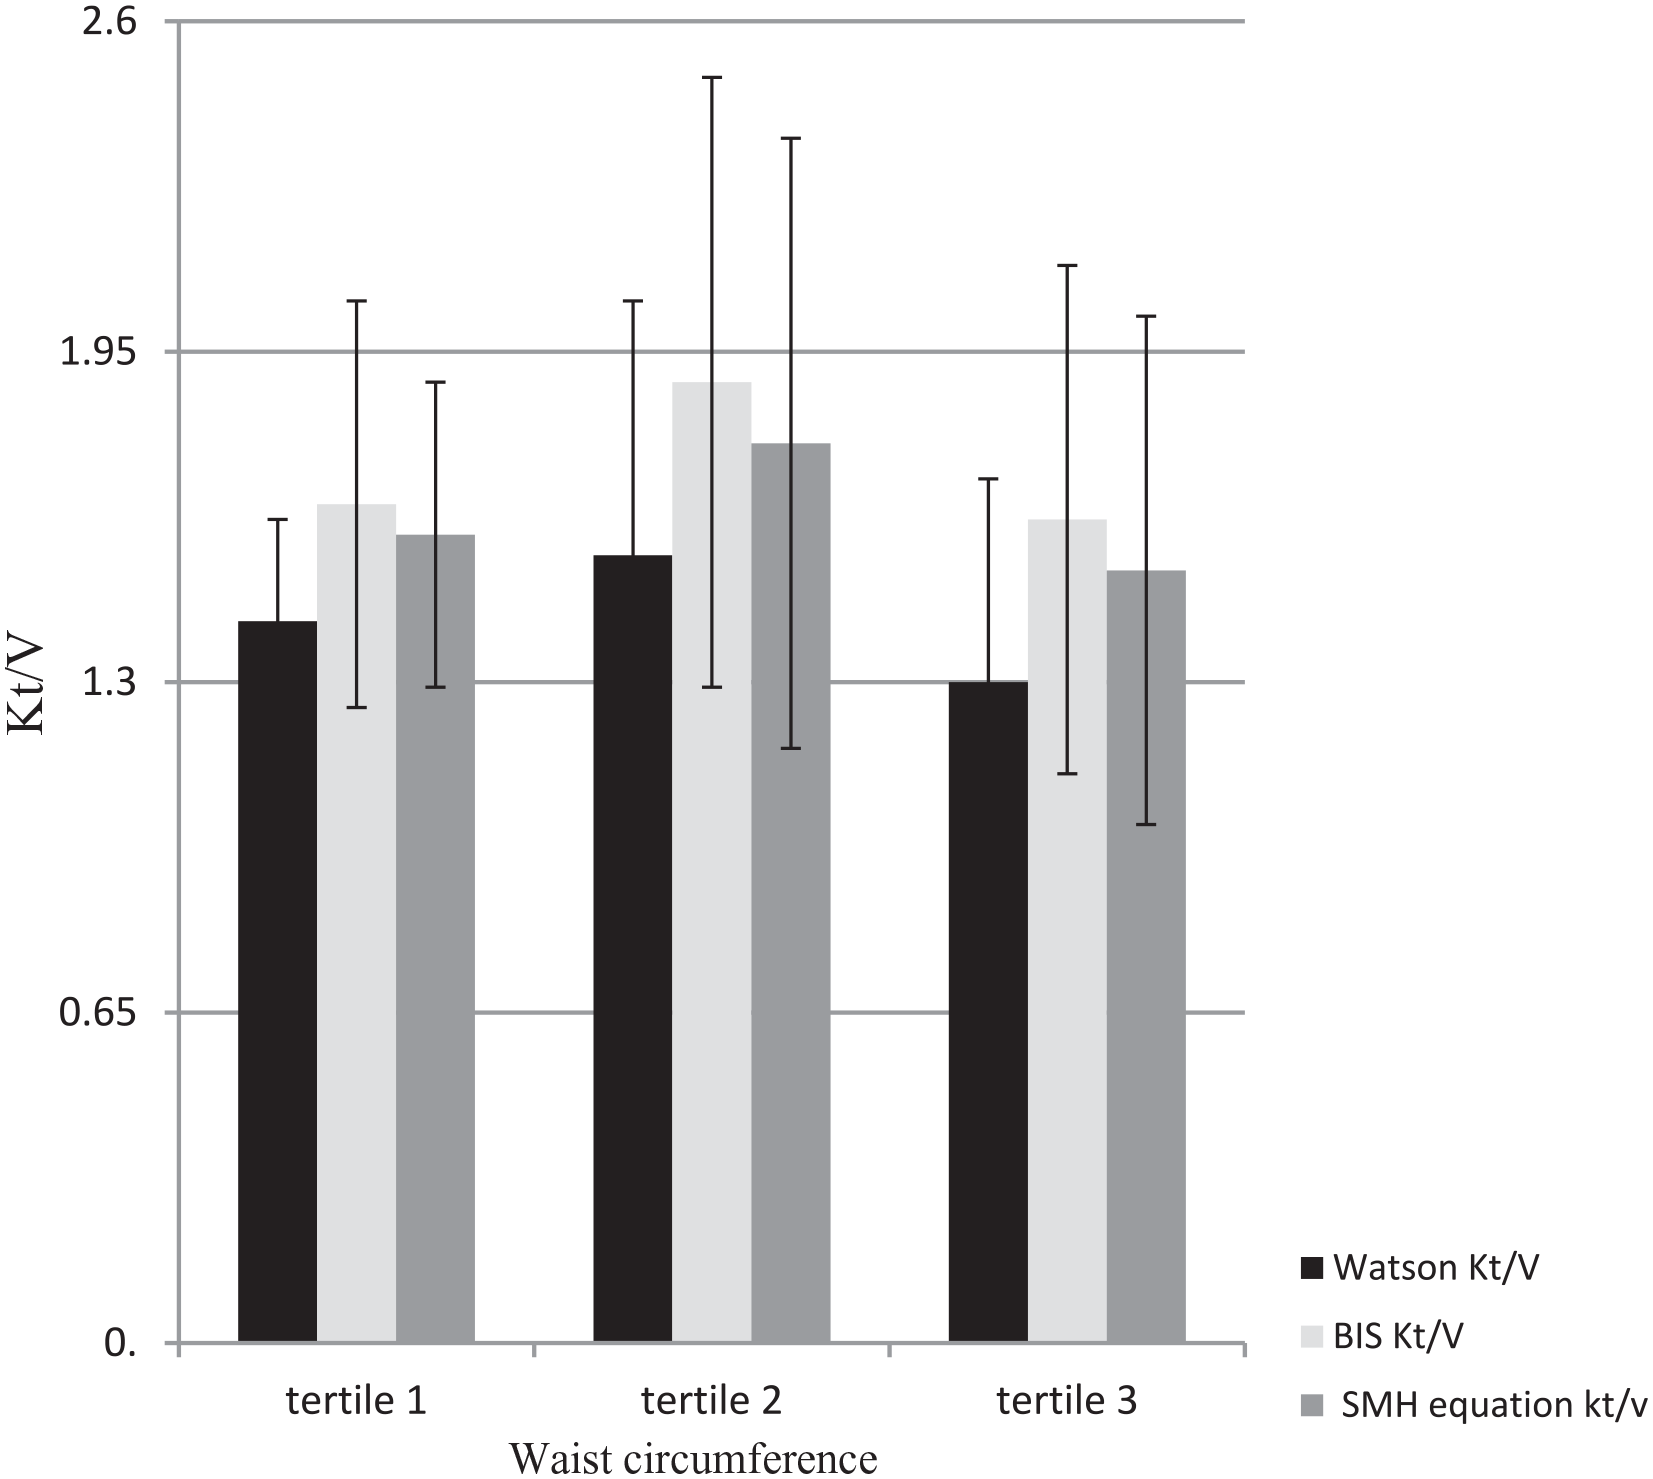
Kt/Vurea calculated by SMH equations and the Watson equations vs BIS across tertiles of waist circumference in 81 HD patients.
Discussion
In our previous cohort of 184 maintenance HD patients using BIS-TBW as a reference standard and a thorough evaluation of body composition using comprehensive anthropometric measurements, 12 we derived 2 practical sex-specific estimating equations for TBW. In the present validation cohort, we confirmed that the derived SMH equations yielded accurate estimates of the BIS-measured TBW. Although the SMH equation overestimated TBW in obese patients, this overestimation was far less than with the Watson equations.
The accurate measurement of the HD patient’s TBW is a major contributor to their optimal management due to its role in the calculation of small molecule clearance. Isotopic dilution studies, with either deuterium or tritium labeled water, are the gold standards of TBW measurement; however, these methods are not practical in the clinical setting. BIS has been validated against these gold standard methods in calculating TBW,6,7 and clinical trials have demonstrated its value in fluid management decisions.14,15 However, there are limitations to its use in certain patients (those with defibrillators, pacemakers or amputations), and it is not available in all units. It also requires a pre-dialysis assessment, which may not always be practically feasible. Thus, a more readily applied method to estimate TBW could be advantageous.
The Watson formulae were initially derived in a cohort of 458 males and 265 females in whom the TBW was measured using isotope dilution studies with deuterium or tritium labeled water 9 ; however, HD patients were not included in this study. There is evidence that muscle wasting and obesity are frequent in the dialysis population,16,17 and the tissue water content is 70% in muscle and only 20% in fat. 18 Although the BMI values for HD patients are generally higher than those in the general population, many HD patients with apparently high BMI levels have lean body mass levels below the 10th percentile of healthy controls 19 and higher fat mass and higher extracellular water.10,11 Weight, a component of the Watson formulae, does not differentiate between muscle and fat. In the derivation cohort study, waist circumference, a marker of abdominal fat, was more effective in predicting the TBW and effectively supplanted height, which is a key element of the Watson equation. This is most likely due to the fact that, in dialysis patients, the relative distribution of muscle and fat is better captured by waist circumference than by height and weight. This is most likely the basis of our observation that the Watson formulae consistently overestimate patients’ TBW, particularly in patients with higher BMI. Studies investigating the relationship of waist circumference with measures of body fat have shown that the association between waist circumference and total body fat tends to be higher than with intra-abdominal fat. 20 Therefore, in chronic HD patients, waist circumference may be a more useful metric to follow than BMI.
Although body composition is known to change with age, 21 age was not a significant predictor in the SMH equations. 12 The SMH equations suggest that in both males and females, the combination of waist circumference plus weight is the best surrogate of fat/muscle distribution and so should be utilized to predict the TBW. As the greatest underestimation of Kt/V by the Watson formulae exists in the patients with highest waist circumference, Kt/V estimation by the Watson formulae should be interpreted with caution in these patients. Other studies have also shown that abdominal obesity underlies a high risk of all-cause and cardiovascular mortality in patients with ESRD which further emphasizes the usefulness of the measurement of waist circumference in dialysis patients. 22
This study was conducted in a diverse population of patients where the measurements were made as part of their routine care. Our results represent the successful validation of our original SMH equations which have been shown to be robust despite the fact that some characteristics in this validation cohort differed from the derivation cohort (incidence of diabetes mellitus, duration of HD, blood hemoglobin, and serum albumin levels). An additional strength is that it highlighted the value of the waist circumference as an important metric that more precisely reflects the relative proportion of muscle and fat than BMI.
There are important limitations to consider. Our sample size was modest, and because it was a single-center study, extrapolation of our findings to different populations should be done with caution. A multi-center study with larger sample size would enable the evaluation of more patients at the extremes of BMI and would allow for more detailed sub-group analyses in different races and anthropometric categories to better understand the performance of these equations in discrete sub-groups of patients. Finally, our equations are not applicable to peritoneal dialysis (PD) patients as the waist circumference may not precisely reflects the relative proportion of muscle and fat in this group.
We have shown that simple sex-specific equations based on weight and waist circumference can provide an accurate assessment of the TBW, thereby suggesting a viable alternative to the traditionally used Watson formulae. Given the centrality of TBW to the calculation of small molecule clearance, the SMH equations may enhance the measurement of HD adequacy and inform practice. Larger studies in more diverse settings are needed to further validate the SMH equations.
Footnotes
Declaration of Conflicting Interests
The author(s) declared no potential conflicts of interest with respect to the research, authorship, and/or publication of this article.
Funding
The author(s) disclosed receipt of the following financial support for the research, authorship, and/or publication of this article: Funding was provided by donor contributions to the St Michael’s Hospital Foundation.