
Abstract
Background:
Despite the magnitude of fracture and the consequences in patients receiving hemodialysis, optimal risk assessment tools in this population are not well explored. Frailty and falls—known risk factors for fracture in chronic kidney disease (CKD) and non-CKD populations—are common in patients receiving hemodialysis (HD) therapy. While the relationship between T scores in relation to fractures in patients receiving HD is recognized, there is a paucity of data to the additional contributions of fracture assessment tool (FRAX), frailty status, and falls in its relationship with fracture.
Objectives:
To evaluate the clinical utility of adding FRAX, frailty status, and falls to T scores at the femoral neck to determine whether it enhances fracture discrimination in patients on maintenance HD.
Design:
A cross-sectional observational study.
Setting:
Two main dialysis units in Regina, Saskatchewan, Canada.
Patients:
A total of 109 patients on maintenance HD at two dialysis units from January 1, 2017, to December 31, 2018, were included in the study.
Measurements:
Fracture (the main outcome) was documented based on the review of medical charts, self-recall, and additionally vertebral fractures were identified by an x-ray. Areal bone mineral density (BMD) was measured by dual-energy x-ray absorptiometry (DXA). FRAX score was calculated using an online algorithm based on 11 clinical risk factors. We calculated the FRAX score for hip fracture and major osteoprotoic fracture with and without the inclusion of BMD. Frailty was assessed using the Fried criteria, which included assessments of unintentional weight loss, weakness (handgrip strength), slowness (walking speed), and questionnaires for physical activity and self-perceived exhaustion. Patients were enquired about the history and frequency of falls.
Methods:
A total of 131 patients underwent frailty assessments at the two dialysis units during the dialysis treatment. Following frailty assessments, they were referred for DXA scans and upon receipt of the results undertook FRAX questionnaires. They were additionally sent for lumbar x-rays and contacted for a history of falls. Association between the BMD-T score, FRAX, frailty status, falls, with fracture were examined with sequential multivariable logistic regression models. Differences were considered statistically significant at P values <.05.
Results:
A total of 109 patients were included in the data analysis. The composite of fracture occurred in 37.6% of patients. About 59.3% were identified as frail, and 29% of the participants had at least one fall in the last year. On multivariate regression analysis, each lower standard deviation (SD) in femoral neck T score was associated with 48% higher odds of fracture (odds ratio [OR] = 1.48; 95% confidence interval [CI] 1.20-1.68, P = .005). With the inclusion for FRAX scores (hip), the OR for fracture remained significant at 1.38 (OR = 1.38, 95% CI 1.04-1.63, P = .043). The addition of frailty status and history of falls did not further improve the model. Low T score and FRAX were both independent risk factors in patients on HD therapy.
Limitations:
This is a single-center study with a small sample size which limits the generalizability of the findings. Due to the cross-sectional study, associations identified may be difficult to interpret.
Conclusions:
Both BMD measurements by DXA and FRAX are useful tools to assess fracture in patients receiving HD. The addition of frailty status and history of falls is not associated with fractures in this population. Larger prospective studies are needed to determine whether the inclusion of frailty and falls to the conventional models will improve fracture assessment in the population receiving HD.
Trial Registration:
The study was not registered on a publicly accessible registry as it did not involve health care intervention on human participants.
What was known before
Most fracture risk assessments in dialysis populations are based on measurements of T scores and FRAX. Frailty and falls are well-established predictors of fracture in chronic kidney disease (CKD) and non-CKD populations. However, there is a paucity of data to the additional contributions of frailty status and a history of falls in assessing the relationship with fracture in HD population.
What this adds
Our study adds to the emerging literature that both T scores and FRAX scores are associated with fracture in patients on HD. This is the first study to our knowledge that looked at the independent contribution of frailty and falls in addition to T scores and FRAX in assessing for fractures in patients on HD.
Introduction
Patients with advanced chronic kidney disease (CKD), especially those on dialysis, are at a significantly higher risk of bone fractures compared with the age-matched general population.1,2 Bone strength worsens with declining kidney function due to inevitable disturbances in mineral metabolism (alterations in calcium, phosphorus, parathyroid hormone [PTH], and vitamin D) that impairs bone volume, bone quality and microarchitecture,3,4 concurrent use of medications (heparin, proton pump inhibitors), 5 and uremic environment.6,7 A number of other factors that are unrelated to bone strength contribute to fracture risk including falls,2,8,9 reduced muscle strength10,11 and frailty. 12 Fractures in the hemodialysis (HD) population lead to increased hospital stay, institutionalization, morbidity, and mortality.13-15 The ability to accurately gauge fracture risk is critical in identifying cost-effective thresholds for intervention. 16
The operational definition of osteoporosis is based on bone mineral density (BMD) assessed by dual-energy x-ray absorptiometry (DXA) at the spine or hip < −2.5 standard deviation (SD) from the BMD in young female adults (T score). 17 Several cross-sectional and prospective population studies have shown the risk of fracture increases by a factor of 1.5 to 3.0 for each 1 SD decrease in BMD. 18 The 2017 KDIGO guidelines (in contrast to the 2009 guidelines) recommended BMD testing in patients with CKD G3-5D if patients have risk factors for osteoporosis. 19 DXA despite being the main instrument for the diagnosis of osteoporosis has limitations 20 and online tools such as fracture risk assessment tool (FRAX) which incorporates clinical risk factors for fracture were launched in 2008. 21 FRAX is a well validated tool, but it also has some limitations and does not incorporate frailty or falls which have both been shown to be associated with fractures. 22
Frailty is characterized by a syndrome of decreased physiological reserve to stressors that increases the vulnerability to adverse health outcomes. 23 Prospective studies have shown higher frailty scores can predict fractures, likely due to having overlapping risk factors with bone fragility. 24 Frailty on dialysis has a prevalence of as high as 73% 15 and been linked to falls9,12,25 and fractures. 25 History of falls is an independent risk factor for fracture in the general population 26 and in CKD G3-5 patients. 27 Falls are common in patients receiving HD, 28 and it is reported that 1 in 7 patients undergoing HD suffers a major fracture after a fall. 28
While the relationship between T scores and FRAX in relation to fractures in patients is well recognized, there is a paucity of data to the additional contributions of frailty status and a history of falls in assessing the risk of fracture. The purpose of our study was to evaluate the clinical utility of adding FRAX, frailty status, and falls to T scores at the femoral neck to determine whether it is associated with fracture events in patients receiving HD therapy.
Methods
Study Population
We conducted a cross-sectional study on the patients receiving HD. A total of 220 prevalent patients receiving HD therapy >3 months at two dialysis units (Regina General Hospital and Wascana Dialysis Unit) in Regina, Saskatchewan, Canada between January 1, 2017, and December 31, 2018, were approached by the research coordinators. Patients were excluded if they did not speak English, were unable to mobilize, wheelchair dependent, had cognitive impairment, recently been discharged from the hospital, or simply refused to participate. In total, 131 of 220 adult patients (≥18 years) agreed to undergo frailty assessments at the two dialysis units. Post frailty assessments, they were referred for DXA scans and upon receipt of the results undertook FRAX questionnaires. They were additionally sent for A-P lumbar x-rays and contacted for history of falls. Previous fracture was documented based on patient’s recollection of any traumatic fracture prior to the time of assessment or presence of fracture on the vertebral x-ray. The study was approved by the Saskatchewan Health Authority Research Ethics Board (REB 18-68).
Measures
Information on patient demographics (age, sex, ethnicity), pre-dialysis weight, height, body mass index (BMI), comorbidities, laboratory measures (ie, serum calcium, phosphorus, alkaline phosphatase [ALP], and PTH), and length of time since dialysis initiation was obtained from the renal repository Medical Information Quality System (MIQS, Denver, Colorado, USA). The PTH levels were measured using the ARCHITECT Intact PTH assay (Abbott Diagnostics, Abbott Park, IL, USA), using chemiluminescent enzyme labeled immunometric assay (CMIA). PTH levels were checked every 3 months as part of routine pre dialysis lab work.
Fracture
The main outcome of interest was the presence of a self-reported nontraumatic fracture at the following sites (lumbar, ankle, arm, foot, hips, femur, knee, shoulder, elbow, leg, pelvis, toe, spine, and wrist). Nonvertebral osteoporotic fractures reported by patients were confirmed by medical records. Vertebral fractures were assessed using a lumbar spine x-ray by a single radiologist (K.G.). Vertebral fractures were classified according to Genant’s semiquantitative method, 29 which considers osteoporotic vertebral fractures as a >20% reduction of the vertebral height (anterior, posterior or middle) after excluding other causes of vertebral deformities.
T scores
BMD measurements were made on a single device (GE Lunar Corp, Madison, WI, USA) at the lumbar spine, total hip, mean of left and right femoral neck, and the one-third radius. We assessed the areal BMD (g/cm2) and T scores using the National Health and Nutrition Examination Survey reference population. 30 We also used the World Health Organization definitions of BMD categories: normal bone density (T score ≥ –1.0), low bone mass (T score between −1.0 and −2.5), and osteoporosis (T score ≤ –2.5).
FRAX scores
The FRAX algorithm for Canadian population available at www.sheffield.ac.uk/FRAX was used for the study. This algorithm consists of 11 independent and validated clinical risk factors: age, sex, predialysis weight, height, previous fracture (any low trauma fracture prior to questionnaire), parent fractured hip, current smoking, glucocorticoids, rheumatoid arthritis, secondary osteoporosis (CKD was not included), consumption of alcohol 3 or more units/day. The algorithm generates 10-year probabilities of hip and a major osteoporotic fracture (including clinical spine, forearm, hip, or shoulder fracture) from the inputted data. Fracture probability is calculated with or without BMD and an individual can have up to 4 scores: hip fracture and major osteoporotic fracture (with and without BMD). We calculated the 10-year probability of hip and major osteoporotic fracture with and without BMD.
Frailty
Frailty was measured using the Fried frailty phenotype, a valid measure of frailty that is used as a screening tool in CKD literature. All physical assessments were completed before dialysis, and questionnaires were completed during the first hour of HD treatment. The criteria include 5 physical components using a similar study conducted in the same Institution: Slowness was assessed based on a 4-meter walk (walking time >5 seconds). The time taken for the patient to walk was measured. The average time of the 2 walks was used for scoring. Weakness was assessed on handgrip strength measured using Jamar Hydraulic Hand Dynamometer (Model 5030J1, Sammons Preston Rolyan, Bolingbrook, IL, USA). Patients performed 2 attempts on the nonfistula arm. The highest value in kilograms (kg) for muscle strength was used to calculate the score. A score below an established cutoff, based on gender (male ≤30 kg, female ≤20 kg), was considered as weakness. Weight loss was based on unintentional ≥4.5kg (predialysis) reduction in weight over the preceding 12 months. Low physical activity was determined by the Paffenbarger Physical Activity Index Questionnaire (Supplemental Appendix 1). The patients were asked about the frequency and duration of activities over 1 week. A score below an established cutoff, based on gender (male <383 kcal/week and females <270 kcal/week), was considered as low activity. Exhaustion was based on 2 questions from the Center for Epidemiologic Studies Depression (CES-D) scale (Supplemental Appendix 2). A score above an established cutoff (≥2) was defined as exhaustion. Each component received a score of 0 or 1 based on the aforementioned criteria (Supplemental Appendix 3). Patients with a score of 3 or more were classified as frail, a score of 1 to 2 were defined as prefrail, and a score of 0 were considered robust.
Falls
A fall was defined as an event that resulted in dropping unintentionally to the ground. Patients were enquired about falls and frequency since initiation of kidney replacement therapy.
Statistical Analysis
The presence of fracture was considered a binary outcome. Qualitative variables were expressed as numbers and percentages and quantitative variables as mean ± standard deviation (SD) or median (interquartile range [IQR]) as appropriate. Frailty status was coded as a binary variable: frail vs nonfrail (pre-frail and robust). History of falls was also considered a binary variable. A comparison of continuous variables was performed using the 2-sided Student t test or Wilcoxon rank sum test for means and medians, respectively, and the chi-square test or Fisher exact test (where appropriate) used to compare categorical variables. To identify factors associated with the main outcomes, we first conducted the bivariate analysis for each outcome with a single variable. Then, the association between the BMD-T score, FRAX score, frailty status, falls, with fracture were examined with sequential multivariable logistic regression models. Four multivariable models were fitted separately for fracture where Model 1 included femoral neck T score (unadjusted model); Model 2 included femoral neck T score and FRAX score; Model 3 included femoral neck T score, FRAX score, and frailty status; and Model 4 included femoral neck T score, FRAX score, frailty status, and history of falls. In addition, three multivariable logistic regression models fitted separately for each T score (femoral neck, lumbar spine and one-third radius T scores). Variance inflation factors (VIFs) test was used in Models 3 to 4 to investigate the presence of multicollinearity whereas VIF > 3 consider for further investigation. We did not find any serious multicollinearity from Models 3 to 4 after including all the covariates. The area under the receiver operating characteristic curve (AUC) analysis was conducted for each model to assess its discrimination ability for fracture outcome. The improvement in model’s performance compared with the base model was assessed using likelihood ratio test (LRT). The results were expressed in terms of their adjusted odds ratio (OR) and corresponding 95% confidence intervals (CI). Differences were considered statistically significant at P values <.05. Statistical analyses were performed using R version 4.0.3.
Results
Study Population
Of the 131 patients on maintenance HD, 22 were excluded from the analysis due to missing information. A total of 109 HD patients were included in the data analysis (Figure 1). The mean time between the recruitment and BMD tests and lumbar x-rays was 6.3 ± 1.4 months. The mean age of the study population was 63.3 ± 14.2 years, 61.5% were male and 70.6% were Caucasian. The most prevalent comorbidities were hypertension (82.2%) and diabetes (59.4%). About 29% of the participants had at least one fall in the last year and 27% reported a previous fracture. The median time on dialysis (IQR) in months before the frailty assessment was 34.0 (13.0-67.0). About 64 (59.3%) were identified as frail. The median (IQR) Femoral neck T score and FRAX score for hip fracture were −2.30 (−2.90, −1.63) and 1.75 (0.50, 6.88), respectively (Table 1).

Study flowchart.
Patients’ Characteristics.
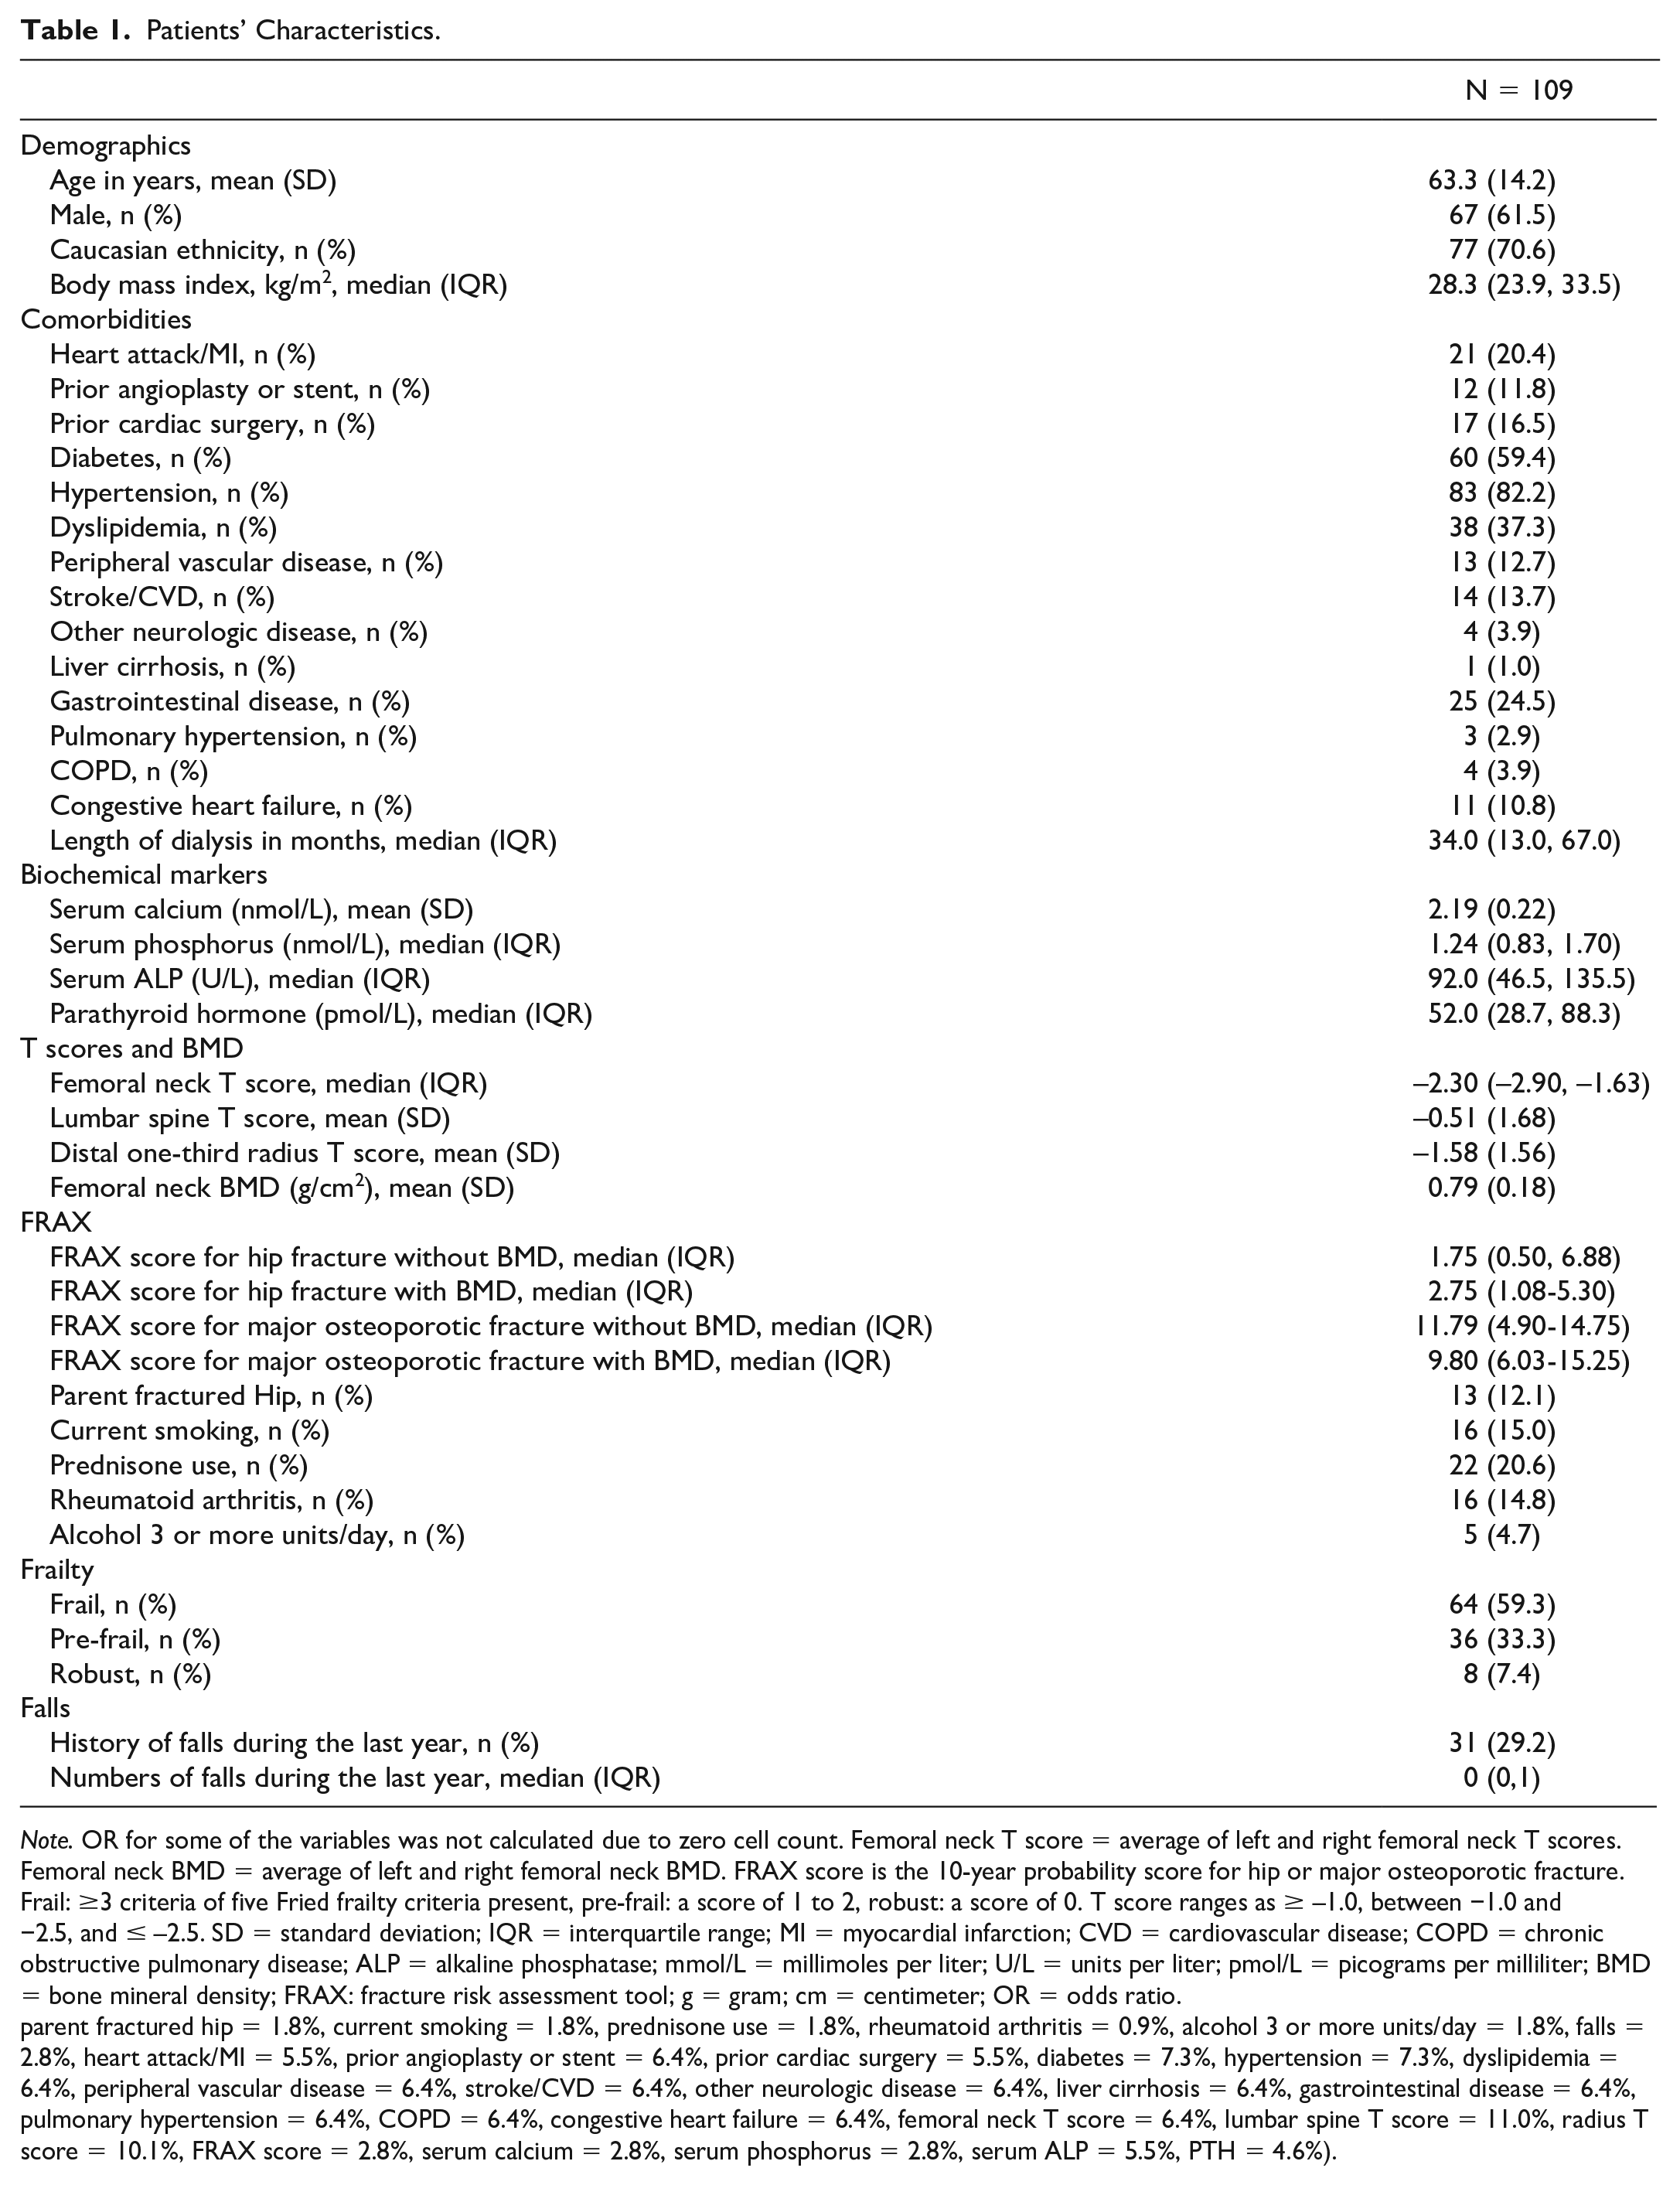
Note. OR for some of the variables was not calculated due to zero cell count. Femoral neck T score = average of left and right femoral neck T scores. Femoral neck BMD = average of left and right femoral neck BMD. FRAX score is the 10-year probability score for hip or major osteoporotic fracture. Frail: ≥3 criteria of five Fried frailty criteria present, pre-frail: a score of 1 to 2, robust: a score of 0. T score ranges as ≥ –1.0, between −1.0 and −2.5, and ≤ –2.5. SD = standard deviation; IQR = interquartile range; MI = myocardial infarction; CVD = cardiovascular disease; COPD = chronic obstructive pulmonary disease; ALP = alkaline phosphatase; mmol/L = millimoles per liter; U/L = units per liter; pmol/L = picograms per milliliter; BMD = bone mineral density; FRAX: fracture risk assessment tool; g = gram; cm = centimeter; OR = odds ratio.
parent fractured hip = 1.8%, current smoking = 1.8%, prednisone use = 1.8%, rheumatoid arthritis = 0.9%, alcohol 3 or more units/day = 1.8%, falls = 2.8%, heart attack/MI = 5.5%, prior angioplasty or stent = 6.4%, prior cardiac surgery = 5.5%, diabetes = 7.3%, hypertension = 7.3%, dyslipidemia = 6.4%, peripheral vascular disease = 6.4%, stroke/CVD = 6.4%, other neurologic disease = 6.4%, liver cirrhosis = 6.4%, gastrointestinal disease = 6.4%, pulmonary hypertension = 6.4%, COPD = 6.4%, congestive heart failure = 6.4%, femoral neck T score = 6.4%, lumbar spine T score = 11.0%, radius T score = 10.1%, FRAX score = 2.8%, serum calcium = 2.8%, serum phosphorus = 2.8%, serum ALP = 5.5%, PTH = 4.6%).
Fracture in Patients on HD
The composite of fracture occurred in 41 of 109 (37.6%) of patients. Mean age was higher among the fracture group compared with nonfracture group patients (66.8 ± 13.2 vs 61.3 ± 14.4, P = .045). The median (IQR) femoral neck T score was significantly lower among those who experienced fracture as compared with those who did not fracture (–2.55 [−3.29, −2.01] vs −2.1 [−2.70, −1.40], P = .004). In addition, the median (IQR) FRAX score (for hip fracture) without BMD was significantly higher in fracture group patients compared with nonfracture group patients (3.2 [1.10, 10.00] vs 1.0 [0.30, 3.20], P < .001). Similarly, the median (IQR) FRAX score (for major osteoporotic fracture) without BMD was significantly higher in fracture group patients as opposed to nonfracture group patients (14.0 [8.10-25.0] vs 6.50 [4.0-10.0], P < .001). Fall and frailty were numerically higher in fracture group patients compared with nonfracture group patients (37.5% vs 24.2 and 63.4% vs 56.7%, respectively). There were no differences in biochemical biomarkers of mineral bone metabolism including, serum calcium, serum phosphorus, serum ALP, and PTH between both the groups (Table 2).
Patients’ Characteristics by Fracture Status.

Note. OR for some of the variables was not calculated due to zero cell count. Femoral neck T score = average of left and right femoral neck T scores. Femoral neck BMD = average of left and right femoral neck BMD. FRAX score is the 10-year probability score for hip or major osteoporotic fracture. Frailty was measured using the Fried frailty phenotype. Frail: ≥ 3 criteria of five Fried frailty criteria present, pre-frail: a score of 1 to 2, robust: a score of 0. T score ranges as ≥ –1.0, between −1.0 and −2.5, and ≤ –2.5. OR = odds ratio; CI = confidence interval; SD = standard deviation; IQR = interquartile range; MI = myocardial infarction; CVD = cardiovascular disease; N/A = not applicable; COPD = chronic obstructive pulmonary disease; ALP = alkaline phosphatase; mmol/L = millimoles per liter; U/L = units per liter; pmol/L = picograms per milliliter; PTH = parathyroid hormone; BMD = bone mineral density; g = gram; cm = centimeter; FRAX = fracture risk assessment tool; ALP = alkaline phosphatase.
Missing information is as follows: (parent fractured hip = 1.8%, current smoking = 1.8%, prednisone use = 1.8%, rheumatoid arthritis = 0.9%, alcohol 3 or more units/day = 1.8%, falls = 2.8%, heart attack/MI = 5.5%, prior angioplasty or stent = 6.4%, prior cardiac surgery = 5.5%, diabetes = 7.3%, hypertension = 7.3%, dyslipidemia = 6.4%, peripheral vascular disease = 6.4%, stroke/CVD = 6.4%, other neurologic disease = 6.4%, liver cirrhosis = 6.4%, gastrointestinal disease = 6.4%, pulmonary hypertension = 6.4%, COPD = 6.4%, congestive heart failure = 6.4%, femoral neck T score = 6.4%, Lumbar spine T score = 11.0%, radius T score = 10.1%, FRAX score = 2.8%, serum calcium = 2.8%, serum phosphorus = 2.8%, serum ALP = 5.5%, PTH = 4.6%).
We conducted multiple logistic regression analyses with fracture as the dependent variable. The associations between femoral neck T score, FRAX score, frailty status, and falls are shown in Table 3. In an unadjusted model (Model 1), each lower SD in femoral neck T score was associated with 48% higher odds of fracture (OR = 1.48;95% CI 1.20-1.68, P = .005). In Model 2 (addition of FRAX score for hip fracture), with the inclusion for FRAX scores (hip), the OR for fracture remained significant at 1.38 (OR = 1.38, 95% CI 1.04-1.63, P = .043) (Table 3).
Multivariable Logistic Regression Analyses for Fracture.
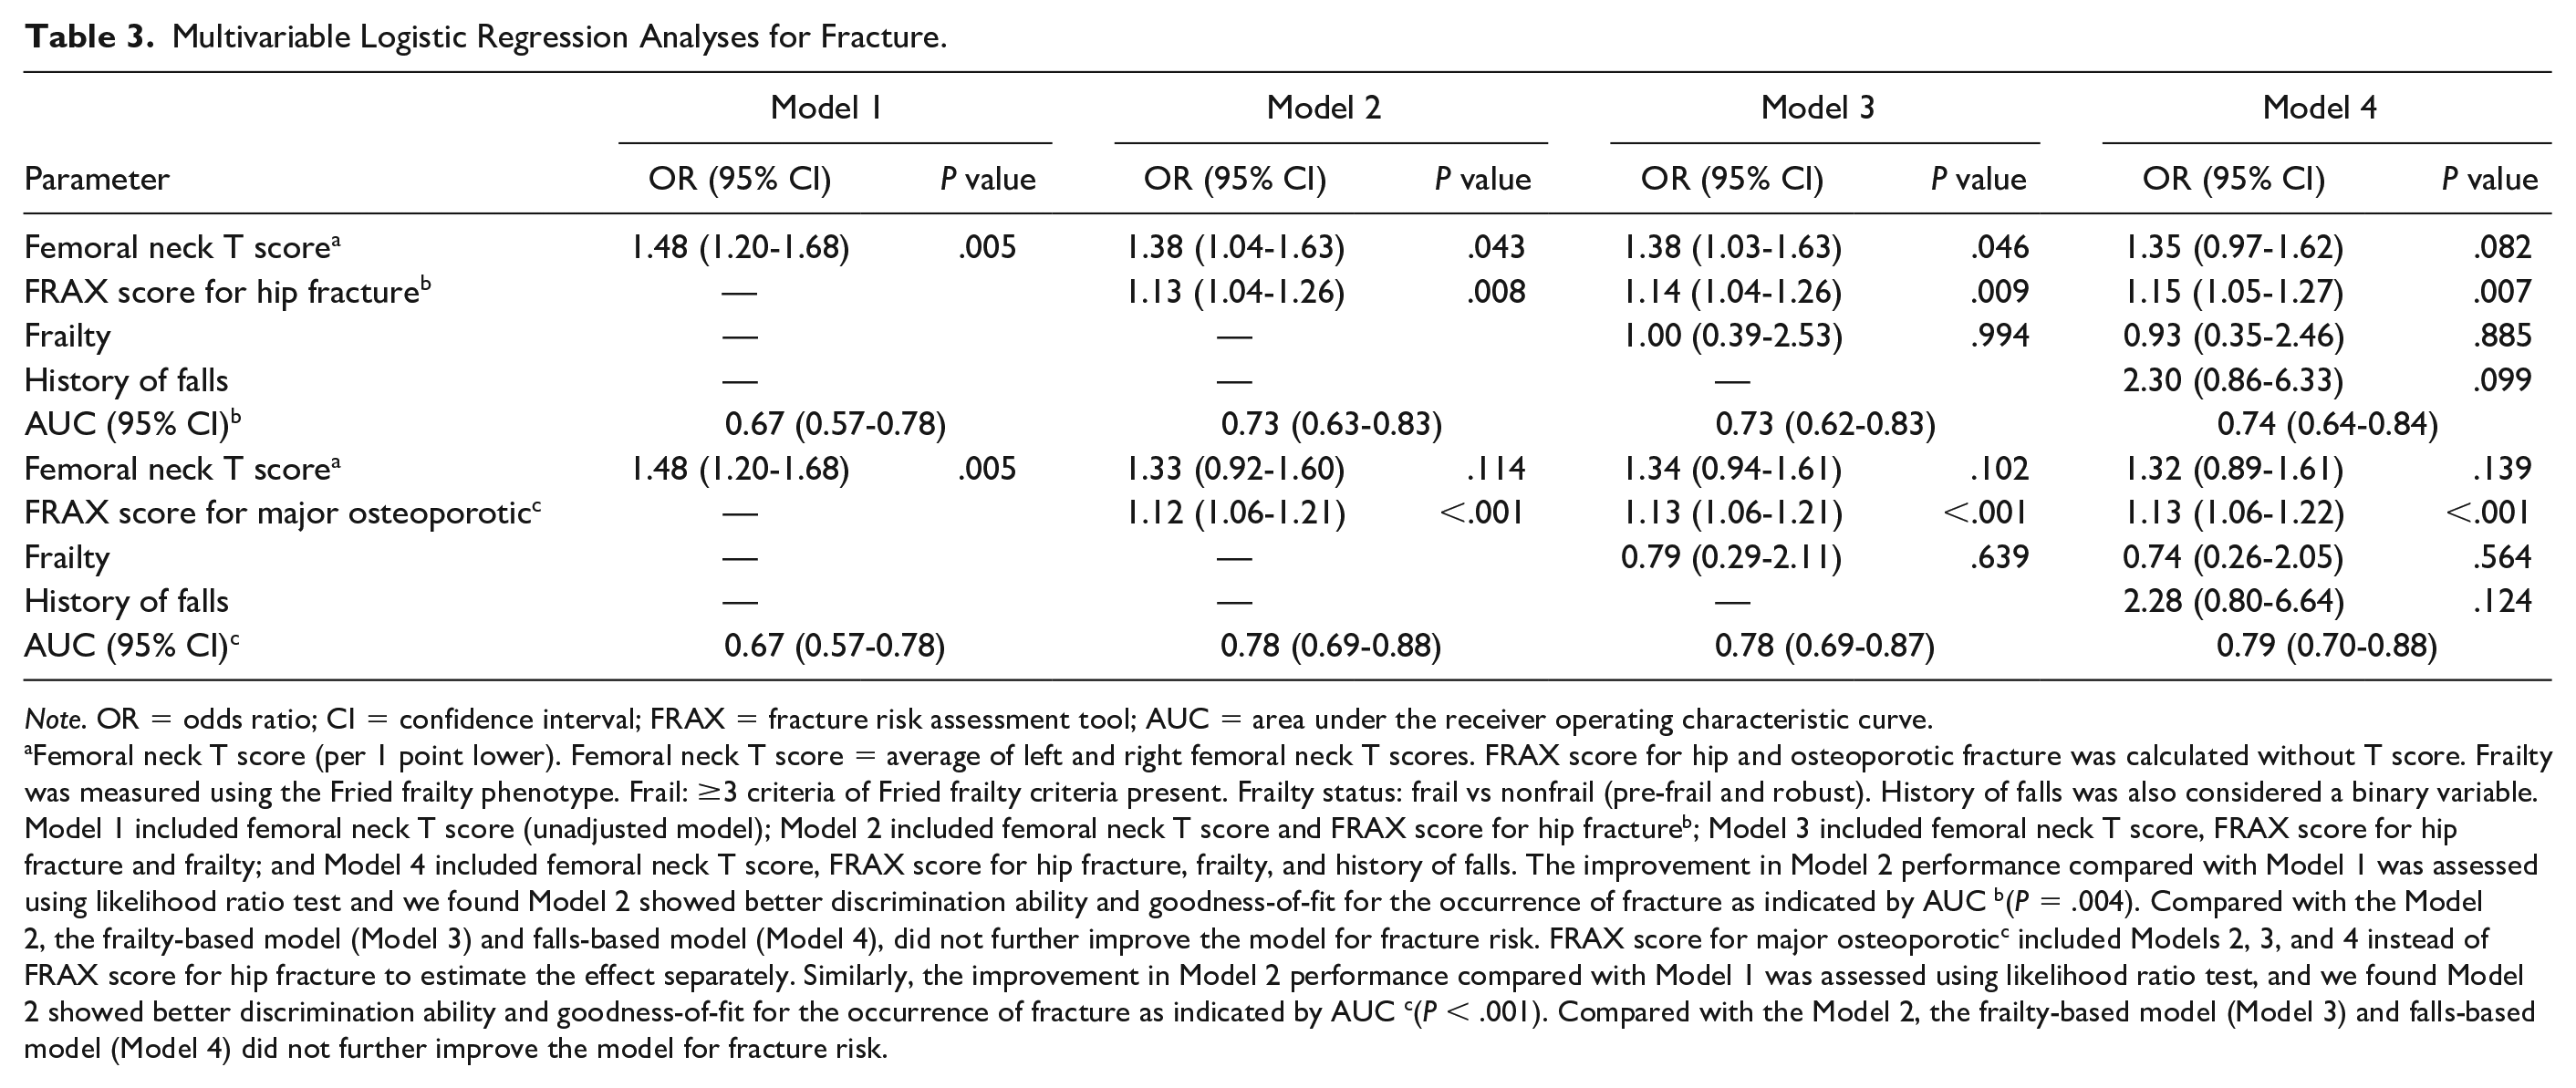
Note. OR = odds ratio; CI = confidence interval; FRAX = fracture risk assessment tool; AUC = area under the receiver operating characteristic curve.
Femoral neck T score (per 1 point lower). Femoral neck T score = average of left and right femoral neck T scores. FRAX score for hip and osteoporotic fracture was calculated without T score. Frailty was measured using the Fried frailty phenotype. Frail: ≥3 criteria of Fried frailty criteria present. Frailty status: frail vs nonfrail (pre-frail and robust). History of falls was also considered a binary variable. Model 1 included femoral neck T score (unadjusted model); Model 2 included femoral neck T score and FRAX score for hip fractureb; Model 3 included femoral neck T score, FRAX score for hip fracture and frailty; and Model 4 included femoral neck T score, FRAX score for hip fracture, frailty, and history of falls. The improvement in Model 2 performance compared with Model 1 was assessed using likelihood ratio test and we found Model 2 showed better discrimination ability and goodness-of-fit for the occurrence of fracture as indicated by AUC b(P = .004). Compared with the Model 2, the frailty-based model (Model 3) and falls-based model (Model 4), did not further improve the model for fracture risk. FRAX score for major osteoporoticc included Models 2, 3, and 4 instead of FRAX score for hip fracture to estimate the effect separately. Similarly, the improvement in Model 2 performance compared with Model 1 was assessed using likelihood ratio test, and we found Model 2 showed better discrimination ability and goodness-of-fit for the occurrence of fracture as indicated by AUC c(P < .001). Compared with the Model 2, the frailty-based model (Model 3) and falls-based model (Model 4) did not further improve the model for fracture risk.
The improvement in Model 2 performance compared with Model 1 was assessed using likelihood ratio test and we found Model 2 showed better discrimination ability and goodness-of-fit for fracture as indicated by AUC (P = .004). Compared with the Model 2, there was no improvement with the frailty-based model (Model 3) and falls-based model (Model 4) (Table 3). In addition to femoral neck T score, we also evaluated the association between lumbar spine T score and distal one-third radius T score with fracture (Tables 4 and 5). Multivariable logistic regression models were fitted separately for each T score (femoral neck, lumbar spine and radius T scores). Each of the multivariable adjustments included FRAX score for hip fracture (Table 4) and FRAX score for osteoporotic fracture (Table 5). After adjusting for FRAX score for hip fracture, there was no significant association between lumbar spine T score (OR = 1.14, 95% CI: 0.88-1.36, P = .280) and distal one-third radius T score (OR = 1.15, 95 % CI: 0.86-1.37, P = .283) and fracture. With a one-point femoral neck T score decrease, the odds ratio for fracture was 1.38 (95% CI 1.04-1.63, P = .043) (Table 4).
Adjusted Association of T Scores at Different Sites With Fracture (Adjusted for FRAX Score for Hip Fracture).

Note. Multivariable logistic regression models were fitted separately for each T score (Femoral neck, Lumbar spine, and Radius T scores). Each of the multivariable adjustments included FRAX score for hip fracture. FRAX = fracture risk assessment tool; OR = odds ratio; CI = confidence interval; AUC = area under the receiver operating characteristic curve.
Adjusted Association of T Scores at Different Sites With Fracture (Adjusted for FRAX Score for Major Osteoporotic Fracture).
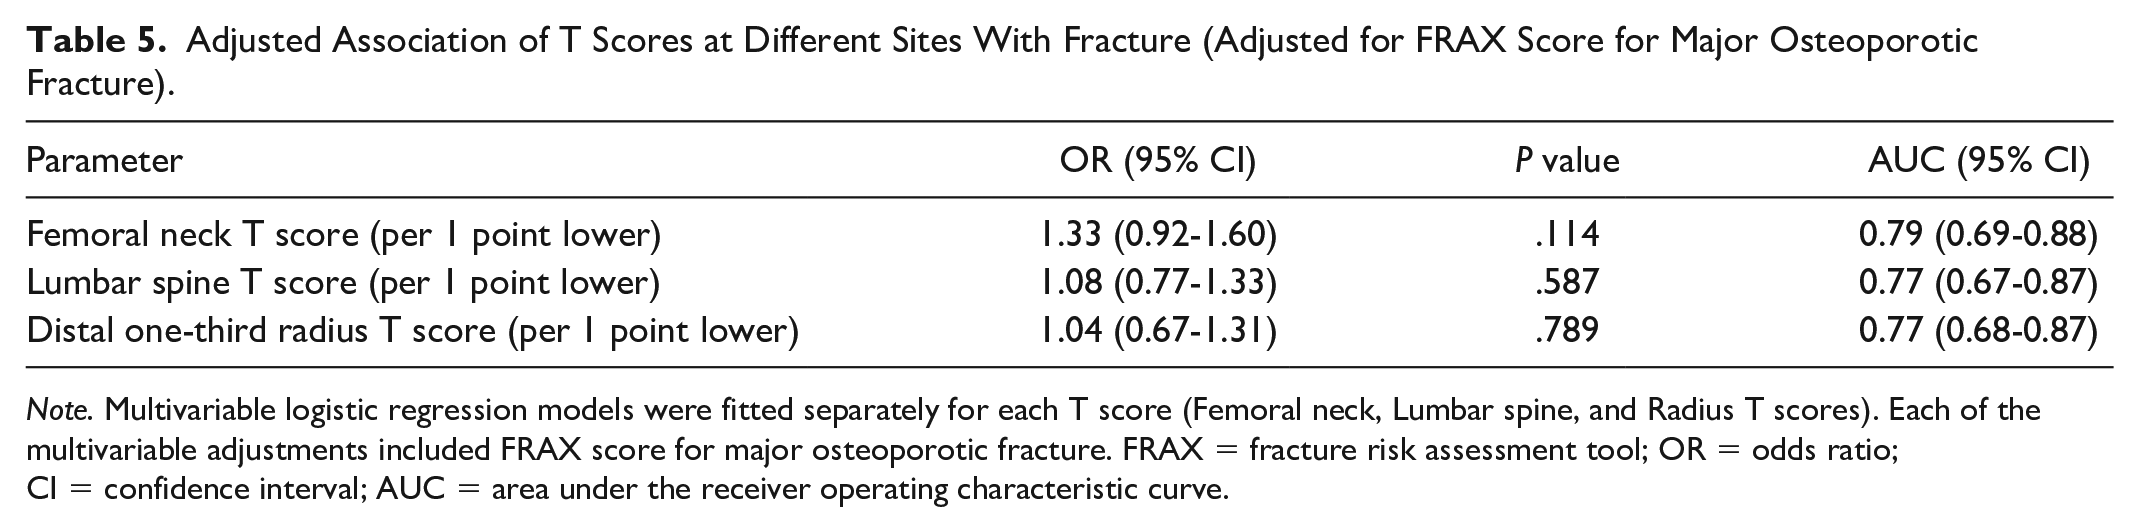
Note. Multivariable logistic regression models were fitted separately for each T score (Femoral neck, Lumbar spine, and Radius T scores). Each of the multivariable adjustments included FRAX score for major osteoporotic fracture. FRAX = fracture risk assessment tool; OR = odds ratio; CI = confidence interval; AUC = area under the receiver operating characteristic curve.
Discussion
In this study, we show that T scores and FRAX scores are associated with fracture in prevalent patients on HD. While patients with fractures had more falls and higher frailty scores, it did not meet statistical significance. Our study adds to the emerging literature that both T scores and FRAX scores are valuable tools for clinicians for assessing its association with fractures in patients on HD. This is the first study to our knowledge that looked at the independent contribution of frailty and falls in addition to T scores and FRAX in patients on HD.
The incidence of peripheral fractures (humerus, forearm, and hip), as well as axial fractures (pelvis), increases progressively with the decline in estimated glomerular filtration rate in patients with CKD G3-5.31,32 Patients with kidney failure on dialysis have a nonvertebral fracture risk that is 4 to 6 fold greater than age and gender matched controls.33,34 In addition, once patients on dialysis experience a fracture, there is a 2 to 3 fold higher hospitalization stay and 3 to 4 fold higher mortality.35,36 Health care costs associated with osteoporotic fractures are substantial and run into hundreds of millions of dollars.37,38 Despite the clinical, financial, economic impact of fractures with increased morbidity and mortality in patients treated with kidney replacement therapy, there is an absence of a standardized and valid method for screening.
In non-CKD patients, the reduction of one SD in BMD as measured by DXA doubles the fracture risk and is therefore the main instrument to evaluate bone fragility. Many cross-sectional and prospective population studies indicate that the risk of fracture increases by a factor of 1.5 to 3.0 for each 1 SD decrease in BMD. 39 Prospective studies have shown good predictive value for BMD for risk of fracture in CKD G3-5. 40 Routine DXA testing (screening) in all CKD G4-G5D patients is not supported by current evidence. 22 A recent European consensus statement suggested that in patients with CKD G4-G5D, DXA be considered in postmenopausal women, and in men >50 years of age. In our study, we show that a 1 SD decrease in T scores increases the odds of fracture (OR: 1.48, P = .005). Patients who fractured had a lower T score (−2.55 vs −2.10, P = .004) at the femoral neck and at the distal one-third radius (−1.97 vs −1.35, P = .05). We requested a lumbar x-ray to ensure that fractures were not missed due to advanced age and high burden of cognitive impairment in patients on dialysis. We were able to identify 13 additional patients on vertebral imaging. Our study supports the need for vertebral imaging as part of fracture screening and the recently published European Consensus statement recommended vertebral fracture assessment (VFA) and/or lateral spine imaging in all patients undergoing DXA evaluation. 22
The realization that the majority of low-trauma fractures occur in those with T scores that fall above the osteoporotic range (<−2.5) led to the creation of fracture risk assessment scores. These tools were primarily created for people living in the community and early studies did not include patients with CKD or dialysis. 41 FRAX is a web-based online tool and includes 11 independent and validated clinical risk factors. These non-BMD factors have been shown to add to the gradient of risk to more accurately predict fracture risk in the individual patient.42,43 The additional utility of FRAX over and above BMD measurements especially in patients with kidney failure has been established in a recent study. 11 In our study, we did not add CKD as a secondary cause of osteoporosis as it does not capture all the complexities of CKD-MBD. 44 We calculated 10-year probability score for major osteoporotic fracture with and without BMD and compared with the patients who did not fracture, the odds ratio of a fracture was 1.14 (P = <.001) and 1.13 (P = <.001) . Our study is similar to other studies that have shown that the discriminative ability of FRAX to predict major osteoporotic fracture in CKD patients 45 as well as on HD. 11
Frailty is a clinical state marked by a loss of resilience and diminished capacity to respond to health stressors 46 and is associated with adverse outcomes in patients recieving. 47 For clinical purposes, frailty has been divided into 3 constructs: physical construct (frailty phenotype), subjective construct (frailty score), and deficit construct (frailty index). 23 In our study, we looked at the physical construct (Fried frailty phenotype), 46 60% of patients in our cohort were frail (score >3) and compared to the patients who did not fracture (63% vs 56%), the odds ratio of a fracture was 1.32. Our data are similar to Delgado et al that frail patients on HD experienced nearly twice the risk of urgent falls or fractures compared with nonfrail patients. 25 It is well recognized that frailty worsens with time on dialysis, 47 and we noticed that frail patients had a higher vintage (43 months) in comparison with nonfrail patients (29 months). Our data suggest that while frailty is more common in patients with fracture, it did not meet statistical significance. Despite the near ubiquitous prevalence of frailty and pre frailty in patients receiving HD, programs across Canada have not adopted frailty assessments as the standard of care due to time intense nature of evaluations and resource utilization. While frailty and fractures have been well studied in the non-CKD population,48-50 there is only one reported study in the prevalent HD population. 25 So far, frailty has not been shown to independently associate with fracture risk once traditional risk factors are considered.
Another important risk factor for fractures is falls. Despite the fact that patients receiving HD present many classical risk factors for falls, very few studies have evaluated prospectively the risk of severe falls in this population. Falls also lead to loss of independence, institutionalization, hospitalization, and mortality. There are multiple factors that contribute to falls as muscle weakness, polypharmacy, comorbidities, neuropathy, cognitive impairment, impaired mobility, and frailty of which are all highly prevalent in CKD patients. 2 One in 7 patients undergoing chronic HD experiences a major bone fracture after a fall. 51 In addition, fractures double the mortality risk in this population. 52 In our study, 29% of patients in our cohort experienced a fall, compared with the patients who did not fracture (37% vs 24%); the OR of a fall associated with a fracture was 2.36. However, the stated difference did not meet statistical significance. The relatively limited number of patients included in this single center study may have decreased its statistical power to define predictive values for severe falls in this population. We believe that this finding should be confirmed in a larger study with a greater number of fracture outcomes. 53
The strengths of this study were the use of BMD and FRAX both of which have been validated in the HD population. Additional strengths include direct measurement of a validated, objective frailty instrument, granular ascertainment of comorbidities using medical records abstraction, confirmation of self-reported fractures by medical records, and vertebral imaging to capture unreported fractures. The study has a few limitations. The relatively small number of patients in our cohort limited our statistical power. Falls were self-reported and subject to recall bias. However, even given the small number of patients, all of the AUC values for hip fracture prediction were statistically significant for T scores and FRAX. As with any cross-sectional study, associations identified may be difficult to interpret. The generalizability of our findings may be limited as the majority of our sample was white (70%). We excluded the wheelchair-bound patients as it would have placed an unnecessary burden on their family members and caregivers to travel for x-rays and DXA scans. In our study, the physical construct of frailty was used and there might have been a difference if the subjective or deficit construct was used for assessment.
Conclusions
In summary, both BMD measurements by DXA and FRAX are useful tools to assess for fracture in patients receiving HD. The clinical, societal, and economic impact of fractures necessitates an active response from the HD programs. Results of this study should lead to prospective studies with larger sample sizes prior to DXA scans, FRAX, and falls assessment being recommended as standards of care.
Supplemental Material
sj-pdf-1-cjk-10.1177_20543581211041184 – Supplemental material for T Scores, FRAX, Frailty Phenotype, Falls, and Its Relationship to Fractures in Patients on Maintenance Hemodialysis
Supplemental material, sj-pdf-1-cjk-10.1177_20543581211041184 for T Scores, FRAX, Frailty Phenotype, Falls, and Its Relationship to Fractures in Patients on Maintenance Hemodialysis by Maryam Jafari, Salman Anwar, Kaval Kour, Shubrandu Sanjoy, Kunal Goyal and Bhanu Prasad in Canadian Journal of Kidney Health and Disease
Footnotes
Acknowledgements
The authors thank the Research Department, Saskatchewan Health Authority for assistance with statistical analysis.
Ethics Approval and Consent to Participate
The study was approved by the Saskatchewan Health Authority Research Ethics Board (REB-18-68).
Consent for Publication
Not applicable as there is no patient identifying information in this article.
Availability of Data and Materials
The data sets used and/or analyzed during the current study are available from the corresponding author on reasonable request.
Author Contributions
B.P. conceived and designed the study. He assisted with the initial drafts and also edited the final manuscript. M.J. wrote the initial draft. S.A. and K.K. performed patient assessments and assisted with the manuscript drafts. S.S. performed the statistical analysis. G.K. assessed vertebral fractures using lumbar x-rays and assisted with the manuscript drafts. All authors read and approved the final manuscript.
Declaration of Conflicting Interests
The author(s) declared no potential conflicts of interest with respect to the research, authorship, and/or publication of this article.
Funding
The author(s) received no financial support for the research, authorship, and/or publication of this article.
Supplemental Material
Supplemental material for this article is available online.
References
Supplementary Material
Please find the following supplemental material available below.
For Open Access articles published under a Creative Commons License, all supplemental material carries the same license as the article it is associated with.
For non-Open Access articles published, all supplemental material carries a non-exclusive license, and permission requests for re-use of supplemental material or any part of supplemental material shall be sent directly to the copyright owner as specified in the copyright notice associated with the article.