
Abstract
Background:
The kidney failure risk equation (KFRE) is a validated risk algorithm for predicting the risk of kidney failure in chronic kidney disease (CKD) patients regardless of etiology. Patients with autosomal dominant polycystic kidney disease (AD-PCKD) experience long disease trajectories and as such identifying individuals at risk of kidney failure would aid in intervention
Objective:
To examine the utility of the KFRE in predicting adverse kidney outcomes compared with existing risk factors in a cohort of patients with AD-PCKD.
Methods:
Retrospective cohort study of AD-PCKD patients referred to a tertiary care center with a baseline kidney ultrasound and a KFRE calculation. Cox proportional hazards were used to examine the association of the KFRE and composite of an eGFR decline of >30% or the need for dialysis/transplantation. Discrimination and calibration of a parsimonious fully adjusted model and a model containing only total kidney volume (TKV) with and without the addition of the KFRE was determined.
Results:
Of 340 patients with AD-PCKD eligible, 221 (65%) met inclusion criteria. Older age, cardiac disease, cancer, higher systolic blood pressure, albuminuria, lower eGFR and a higher initial TKV were more common in patients with a higher KFRE. A total of 120 events occurred over a median patient follow-up time of 3.2 years. KFRE was independently associated with the composite kidney outcome. Addition of the KFRE significantly improved discrimination and calibration in a TKV only model and a fully adjusted model.
Conclusions:
In a diverse, referral population with AD-PCKD, the KFRE was associated with adverse kidney outcomes and improved risk prediction.
What was known before
KFRE predicts end-stage kidney disease in patients with chronic kidney disease. TKV in patients with AD-PCKD is associated with rapid progression to kidney failure.
What this adds
Addition of KFRE to TKV improves risk prediction in patients with AD-PCKD. The best model for risk prediction in AD-PCKD includes KFRE, age, sex, hypertension, systolic blood pressure and TKV.
Introduction
The ability to correctly identify patients with autosomal dominant polycystic kidney disease (AD-PCKD) at risk for disease progression is a key research initiative as it facilitates monitoring and management of complications, use of therapeutic interventions, enrollment in clinical trials and renal replacement planning. As such, multiple studies to date have identified key risk factors (demographics, clinical characteristics, genetics, and radiographic features) associated with disease progression in patients with AD-PCKD.1-6
The kidney failure risk equation (KFRE) is a simple risk equation to predict the 2- and 5-year need for renal replacement therapy (RRT). 7 It has been validated in a large cohort of patients with chronic kidney disease (CKD).8,9 The equation relies on age, sex, estimated glomerular filtration rate (eGFR), and spot urine albumin-to-creatinine ratio (ACR) to predict the outcome of RRT. It has been incorporated into health policy and adopted for use in multiple jurisdictions. 10 The KFRE’s accurate predictive ability, ease of use, and ready availability as an online, web-based calculator facilitate its broad appeal.
Intervention to delay progression of AD-PCKD needs to be implemented early for maximum benefit. For example, if the decline of GFR is at a rate of 5 mL/min/year and an intervention decreases the rate of decline of GFR by 2 mL/min/year then if intervention is started at GFR of 30 mL/min, the patient will reach end-stage renal disease (ESRD) 2 years later where as if patient starts treatment at 60 mL/min, the patient will reach ESRD 6 years later.
The total kidney volume (TKV) of the kidney is an independent risk factor of disease progression in AD-PCKD and has recently been demonstrated to predict a decline in eGFR > 30% from baseline,11,12 although it has not been endorsed for clinical decision making. The purpose of the current study is to examine the utility of the KFRE in predicting adverse kidney outcomes (eGFR decline > 30% or RRT) compared with existing risk factors in a referred, real-world cohort of patients with AD-PCKD.
Materials and Methods
Design and Setting
This is a retrospective cohort study of patients who were referred to Nephrology at a tertiary care center from January 01, 2010, to June 30, 2017. The tertiary care Nephrology provides service for a catchment area of approximately 1.2 million individuals in Eastern Ontario, Canada. The first clinic visit was deemed the date of study entry. The study was reviewed and approved by the Ottawa Health Sciences Network Research Ethics Board.
Data Collection
Data were abstracted from clinical charts and electronic medical records for all patients by trained personnel starting January 01, 2018. Variables collected include demographics (age, sex), co-morbidities (cardiac disease, cancer, diabetes, hypertension, hyperlipidemia), outcomes with dates (death, dialysis initiation) and longitudinal laboratory measures (proteinuria, eGFR calculated by CKD-epi equation), and physiologic parameters (systolic blood pressure [SBP]). Comorbidities were defined by the attending physician. Genetic testing for PCKD is not routinely performed at our center and thereby was not included. The first available or referral blood pressure measurement was collected. The first available ultrasound was used to obtain kidney measurements and read by a single physician to reduce intra-observer variability. All the scans were performed at a single center. TKV was calculated by equation for an ellipsoid (TKV = 0.523 × L × W × AP, where L = length, W = width and AP = anteroposterior diameter of kidney). 13
Study cohort
The study population consisted of all individuals referred to our center with a diagnosis of AD-PCKD as determined by their primary nephrologist. Patients were excluded if kidney ultrasound or ACR, or eGFR value were missing. The referral date or first clinical visit was used as the index date.
Outcomes and Exposures
The main predictor of interest was the kidney failure risk as calculated by the 4 variable 2-year KFRE. The first available or referral serum creatinine and ACR were used to determine the kidney failure risk. The study outcome was a composite of (1) eGFR decline ≥30% from baseline and/or (2) the need for RRT (initiation of dialysis or preemptive transplantation). eGFR decline ≥30% was examined as the time to decline of ≥30% from baseline analyzed as a categorical variable. The eGFR and need for RRT were assessed at each study visit.
Statistical Analysis
Baseline descriptive statistics classified by categories of KFRE calculated risks (<1%, 1%-5%, >5%) are presented as mean/standard deviation or median/interquartile range for continuous variables and frequency and proportion for categorical variables. The proportion of each study outcome was examined for the total cohort and stratified by baseline eGFR (< or > eGFR 50 mL/min/1.73 m2) and baseline TKV (< or > 1000 cm3) to compare baseline characteristics. The association of categorized KFRE (<1%, 1%-5%, >5%) and the study outcome was examined by the Kaplan-Meier method for the total cohort, eGFR, and TKV strata. Statistical significance was determined by the log-rank test. The independent association of KFRE was examined using a fully adjusted Cox proportional hazards model including previously reported significant risk factors (age, sex, hypertension, systolic blood pressure, and TKV). In the Cox model, KFRE, SBP, and TKV were modeled as continuous predictors. The proportionality assumption was examined using K-M plots stratified by the exposure. To examine model discrimination with and without the KFRE, the c-statistic at 1-, 3- and 5-year time points was determined using logistic regression. Separate c-statistics were determined for models including the following: (1) KFRE, (2) eGFR, (3) TKV, (4) KFRE + TKV, (5) KFRE + the fully adjusted model described above. The c-statistic at 1-, 3-, and 5- year was determined for models containing the KFRE + TKV and KFRE + fully adjusted model by eGFR groups (> or < 50) and TKV (< or > 1000). To determine whether model discrimination improved with the addition of the KFRE, the delta AUC and integrated discrimination index (IDI) were calculated for models with the KFRE + TKV and KFRE + the “best model” and compared with models without the KFRE. The “best” model consisted of age, sex, hypertension, systolic blood pressure, and TKV. Further comparisons of the delta AUC and IDI were calculated for models containing the KFRE + the “best” model and the baseline eGFR + the “best” model. Multicollinearity was examined using correlations and variance inflation factors. Calibration was examined by plotting predicted/observed probabilities in deciles for the KFRE + TKV and KFRE + fully adjusted models. All statistical analyses were conducted using SAS v.9.4.
Results
Study Cohort
A total of 340 patients with AD-PCKD were referred to our tertiary care center during the study period with 108 (34%) excluded due to no referral ultrasound and 11 (2.3%) excluded due to a lack of a baseline eGFR or ACR leaving a final study cohort of 221. Overall 54.8% of the AD-PCKD cohort was females. Baseline characteristics by KFRE risk categories are presented in Table 1. A higher KFRE was more common in patients of advanced age, males, past history of hypertension, cardiac disease, cancer, and hyperlipidemia. Systolic blood pressure and ACR were higher in those with a higher KFRE risk. A total of 99 (48%) and 92 (42%) patients had a baseline eGFR < 50 mL/min and a TKV > 1000 cm3, respectively. Almost 30% of the study cohort had an initial eGFR of <50 mL/min with a lower eGFR and higher TKV more common in those at highest calculated risk.
Baseline Characteristics of Autosomal Dominant Polycystic Kidney Disease Patients by KFRE Risk Groups.

Note. KFRE = kidney risk failure equation; DM = diabetes mellitus; SBP = systolic blood pressure; DBP = diastolic blood pressure; ACR = urine albumin-to-creatinine ratio; IQR = interquartile range.
One-way analysis of variance.
Kruskal-Wallis.
Kidney-Related Outcomes
A total of 120 (54%) experienced the composite outcome during the study period A higher KFRE was more common in patients reaching the study outcome (over 80% with a KFRE>1% in the total cohort) and this was consistent in patients with an initial eGFR < 50 or TKV > 1000. KFRE groups were associated with the time to the study outcome (log rank P value < .0001, see Figure 1) and this was consistent when stratified by baseline eGFR or TKV (see Figure 2, log rank P value < .0001 for all). The KFRE was independently associated with an eGFR decline of >30% or RRT (hazard ratio: 1.05, 95% confidence interval: 1.04-1.05 per 1% increase, see Table 2).
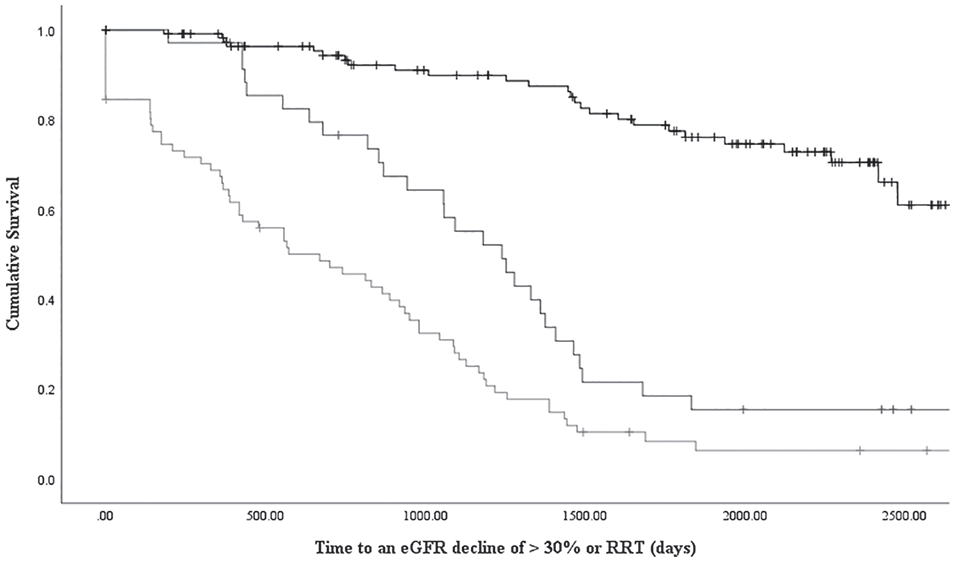
Kaplan-Meier survival curve for time to an eGFR decline of > 30% or renal replacement therapy by KFRE risk (>5% black, 1-5% dark grey, <1% light grey: p value < 0.0001 by log rank test).

Kaplan-Meier survival curves for time to an eGFR decline of > 30% or renal replacement therapy by KFRE risk (>5% black, 1-5% dark grey, <1% light grey) for the following strata: A. TKV<1000cm3, B. TKV > 1000 cm3, C. baseline eGFR <50 ml/min, D. baseline eGFR > 50 ml/min; p values < 0.0001 by log rank test for all.
Final Multivariable Cox Proportional Hazards Model for the Study Outcome of Estimated Glomerular Filtration Rate Decline of >30% or Renal Replacement Therapy.

Discrimination and Calibration With the KFRE
In a model examining the KFRE alone, the c-statistic was numerically higher or similar to models containing TKV or eGFR alone at 1, 3, and 5 years (see Table 3). The addition of the KFRE to a model containing TKV and a fully adjusted model resulted in c-statistics ranging between 0.73-0.78 and 0.75-0.84, respectively. Model discrimination was better in patients with an initial eGFR < 50 for TKV + KFRE and KFRE + a “best” model with c-statistics ranging from 0.73-0.86 and 0.77-0.91, respectively (see Table 4). The addition of the KFRE significantly improved the delta AUC and IDI at 1-, 3- and 5-year time points relative to TKV or the “best” model (see Table 5, P < .05 for all). The largest improvements in AUC and IDI with the KFRE were for discriminating shorter temporal risks (1 year). The observed probability of kidney outcomes with TKV + KFRE demonstrated consistency with the predicted probability with the exception being underestimation in 1 decile (see Figure 3). Of note, there were no low probability observations (<.4) in our cohort. The KFRE + “best” model demonstrated improved visual calibration with no deviations between the observed/predicted probabilities outside of the confidence intervals of observed probabilities (see Figure 4). To examine whether the model discrimination differed between KFRE and eGFR, a KFRE + “best” model was compared with an eGFR + “best” model. The KFRE demonstrated better c-statistics at all 3 time points, improvements in the AUC and IDI (see Supplemental Table).
C-Statistic for Various Models Predicting eGFR Decline >30% or Renal Replacement Therapy at 1, 3, and 5 Years.

Note. eGFR = estimated glomerular filtration rate; RRT = renal replacement therapy; KFRE = kidney risk failure equation; TKV = total kidney volume.
Best model includes age, sex, hypertension, systolic blood pressure, and TKV.
C-statistic for Various Models Predicting eGFR Decline >30% or Renal Replacement Therapy at 1, 3, and 5 Years Stratified by Baseline eGFR Greater or Less Than 50 mL/min/1.73 m2.

Note. eGFR = estimated glomerular filtration rate; RRT = renal replacement therapy; KFRE = kidney risk failure equation; TKV = total kidney volume.
Best model includes age, sex, hypertension, systolic bp, TKV.
Delta C-Statistic and Integrated Discrimination Index Comparing the Addition of KFRE to (1) TKV and (2) Best Model in Predicting the 5-Year Risk of a 30% Decline in eGFR or RRT.

Note. KFRE = kidney risk failure equation; TKV = total kidney volume; AUC: area under the curve; eGFR = estimated glomerular filtration rate; RRT = renal replacement therapy; IDI = integrated discrimination index.
Best model includes age, sex, hypertension, systolic bp, TKV.
All P values <.05.

Predicted versus observed probabilities for prediction model of 30% decline in eGFR or RRT with KFRE in addition to TKV.

Predicted versus observed probabilities for prediction model of 30% decline in eGFR or RRT with KFRE in addition to a “best” model. Calibration plot for eGFR decline of 30% or RRT with best model and KFRE.
Discussion
In a referred cohort of AD-PCKD patients across all ranges of CKD stage, we demonstrated the KFRE is associated with adverse kidney outcomes and adds incremental risk prediction information to existing identified risk factors. The KFRE was independently associated with an eGFR decline of 30% from baseline or the requirement of RRT. The KFRE significantly improved model discrimination relative to a model including total kidney volume only and a fully adjusted model with good calibration.
A number of risk models specific to AD-PCKD have been developed identifying clinical, laboratory, and genetic associated with a variety of disease outcomes.12,14-16 The use of KFRE for AD-PCKD risk prediction has a number of appealing aspects. It is readily available as an online calculator (https://kidneyfailurerisk.com/), easy to calculate, does not require disease-specific testing (outside of kidney imaging that would be done to confirm the diagnosis) and can be determined using administrative data at the population-level. Previous models, although potentially more accurate, may require sophisticated genetic testing that may not be universally available in non-academic settings, a detailed past medical history of PCKD-related complications (hematuria) or experimental biomarkers. As such, the KFRE could be incorporated into existing care processes designed for CKD care.
We examined multiple models, from simple to more complex, to determine the impact of the KFRE. The KFRE demonstrated improved model discrimination compared with either the baseline eGFR or TKV alone in short (1-year) or longer (5-year) time periods. However, all three in isolation only provided poor to moderate discrimination and would likely be of limited clinical value. In contrast, the KFRE with the addition of the TKV or KFRE + the best model resulted in moderate to excellent discrimination. The KFRE + TKV model is appealing as it requires no additional clinical variables such as blood pressure or age and can be determined by ultrasound and laboratory values alone. If externally validated, it could be developed into a similar online calculator as the original KFRE. The KFRE + TKV and the KFRE + the best model demonstrated especially strong model discrimination among patients with an eGFR <50 mL/min. As such, they may be particularly useful in planning for preemptive transplant, dialysis modality, and vascular access.
We specifically examined an eGFR decline of >30% from baseline as a meaningful clinical outcome in addition to RRT.17,18 As the temporal trajectory of AD-PCKD is in the decades, appropriate surrogates for disease progression will facilitate treatment decisions and follow-up care. An eGFR decline of >30% has recently been reported to be an appropriate surrogate in Food and Drug Administration trials examining CKD and in PCKD specifically.12,17,18 As eGFR is routinely measured on repeat visits (as opposed to, for example, imaging studies for the TKV), outcome ascertainment would be streamlined.
Our study has a number of notable strengths. We included AD-PCKD patients at all stages of disease and across a broad range of eGFR. Thus, our findings are applicable to current nephrology practices where PCKD patients may be referred at various stages of disease progression. The TKV was determined by a single physician improving precision. Limitations of our study include the lack of external validation. The study was conducted in a tertiary care center on a referral population and thus findings may not be applicable to primary care. Most of the patients had severe and progressive disease and as such, our results might not be generalizable to all patients with CKD. KFRE was determined at a single time point and whether repeated measures of KFRE would further improve risk stratification is unknown. In addition, ultrasound is not the gold standard for determining total kidney volume but most readily available and inexpensive and safe investigation.
Conclusion
In a diverse, referral population with AD-PCKD, the KFRE was associated with adverse kidney outcomes and improved risk prediction. Consideration should be given to incorporating KFRE in risk assessment of patients with polycystic kidney disease.
Supplemental Material
CJKHD_suppl – Supplemental material for Prediction of Progression in Polycystic Kidney Disease Using the Kidney Failure Risk Equation and Ultrasound Parameters
Supplemental material, CJKHD_suppl for Prediction of Progression in Polycystic Kidney Disease Using the Kidney Failure Risk Equation and Ultrasound Parameters by Ayub Akbari, Navdeep Tangri, Pierre A. Brown, Mohan Biyani, Emily Rhodes, Teerath Kumar, Wael Shabana and Manish M. Sood in Canadian Journal of Kidney Health and Disease
Footnotes
Ethics Approval and Consent to Participate
Ethics approval was obtained from Ottawa Health Sciences Network Research Ethics Board.
Consent for Publication
Consent for publication is granted.
Availability of Data and Materials
Data queries can be emailed to Dr. Ayub Akbari at
Declaration of Conflicting Interests
The author(s) declared no potential conflicts of interest with respect to the research, authorship, and/or publication of this article.
Funding
The author(s) disclosed receipt of the following financial support for the research, authorship and/or publication of this article: The funding for the study was provided by Otsuka Pharmaceutical Co., Ltd.
Supplemental Material
Supplemental material for this article is available online.
References
Supplementary Material
Please find the following supplemental material available below.
For Open Access articles published under a Creative Commons License, all supplemental material carries the same license as the article it is associated with.
For non-Open Access articles published, all supplemental material carries a non-exclusive license, and permission requests for re-use of supplemental material or any part of supplemental material shall be sent directly to the copyright owner as specified in the copyright notice associated with the article.