
Abstract
Background:
Nephron progenitor cells derived from the metanephric mesenchyme undergo a complex balance of self-renewal and differentiation throughout kidney development to give rise to the mature nephron. Cell proliferation is an important index of progenitor population dynamics. However, accurate and reproducible in situ quantification of cell proliferation within progenitor populations can be technically difficult to achieve due to the complexity and harsh tissue treatment required of certain protocols.
Objective:
To optimize and compare the performance of the 3 most accurate S phase–specific labeling methods used for in situ detection and quantification of nephron progenitor and ureteric bud cell proliferation in the developing kidney, namely, 5-bromo-2’-deoxyuridine (BrdU), 5-ethynyl-2’-deoxyuridine (EdU), and proliferating cell nuclear antigen (PCNA).
Methods:
Protocols for BrdU, EdU, and PCNA were optimized for fluorescence labeling on paraformaldehyde-fixed, paraffin-embedded mouse kidney tissue sections, with co-labeling of nephron progenitor cells and ureteric bud with Six2 and E-cadherin antibodies, respectively. Image processing and analysis, including quantification of proliferating cells, were carried out using free ImageJ software.
Results:
All 3 methods detect similar ratios of nephron progenitor and ureteric bud proliferating cells. The BrdU staining protocol is the lengthiest and most complex protocol to perform, requires tissue denaturation, and is most subject to interexperimental signal variability. In contrast, bound PCNA and EdU protocols are relatively more straightforward, consistently yield clear results, and far more easily lend themselves to co-staining; however, the bound PCNA protocol requires substantive additional postexperimental analysis to distinguish the punctate nuclear PCNA staining pattern characteristic of proliferating cells.
Conclusions:
All 3 markers exhibit distinct advantages and disadvantages in quantifying cell proliferation in kidney progenitor populations, with EdU and PCNA protocols being favored due to greater technical ease and reproducibility of results associated with these methods.
What was known before
Several methods exist for quantification of proliferating cells in the embryonic kidney and other tissues. However, measuring proliferation in addition to co-staining progenitor populations in paraffin-embedded kidney tissues can be technically difficult to perform reproducibly well.
What this adds
In this study, we review the pros and cons of existing methods for quantitation of cell proliferation, and provide detailed, optimized protocols for 3 commonly employed methods of measuring cell proliferation with co-staining for nephron progenitors and ureteric bud cells.
Introduction
The mammalian kidney is a complex organ composed of more than 20 different cell types. 1 Remarkably, most cells found in the adult kidney are derived from only 2 primordial tissues: an initial epithelial structure called the ureteric bud and the surrounding cap of nephron progenitor cells originating from the metanephric mesenchyme. 2 Nephron progenitor cells undergo a complex balance of self-renewal and differentiation throughout kidney development to give rise to the mature nephron. 3 Progenitor cell proliferation is a tightly regulated and crucial process throughout kidney development and represents a major phenotypic constituent of nephrogenesis in vivo. 4 Defects in nephrogenesis and ureteric branching result in congenital anomalies of the kidney and urinary tract (CAKUT).5-7 With an incidence of 1:400, CAKUT represent one of the most frequent birth defects in humans and remain the major cause of childhood renal failure. 8 These pleiotropic malformations comprise a multitude of renal phenotypes including renal agenesis, hypoplasia, and renal dysplasia, associated with obstructive or reflexive anomalies of the ureter. A hallmark feature of CAKUT is a reduced nephron number. 9 Total nephron number, termed nephron endowment, can vary greatly even within the normal distribution, ranging from 200 000 to 1.8 million in humans. 10 Low nephron endowment within this normal range, though asymptomatic early in life, is associated with adult-onset hypertension, coronary heart diseases, and renal failure.11-14 Despite the importance of nephron endowment to human health and disease, much remains to be learned about the molecular mechanisms governing nephrogenesis.
In Situ Detection of Cell Proliferation in the Developing Kidney
Cell proliferation in nephron progenitor and ureteric bud cells during renal development is a foundational component of nephrogenesis. The ability to accurately quantify and assess in situ cellular proliferation in these lineages is crucial to increasing our knowledge of renal organogenesis. Numerous methods exist for identifying proliferating cells in situ and are broadly subdivided into DNA synthesis assays and endogenous proliferation marker assays (Table 1).
Summary of Methods Used for In Situ Identification of Proliferating Cells.
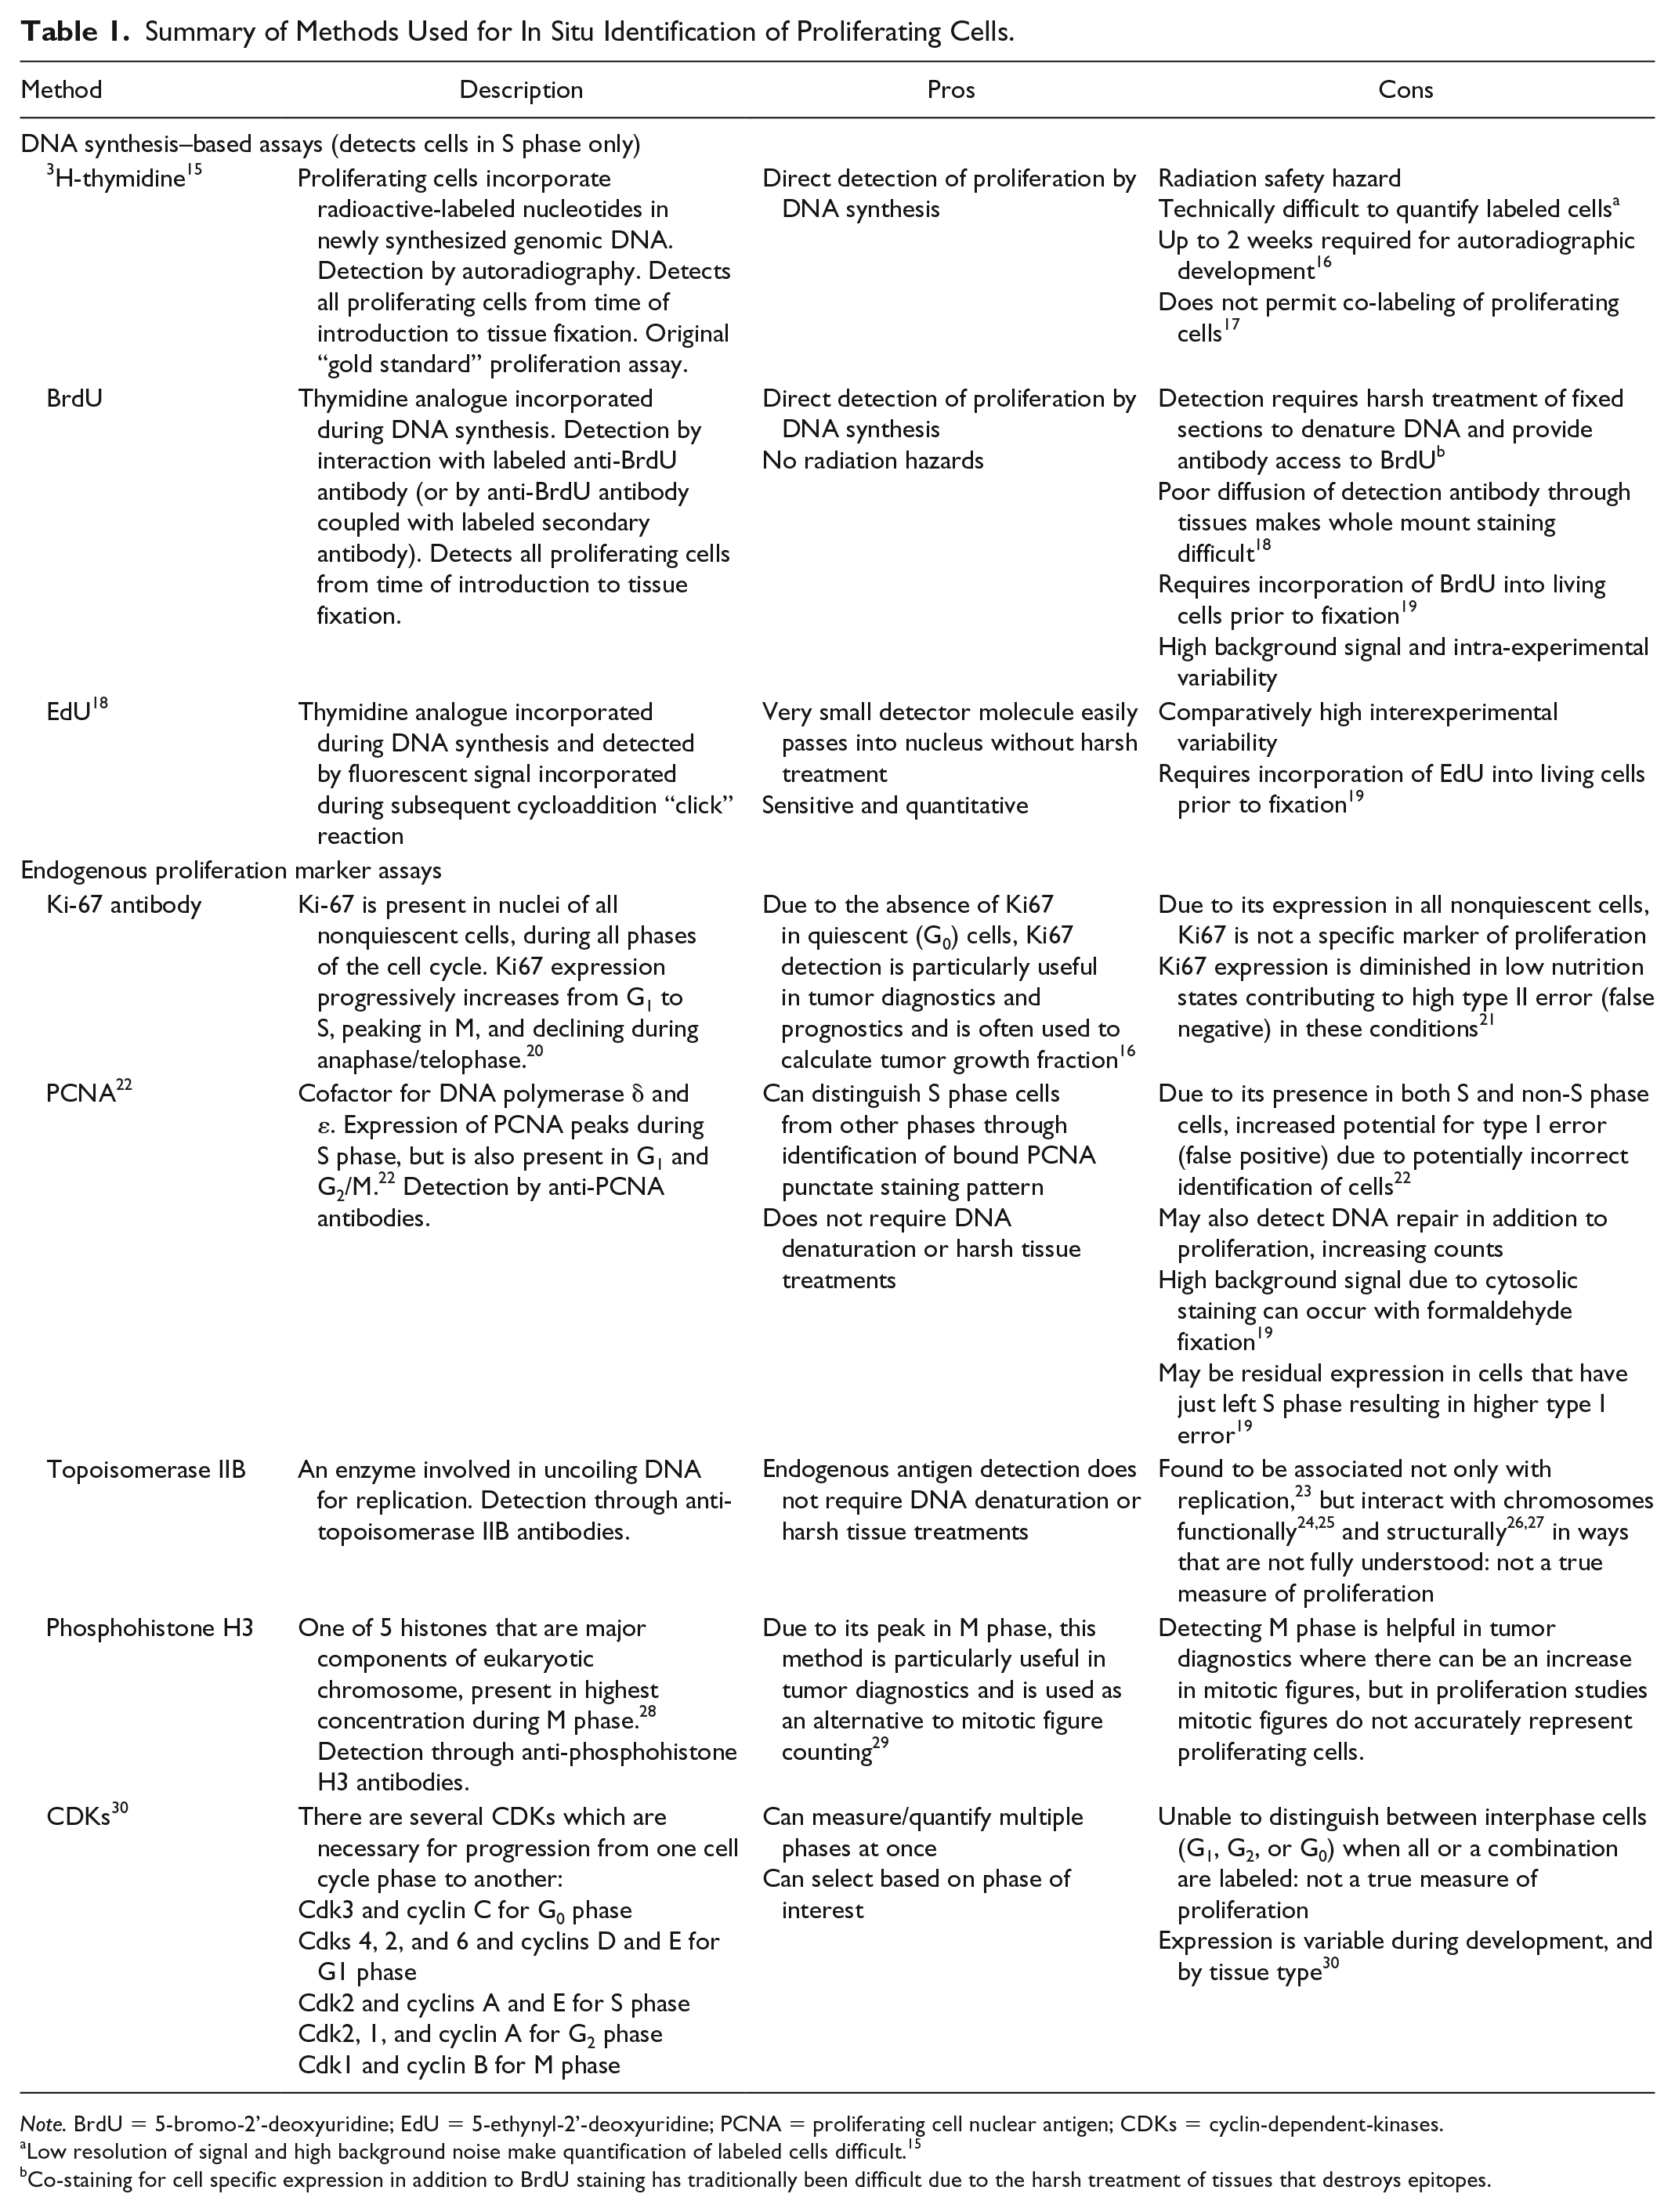
Note. BrdU = 5-bromo-2’-deoxyuridine; EdU = 5-ethynyl-2’-deoxyuridine; PCNA = proliferating cell nuclear antigen; CDKs = cyclin-dependent-kinases.
Low resolution of signal and high background noise make quantification of labeled cells difficult. 15
Co-staining for cell specific expression in addition to BrdU staining has traditionally been difficult due to the harsh treatment of tissues that destroys epitopes.
DNA growth is an active and continuous process (Figure 1), coordinating the phases of the cell cycle: G1 (cell growth and organelle duplication), S (DNA synthesis), G2 (further cell growth and preparation for cell division), and M (mitosis) phases. 31 Synthesis of new DNA occurs only in the S phase of the cell cycle. For the purpose of this study, we have strictly defined proliferation as the ratio of DNA-synthesizing cells to total cell population (also known as the proliferation index). Accordingly, we have restricted our analysis to S phase DNA synthesis markers 5-bromo-2’-deoxyuridine (BrdU), proliferating cell nuclear antigen (PCNA), and 5-ethynyl-2’-deoxyuridine (EdU). Notwithstanding, selection of other markers of the cell cycle may be more appropriate, dependent on specific study goals. For example, the use of phosphohistone H3 which marks M phase may be particularly helpful in tumor diagnostics, where there can be an increase in mitotic figures (Table 1). Late in G1, a control point allows the cell to commit to DNA synthesis and division, or otherwise exit the cell cycle and enter a quiescent state. 32 In addition, there is a G2 control point which prevents damaged cells from entering mitosis. 33 Alternate measures of cell proliferation that more broadly label cellular metabolic activity (ie, labeling cells in G1, S, G2, and M phase) are more likely to overestimate actual numbers of proliferating cells due to these control points.
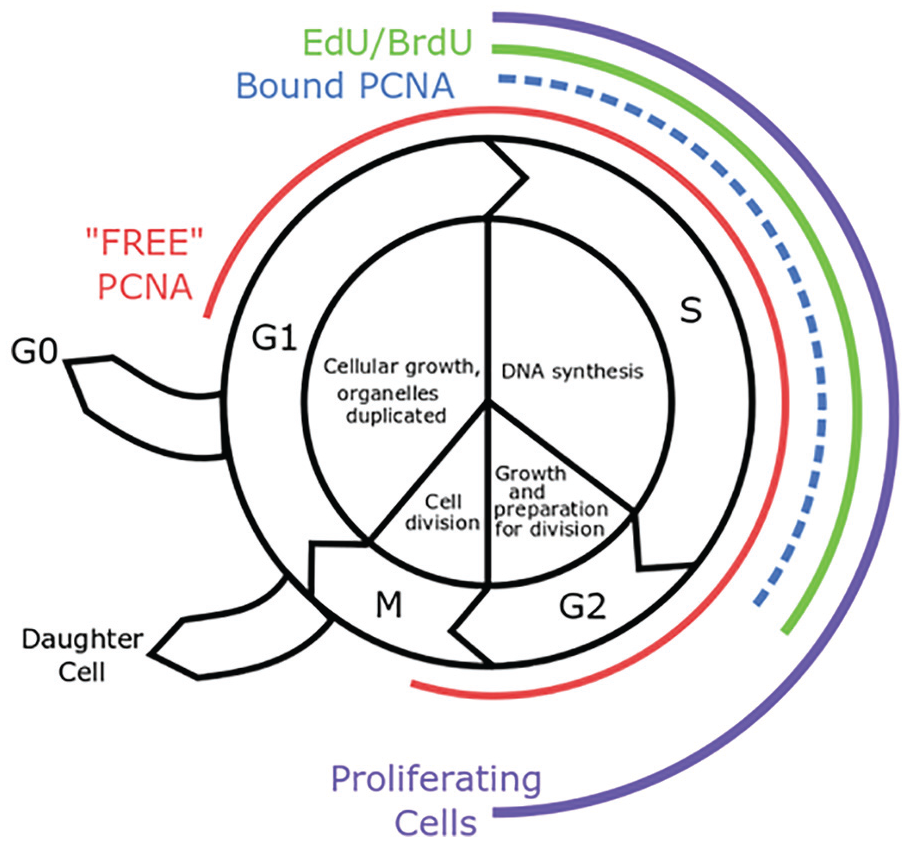
The phases of the eukaryotic cell cycle.
BrDU
Historically, the BrDU protocol has been regarded as a gold standard for in situ cell proliferation quantification in embryonic kidneys and in other developing organ systems. This protocol involves incorporation of the thymidine analogue BrDU into newly synthesized DNA (Figure 2), followed by detection of proliferating, BrDU-positive cells using anti-BrdU antibodies. BrDU protocols may be performed using either acid or enzymatic antigen retrieval steps. However, in order to permit access of anti-BrDU antibodies to genomic DNA, tissue sections are typically subjected to multiple denaturing conditions including incubation in acidic solutions at elevated temperatures, as well as treatment with nucleases and proteases. Ideally, co-staining would be performed to permit quantification of lineage-specific cell proliferation in nephron progenitor and ureteric bud cells.
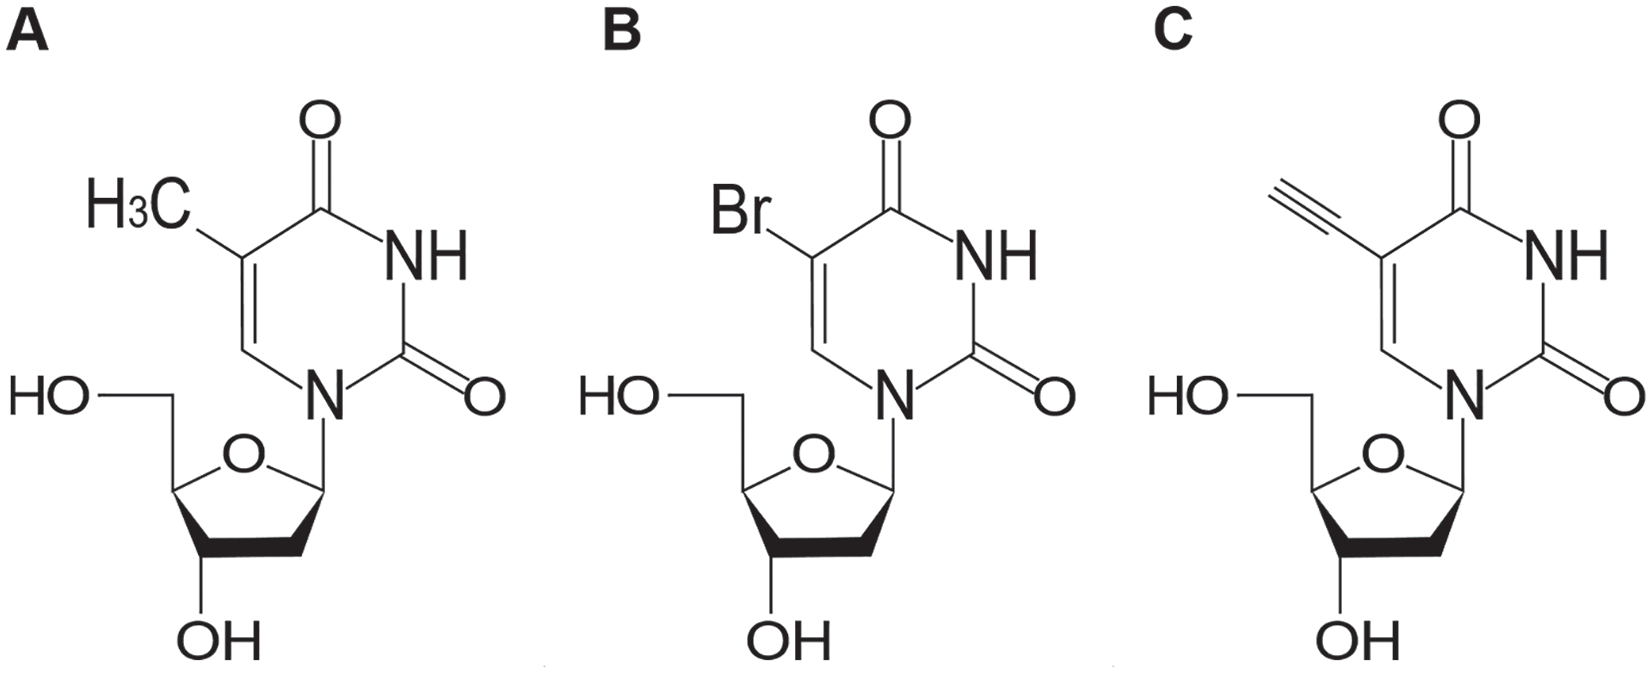
A comparison of the structures of (A) thymidine, (B) 5-bromo-2’-deoxyuridine (BrdU), and (C) 5-ethynyl-2’-deoxyuridine (EdU).
In practice, however, the harsh experimental conditions traditionally associated with the BrDU protocol have made co-staining technically prohibitive to perform reproducibly well for several reasons. Because BrDU is a nucleotide analogue, the addition of the DNase step is necessary to unwind DNA so that the antibody can access DNA-incorporated BrdU. When working with paraffin-embedded, paraformaldehyde- or formalin-fixed sections, an additional acid antigen retrieval step is also required to consistently obtain robust BrDU staining. Not surprisingly, the multiple antigen retrieval steps required for BrDU unmasking can partially denature or destroy less stable epitopes, impairing efforts to co-stain for additional antigens of interest. Other reported difficulties associated with co-staining include incompatibility of certain antibodies with the BrDU fixation methods or with BrDU buffers, as well as antibody cross-reactivity. 34
Consequently, nephron progenitor and ureteric bud cell populations are typically identified by tissue histology following BrDU staining. Alternatively, ureteric bud cells may be identified using Dolichos biflorus agglutinin lectin staining; however, this method can be problematic due to high signal background, and inefficient labeling of ureteric bud tips. 35 A common alternative to co-labeling cell lineages in conjunction with BrDU labeling is to calculate the proliferation index, which represents cycling cells as a fraction of total tissue section area.36-43
EdU
More recently, EdU has been introduced as another thymidine analogue that is incorporated into actively dividing cells (Figure 2). Like BrDU, EdU can be injected intraperitoneally into laboratory animals or can be added to cell culture media.7,22 In contrast to BrDU, however, EdU is not detected by antibodies, but by an azide-alkyne cycloaddition “click” reaction (Figure 3). Briefly, each EdU molecule contains an alkyne group which, when catalyzed by copper, binds to a fluorophore-conjugated azide. 23 Importantly, the unique click chemistry developed for EdU detection effectively circumvents the necessity of tissue denaturation for antigen retrieval, rendering this protocol far more compatible with tissue co-staining for nephron progenitor and ureteric bud cells.
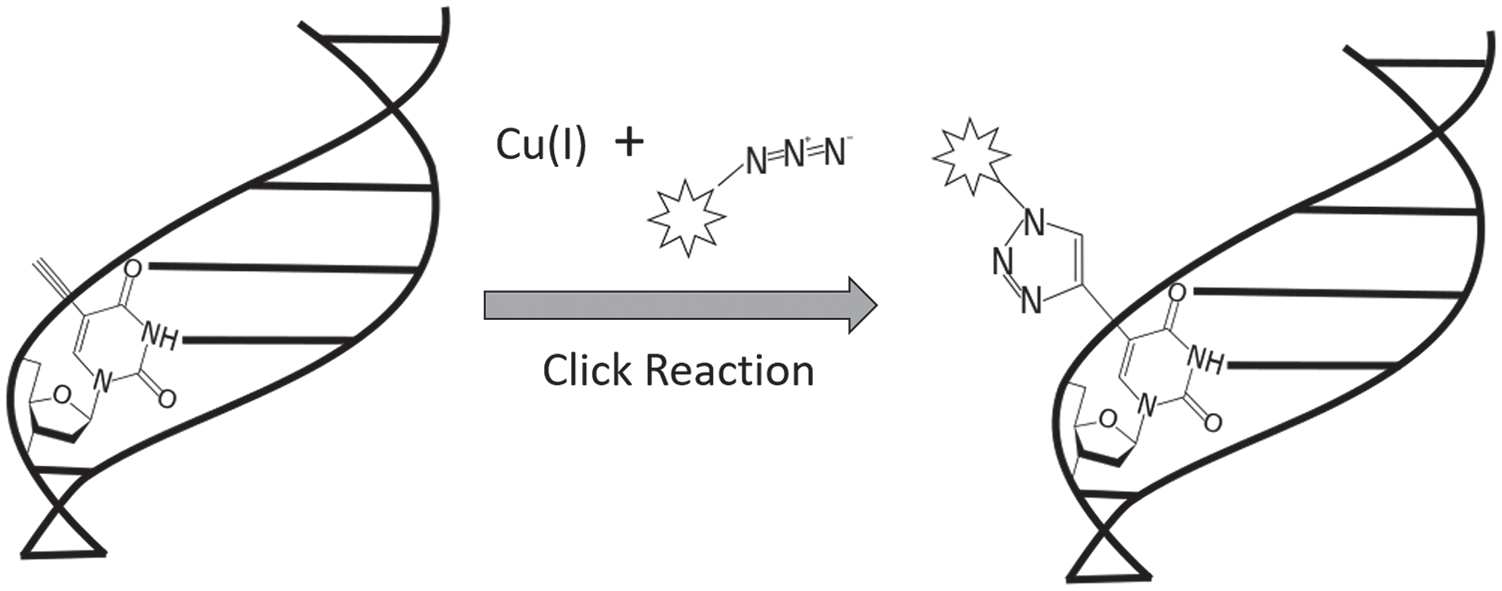
Schematic representation of the EdU click reaction.
Bound PCNA
Proliferating cell nuclear antigen (PCNA) is a ubiquitous non-histone nuclear protein exhibiting two distinct patterns of nuclear expression depending on cell cycle, distinguishable by immunostaining methods that do not employ alcohol fixation. 19 “Free” PCNA, visualized as diffuse nuclear staining, is expressed in all cells irrespective of cell cycle phase, and functions in DNA repair and RNA transcription. 20 In contrast, “bound” PCNA is a component of the DNA replication complex and is visualized by a punctate nuclear expression pattern only in S phase cells, when bound to DNA polymerase δ and DNA polymerase ε 21 (Figure 4).

Two distinct nuclear PCNA expression patterns can be distinguished in kidneys at E14.5: The diffuse staining pattern (arrows) and the punctate nuclear staining of cells in S phase (arrowheads).
Here we present protocol methods for in situ detection of cell proliferation in the developing mouse kidney of BrDU, EdU, and bound PCNA. Importantly, all 3 protocols have been optimized to permit co-staining for nephron progenitors and ureteric bud cells, with anti-Six2 and anti-E Cadherin antibodies, respectively. The advantages and disadvantages of each method are discussed and must be evaluated within the specific context of the individual researcher’s work when determining which method to use.
Methods
All animal experiments were carried out in accordance with the policies of the Animal Care Committee at the University of Prince Edward Island and the Canadian Council on Animal Care guidelines. CD1 dams and sires were purchased from Charles River Laboratories.
Timed Embryos
Place one or two 7-week-old CD1 dams into a sire’s cage overnight. Check for vaginal plugs early the next morning and separate the dams back in to their own cages. Record gestational age of the embryos as embryonic day (E)0.5 when vaginal plug is present.
Tissue Labeling, Collection, and Processing
At desired gestational age, inject pregnant mice intraperitoneally with either BrdU labeling reagent (Roche BrdU kit 1, 11296736001) or EdU labeling reagent (C10337, Life Technologies) that has been warmed to room temperature, at a dose of 1 mL per 100 g body weight of 1000× stock solution, equivalent to 30 μg/g body weight for BrdU and 50 μg/g body weight for EdU. Following injection, place pregnant females back in their cage and allow 1 hour for BrdU incorporation or 30 minutes for EdU incorporation.
1a. NOTE—The commercial BrDU protocol suggests a standard concentration of 100 μg BrDU/g body weight, and incubation time ranging from 30 minutes to 24 hours, depending on tissue of interest. For proliferation studies in embryonic murine kidneys, typical incubation times range between 1 and 4 hours depending on stage of renal development.44-46 The concentration of BrDU (30 μg/g body weight) and incubation time (1 hour) used in the present study were empirically determined for optimal signal to noise ratio. Longer incubation times or greater concentrations were found to result in more background staining.
After allowing the appropriate time for incorporation, euthanize pregnant dams by CO2 overdose and cervical dislocation, immediately dissecting out the uterine horns containing embryos and transferring them into a 50 mL Falcon tube containing ice-cold tissue culture-grade PBS (without Ca2+ and Mg2+), stored in ice.
Transfer the uterine horns containing embryos into a 10-cm plate on ice containing fresh ice-cold PBS. Dissect out embryos and transfer them to fresh ice-cold PBS in a new 10-cm plate. Dissect out the kidneys under a dissection microscope. To keep the kidneys as cold as possible during dissection, place a covered 15-cm cell culture plate filled with ice water on top of the microscope stage. A 10-cm cell culture lid placed upside down on top of this makeshift, translucent ice water bath provides a sterile and disposable cold dissection surface for each embryo to be dissected. For smaller embryonic kidney dissections (eg, embryonic day (E)11-5–E14.5 kidneys), use a dissection microscope with a light source transmitted through the base of the stage.
3a. NOTE—The amnion membrane or another portion of tissue from the embryo (head, tail) may be taken at this point for genotyping purposes if needed.
3b. NOTE—It is important to transfer kidneys into 4% paraformaldehyde (PFA) as quickly as possible.
3c. NOTE—Disposable needles (27G) and 1-mL syringes are a cost-effective and durable alternative to using fine forceps (which often bend or break at the tips) during dissection. New needles may be used for each dissection when genotyping is required, to help prevent genomic DNA cross-contamination between littermate samples for genotyping.
Immediately transfer kidneys into a clearly labeled histology cassette and submerge in fresh 4% PFA in PBS.
4a. NOTE—For embryonic murine kidneys, up to 6 pairs of kidneys may be processed in a single 6-compartment histology cassette (Leica Microsystems Inc. Cat #38440301). The use of multicompartment cassettes serves as a cost-saving measure during tissue processing and facilitates locating embryonic kidneys which may shrink and turn translucent following tissue processing.
Incubate kidneys in fresh 4% PFA for a minimum of 1 hour at room temperature, or preferably overnight at 4°C.
5a. NOTE—Embryonic kidneys may become brittle following overfixation, leading to tissue fragility during embedding and sectioning. Overfixation may also lead to fixation artifacts, and antigen masking associated with loss of staining signal.
Dehydrate, clear, and infiltrate the tissues with paraffin wax to prepare them for embedding. This step may be performed by hand, but preferably with an automated tissue processor to maximize wax infiltration into tissue.
6a. NOTE—The following schedule was used for processing embryonic kidneys: Fresh 4% PFA or formalin 1 hour, 70% ethanol—1 hour, 70% ethanol—1 hour, 95% ethanol—1 hour, 95% ethanol—1 hour, 95% ethanol—1 hour, 100% ethanol—1 hour, 100% ethanol—1 hour clearing solution (eg, xylenes or Clear Rite) 2 × 1.5 hours, 4 changes of fresh paraffin at 60°C for 0.5 hour each.
Embed kidneys in paraffin wax blocks oriented to make sagittal sections, labeling each sample. Blocks may be stored indefinitely at room temperature until they are ready to be sectioned.
Tissue Sectioning
Trim down the blocks on the microtome until the kidney tissue becomes visible.
1a. NOTE—Early embryonic kidneys may shrink significantly and turn translucent after paraffinization; care must be taken to avoid trimming through valuable tissue.
Place the trimmed wax blocks cut side down in a shallow ice water bath for 30 minutes prior to sectioning. This step increases fluidity of tissue sectioning and substantively enhances overall section quality.
Cut 5-µm sagittal sections, float on warm water bath and capture onto SuperFrost Plus (or equivalent charged) slides.
3a. NOTE—Multiple section ribbons can be captured together on a single slide as a cost-saving measure.
3b. NOTE—For between-group comparisons, deep sagittal tissue sections of similar depth must be selected. Typical midline landmarks should be clearly visible: primary ureteric bifurcations off the main ureter trunk in early embryonic kidney tissue sections; longitudinal rays of collecting ducts should be visible emerging from the renal calyces and/or pelvis in late embryonic kidneys.
Air dry sections at room temperature for 1 hour before storing at room temperature for future staining.
Rehydrating, Antigen Retrieval, and Blocking Sections
Bake slides at 60°C for 30 minutes.
Immerse slides in 3 separate xylenes baths for 5 minutes each.
Rehydrate sections in a series of ethanol dilutions (100%, 90%, 70%, 40%) through to distilled water by immersing sections in each solution for 5 minutes.
Prepare 1X sodium citrate-based antigen unmasking solution (Vector Laboratories, H-3300) in a glass beaker and heat to below boiling (97°C-99°C) in a steamer. Immerse the slides in the hot (below boiling) solution for 20 minutes.
Remove the beaker containing the slides from the steamer and allow it to cool down at room temperature for an additional 20 minutes.
Remove the slides from the unmasking solution, tap off excess liquid, and encircle tissue sections with a PAP pen to minimize the amount of reagent solution required to stain the sections.
Saturate the sections for 45 minutes at room temperature with permeabilization and blocking solution (10% donkey serum, Sigma; 3% bovine serum albumin [BSA], Calbiochem; 0.1% Tween 20, BioRad; in 1X PBS, Calbiochem).
Labeling of Sections
Each of the proliferation markers is co-labeled with Six2, a marker of nephron progenitor cells, and E-cadherin (E-cad), a marker of the epithelialized ureteric bud. All antibodies are incubated on the slides in a humidified incubation chamber. Summary of antibodies used can be found in Table 2.
Summary of Antibodies Used for Immunofluorescence Labeling.

Note. PCNA = proliferating cell nuclear antigen. BrdU = 5-bromo-2’-deoxyuridine; EdU = 5-ethynyl-2’-deoxyuridine.
These working dilutions were adjusted to be twice as concentrated for staining with BrdU (see “Labeling with BrdU” section).
NOTE—Typically, 200 μL of working antibody dilution are used per slide.
Labeling with EdU
EdU Click-IT reaction and labeling must be performed prior to co-staining with antibodies. Prepare the EdU reaction cocktail according to manufacturer’s instructions (C10337, Life Technologies), no more than 15 minutes before use. Apply to slides and incubate for 30 minutes at room temperature.
Wash slides by immersion in 1X PBS + 0.1% Tween 20 once for 5 minutes.
2a. NOTE—Reducing the number of washes from 3 (as per manufacturer’s instructions) to 1 significantly improves signal strength for weaker fluorophores such as Alexa350, without increasing background signal.
Incubate with Six2 and E-cad primary antibodies (both 1:400) in incubation buffer (3% donkey serum, 3% BSA, 0.1% Tween 20 in 1X PBS) overnight at 4°C.
Wash the slides by immersion once for 5 minutes with 0.1% Tween 20 in 1X PBS.
Incubate with anti-rabbit (1:100) and anti-rat (1:200) secondary antibodies at room temperature for 45 minutes.
Wash by immersion with 0.1% Tween 20 in 1X PBS once for 5 minutes.
Mount slides with a cover slip and mounting media.
Labeling with BrdU
NOTE—Slides must be incubated first with BrDU antibodies in BrDU incubation buffer (supplied with kit) followed by a wash prior to incubation with Six2 and E-Cadherin antibodies. The increased number of washes between incubations steps results in loss of signal strength, necessitating the use of higher concentrations of primary and secondary antibodies to generate sufficient co-staining signal intensity (Table 2).
Incubate each slide with 200 µL of distilled water with DNase (1 µL DNase/mL) for 2 minutes in a humidified incubation chamber at room temperature.
1a. NOTE—Incubation with DNase at this step is essential for high quality staining. DNases are highly unstable and can lose activity during routine handling if tubes are dropped or otherwise mishandled. Insufficient DNase digestion is a major cause of BrDU staining inconsistencies. It is therefore crucial to purchase certified quality DNase enzyme and to test each batch of DNase to confirm enzyme activity. Batches must be handled with extreme care and must be stored in small aliquots to prevent loss of activity due to repeated handling.
1b. NOTE—Optimal DNase incubation times must be empirically determined for each embryonic time-point.
Rinse the slides with BrdU wash solution (from kit 1:10 in distilled water) using a pipette.
Incubate with anti-BrdU antibody (1:10) in incubation buffer (from kit) for 45 minutes at room temperature.
Rinse with BrdU wash solution (from kit, 1:10 in distilled water) using a pipette.
Incubate slides with the secondary anti-mouse (1:10) antibody (from kit, diluted in the incubation buffer) for 45 minutes at room temperature.
Rinse the slides with 0.1% Tween 20 in 1X PBS using a pipette.
Incubate with Six2 and E-cad primary antibodies (both 1:200) in incubation buffer (3% donkey serum, 3% BSA, 0.1% Tween 20 in 1X PBS) overnight at 4°C.
Rinse with 0.1% Tween 20 in 1X PBS using a pipette.
Incubate with anti-rabbit (1:50) and anti-rat (1:100) secondary antibodies diluted in 1X PBS with 0.1% Tween 20 at room temperature for 45 minutes.
Rinse slides with 1X PBS using a pipette.
Mount slides with a coverslip and mounting media.
Label with PCNA
Incubate with Six2, E-cad (both 1:400) and PCNA (1:500) primary antibodies in incubation buffer (3% donkey serum, 3% BSA, 0.1% Tween 20 in 1X PBS) overnight at 4°C.
Wash the slides by immersion once for 5 minutes with 0.1% Tween 20 in 1X PBS.
Incubate with anti-rabbit (1:100), anti-rat (1:200), and anti-mouse (1:400) secondary antibodies at room temperature for 45 minutes.
Wash by immersion with 0.1% Tween 20 in 1X PBS once for 5 minutes.
Mount slides with a cover slip and mounting media.
Image Acquisition and Counting
Images are acquired at 40× magnification using a standard fluorescence or confocal microscope. The appropriate filter sets must be used to assure quality data. Here we have used a Zeiss AxioImager.A1 microscope with an AxioCamMRc digital camera, AxioVision Software, and Zeiss filter sets 20, 38, and 49. Digital images are manually counted using the free ImageJ Cell Counter Plugin or a similar image processing program. Importantly, digital cell counts may be reviewed for calibration purposes, to evaluate precision and/or possible counting bias. Automated or semi-automated cell counting programs are also available for purchase, but have additional hardware, software, and setup requirements, making them cost-prohibitive to smaller laboratories.
Image processing
For tissues older than embryonic day (E)13.5, multiple overlapping images can be taken and stitched together using Fiji/ImageJ software 47 as previously described. 48
1a. NOTE—E.14.5 kidneys require 15 to 20 images to capture the entire specimen, depending on the objective used.
1b. NOTE—Images should be saved with filenames corresponding to the order of acquisition to facilitate subsequent processing steps.
Use the Mosaic plugin in Fiji/ImageJ to consolidate each group of images into a single high-resolution image.
2a. NOTE—To obtain the clearest images, acquire a separate image for each color channel, then merge together using ImageJ. Pseudo-coloring may be applied to final images to assist deuteranope viewers in visualizing double-labeled sections.
Quantification
Using the Fiji/ImageJ software, lay a grid over the image to facilitate counting (Figure 5).
Use the Cell Counter Plugin in Fiji/ImageJ to manually tag and count stained cells for each color channel.

A representative kidney section with nephron progenitor cells (NPC) labeled with Six2 (blue), ureteric bud cells (UB) labeled with E-cadherin (purple), and proliferating cells labeled with EdU (green).
Data Analysis
The ratio of cells labeled by the proliferation marker to total number of nephron progenitor cells (marker/NPC) or of ureteric bud cells (marker/UB) was calculated for each section. Mean values were calculated for each kidney and compared between groups by t test. Data are presented as mean ± standard deviation.
Results and Discussion
Assessment of nephron progenitor cell proliferation is a critical parameter of kidney development in vivo. Here we have presented co-immunostaining protocols that we have optimized for BrdU, EdU, or PCNA, along with Six2 and E-cadherin to quantitatively assess in situ nephron progenitor cell and ureteric bud cell proliferation in embryonic murine kidney sections.
To compare the 3 methods in the same tissues, CD1 timed pregnant dams were injected with both BrdU and EdU at E14.5. Kidneys were collected from 5 embryos, processed, and sectioned. A minimum of 9 serial sagittal sections were taken near the midline of each kidney, where the first ureteric bifurcation could be seen, and 3 consecutive sections were stained for each method as described above. Digital images were captured, and the number of stained cells was quantified for each color channel. A nephron progenitor cell proliferation index was calculated as the ratio of Six2-positive, proliferation marker-positive cells to total number of Six2-positive cells. A ureteric bud cell proliferation index was likewise calculated as the ratio of E-cadherin-positive, proliferation marker-positive cells to total number of E-cadherin-positive cells.
The protocols outlined in the Methods section have each been optimized to yield unambiguous nuclear staining of cells for BrDU, EdU, or bound PCNA together with Six2 and E-cadherin co-staining of nephron progenitor and ureteric bud cells, respectively. Notwithstanding, each protocol has distinct advantages and disadvantages. BrdU staining has long been considered a gold standard marker for measuring cell proliferation, with an immense body of evidence supporting its use as such. This protocol in conjunction with Six2 and E-cadherin co-staining is the lengthiest and most technically challenging of the three to perform. Its most notable challenge relates to localized staining inconsistencies, namely, staining of some tissue sections and absence of staining of other tissue sections on the same slide. Staining inconsistencies are resolvable by increasing DNase concentrations (at the expense of tissue morphology), suggesting that the absence of staining may be due at least in part to localized failures in DNase-dependent antigen exposure in these tissue sections. In contrast, while there is a smaller body of literature supporting the use of bound PCNA or EdU as markers of cell proliferation, neither of these protocols suffer from the same staining inconsistencies as BrDU staining, and both are far simpler technically to perform. However, the added necessity of distinguishing the punctate PCNA staining pattern of S phase cells from non-S phase cells (Figure 6A) in the bound PCNA protocol substantially increases the amount time needed to quantitate cell proliferation using the bound PCNA method. (Figure 6A). In this context, the EdU protocol, though by virtue of being the most recent of the three to be introduced and thus having the smallest body of literature to lend itself—is both the most straightforward and rapid to perform. Another important caveat to recall is that of the 3 methods, the bound PCNA protocol alone can be performed retrospectively on fixed tissue as it does not require injection into the live animal.

(A) Cell lineage-specific proliferation is detected in the developing kidney using BrDU, EdU, or bound PCNA proliferation markers together with Six2 and E-cadherin co-staining. Bar is 25 µm (B, C) Proliferation ratios observed for (B) nephron progenitor cells and (C) ureteric bud cells using each of the 3 methods. Data are presented as mean ± SD (N = 5 kidneys per group).
Similar indices of cell proliferation are detected using BrdU and EdU; however, data precision is higher with the BrdU protocol, as evidenced by lower relative standard deviation in this method compared with EdU (Figure 6B vs C). Interestingly, PCNA staining yields a significantly lower nephron progenitor cell proliferation index compared with BrdU. Whereas BrdU and EdU mark a larger population of cells including those in both S phase and G2 phase, bound PCNA labels only S phase cells at the time of fixation, which may explain in part the lower proliferation index associated with this method.
In summary, we present this methods article to the nephrology community in the hopes of providing a useful and cost-effective resource to quantitatively assess in situ cell proliferation of multiple cell lineages during kidney development in vivo. Each of the 3 methods optimized and described above present distinct advantages and disadvantages, which must be considered within the specific scientific context of a given experiment (Table 3).
Comparative Summary of BrdU, EdU, and PCNA Staining for Use in Quantifying Progenitor Cell Proliferation in Embryonic Kidneys.
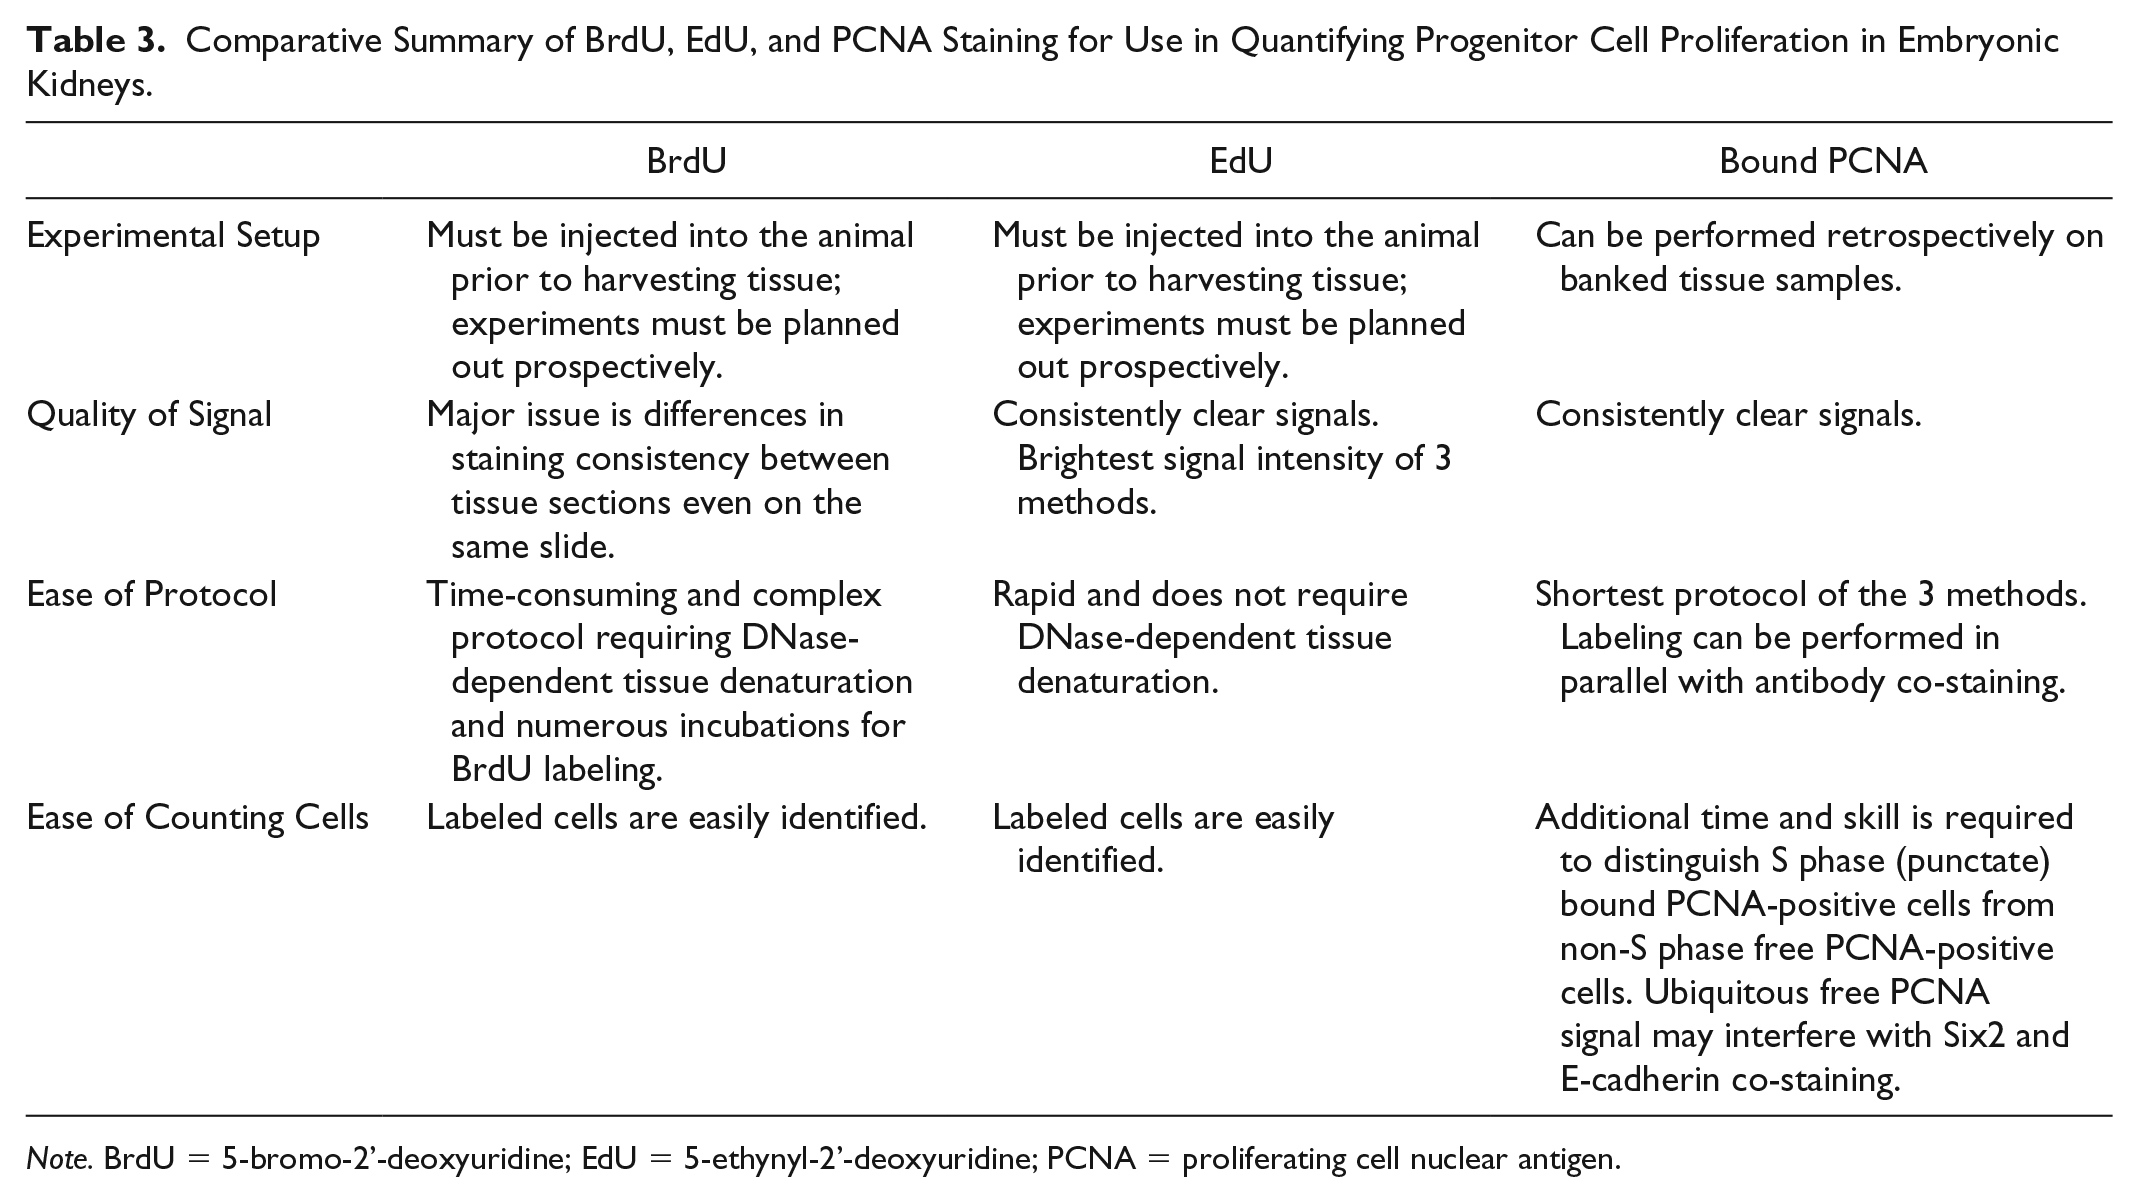
Note. BrdU = 5-bromo-2’-deoxyuridine; EdU = 5-ethynyl-2’-deoxyuridine; PCNA = proliferating cell nuclear antigen.
Footnotes
Acknowledgements
The authors gratefully acknowledge funding from CIHR and the Kidney Foundation of Canada as well as support from the KRESCENT Program and Time to Write initiative to S.H. through the University of Prince Edward Island.
Ethics Approval and Consent to Participate
The study protocol was approved by the research ethics board and Animal Care Committee at the University of Prince Edward Island.
Consent for Publication
Consent for publication has been provided by all authors.
Availability of Data and Materials
The data analyzed during this study are available from the corresponding author on reasonable request.
Declaration of Conflicting Interests
The author(s) declared no potential conflicts of interest with respect to the research, authorship, and/or publication of this article.
Funding
The author(s) disclosed receipt of the following financial support for the research, authorship, and/or publication of this article: This study was supported by grants from Kidney Foundation of Canada, CIHR (Grant numbers 615368, 615314).