
Abstract
Background:
Glucose metabolism links closely to cholesterol metabolism. Posttransplant diabetes mellitus (PTDM) adversely affects posttransplant outcomes, but its risk factors in relation to cholesterol metabolism have not been fully delineated. The apolipoprotein B/A1 (Apo B/A1) ratio, which is associated with insulin resistance, has not been evaluated in kidney transplant recipients as a risk factor for PTDM.
Objective:
The objective of this study was to determine whether serum apolipoprotein profiles predict late PTDM, defined as a new onset diabetes occurring greater than 3 months posttransplant.
Design:
Retrospective chart review of a prevalent population of kidney transplant recipients.
Setting:
Large transplant center in Ontario, Canada.
Patients:
We identified 1104 previously nondiabetic adults who received a kidney transplant between January 1, 1998, and December 1, 2015, and were followed at 1 transplant center.
Measurements:
Recipients provided testing for serum apolipoprotein B (Apo B) and apolipoprotein A1 (Apo A1) concentrations from 2010, either at 3 months posttransplant for new transplant recipients or the next clinic visit for prevalent recipients. Late PTDM defined using Canadian Diabetes Association criteria as occurring ≥3 months posttransplant was recorded until May 1, 2016.
Methods:
All analyses were conducted with R, version 3.4.0 (The R Foundation for Statistical Computing). Comparisons were made using Student t test, Fisher exact test or chi-square test, Kaplan-Meier methodology with the logrank test, or Cox proportional hazards analysis as appropriate. Covariates for the multivariate Cox proportional hazards models of PTDM as the outcome variable were selected based on significance of the univariate associations and biological plausibility.
Results:
There were 53 incident late PTDM cases, or 1.71 cases per 100 patient-years. Incident late PTDM differed between the highest and lowest quartiles for Apo B/A1 ratio, 2.47 per 100 patient-years vs 0.88 per 100 patient-years (P = .005 for difference). In multiple Cox regression analysis, first measured serum Apo B/A1 concentration better predicted subsequent PTDM than low-density lipoprotein cholesterol (LDL-C; hazard ratio [HR] = 7.80 per unit increase, P = .039 vs HR = 1.05 per unit increase, P = .774). Non-high-density lipoprotein cholesterol (HDL-C) concentrations also did not predict PTDM (P = .136). By contrast to Apo B, Apo A1 was protective against PTDM in statin users (HR = 0.17 per unit increase, P = .016).
Limitations:
Posttransplant diabetes mellitus cases occurring before apolipoprotein testing was implemented were not included in the analysis.
Conclusions:
Apolipoproteins B and A1 better predict late PTDM than conventional markers of cholesterol metabolism.
What was known before
Conventional predictors of posttransplant diabetes mellitus (PTDM) include age, ethnicity, weight gain, and immunosuppressive medications, among other factors.
What this adds
The apolipoprotein profile is superior to conventional lipid parameters in predicting PTDM. Apolipoprotein B predicted PTDM in nonstatin users while Apo A1 protected against PTDM in statin users. The benefit of statins after transplantation might mediate through Apo B reduction, but this benefit may not be captured through low-density lipoprotein cholesterol reduction.
Introduction
Posttransplant diabetes mellitus (PTDM) associates with increased graft failure and mortality.1,2 Despite numerous well-identified risk factors for PTDM, its incidence remains high. 3 Posttransplant diabetes mellitus is generally considered an early posttransplant complication occurring in the first 3 months that entails aggressive efforts such as dietary modification and a rapid reduction in corticosteroid dose. However, late PTDM is also described, 4 and management strategies targeting late PTDM will likely additionally improve long-term outcomes. Long-term prevention to reduce the overall PTDM burden mandates further efforts to understand the risk factors behind late PTDM as they occur in kidney transplant recipients (KTR).
A candidate risk factor in the epidemiology of type 2 diabetes is the serum apolipoprotein profile. 5 Apolipoprotein A1 (Apo A1) and apolipoprotein B (Apo B) are the primary constituents of antiatherogenic high-density lipoprotein cholesterol (HDL-C) and atherogenic lower density lipoproteins (very low-density lipoprotein cholesterol [VLDL-C], intermediate-density lipoprotein cholesterol [IDL-C], low-density lipoprotein cholesterol [LDL-C]). To date, interest in Apo A1 and Apo B has primarily focused on their role as a independent predictors of cardiovascular disease in the general population. 6 However, the Apo B/Apo A1 ratio was also found to be correlated with insulin resistance 7 and components of the metabolic syndrome. 8 The Apolipoprotein B/A1 (Apo B/A1) ratio has also been independently associated with type II diabetes mellitus (DM). 9
Although a shift in the serum apolipoprotein profile has been documented after kidney transplantation, 10 any impact of the posttransplant apolipoprotein profiles on posttransplant outcomes such as PTDM and cardiovascular disease has not been ascertained. The aim of this study therefore was to investigate if the serum apolipoprotein profile is independently associated with late PTDM. Our hypothesis was that a high posttransplant Apo B/A1 ratio would correlate better with PTDM incidence compared with more conventional lipid parameters, even in the presence of confounding factors such as lipid-lowering medication that are often prescribed to KTR.
Patients and Methods
Study Sample and Follow-up
St. Michael’s Hospital (SMH) is an urban university-affiliated tertiary-care medical center that actively follows more than 1700 prevalent KTR and performs approximately 120 single-organ kidney transplants annually. Clinic visit frequency is typically weekly to month 1 posttransplant, biweekly to month 3, monthly to month 6, quarterly to month 12, and twice annually or annually thereafter. At each clinic visit, trained personnel record anthropometry and resting blood pressure (BP). Ethnicity is recorded based on self-report. Laboratory testing is performed as close to each clinic visit as possible, with additional testing performed between visits according to a separate, more frequent schedule. The fasting lipid profile is obtained every 6 months, and fasting or random glucose tests are performed at least once every 3 months. The estimated glomerular filtration rate (eGFR) is calculated by the Modification of Diet in Renal Disease-7 equation. 11 Starting in 2010, nonfasting Apo B and Apo A1 concentrations have been measured in all KTR at least once either at the first visit after this policy was implemented in 2010 or at 3 months posttransplant in the case of new KTR starting in 2010.
For this study, all KTR followed at SMH and transplanted between January 1, 1998, and December 31, 2015, were identified from the clinical electronic database. We performed a retrospective cohort analysis of the prevalent population of this cohort as of May 1, 2016, to ensure that all patients had a minimum of 3 months potential posttransplant follow-up. The procedure for inclusion and exclusion is outlined in Figure 1. Institutional Research Ethics Board approval (REB10-204c) was obtained for the study. As this study was a retrospective review of clinic data pertaining to a prevalent KTR population, individual informed consent was not obtained. The study was performed in accordance with the 2000 Declaration of Helsinki and the 2008 Declaration of Istanbul.
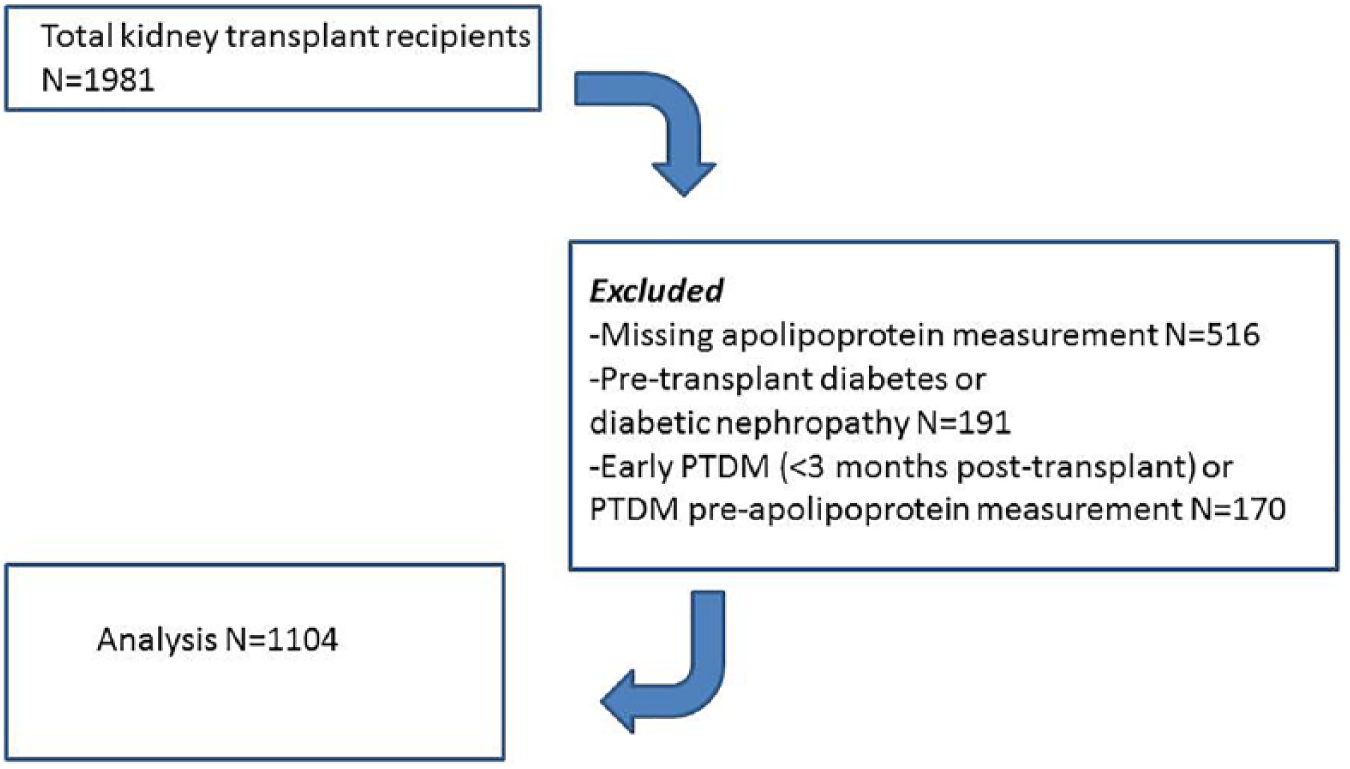
Outline of inclusion and exclusion procedure.
Data Collection
Occurrence of PTDM was routinely captured by a review of transcriptions from local and citywide hospital databases as part of routine care and supplemented by patient and family physician interviews where necessary. The main outcome measure was incident PTDM, diagnosed and transcribed by a physician using the 2008 Canadian Diabetes Association Guidelines 12 while metabolic syndrome status was assessed using National Cholesterol Education Program Adult Treatment Panel III guidelines. 13 At least 2 blood glucose readings above diagnostic cut-points or other valid diagnostic tests such as oral glucose tolerance testing were required for the diagnosis of PTDM, which was then validated by dietician and/or endocrinologist consult notes. Patients without measurements for either Apo A1 or Apo B, PTDM within 3 months posttransplant, or known type 2 diabetes that occurred prior to transplant including diabetic nephropathy were excluded. Transplant and pretransplant characteristics were determined at the time of transplantation. All clinical information, laboratory measurement, medication, and physical characteristics data were obtained at the time of apolipoprotein measurement or at the closest posttransplant follow-up date to the date of apolipoprotein measurement. A more restricted 2010-2015 cohort was also identified to assess patients without previous long-term posttransplant follow-up, to exclude any possible impact of subtle preventative measures against PTDM in the older patients.
Our primary outcome of interest was the development of late PTDM, diagnosed 3 months posttransplant or later. Earlier PTDM may be more proportionally attributable to unidentified preexisting disease burden, postoperative stress, and higher immunosuppression rather than traditional risk factors for diabetes, similar to the case with major adverse posttransplant cardiac events. 14 The first apolipoprotein measurement, which was used for this analysis, was typically obtained 3 months posttransplant. Temporality between the measurement of apolipoprotein concentrations and PTDM diagnosis was assured by recording PTDM events only after the apolipoprotein measurement. As routine apolipoprotein testing for postoperative KTR began in 2010, patients who developed PTDM prior to 2010 were excluded from analysis. Fasting lipid profile and other laboratory measurements were recorded through a review of the clinical chart utilizing those closest to the date of the apolipoprotein concentration measurement, again preceding any diagnosis of PTDM.
Statistical Analysis
All analyses were conducted with R, version 3.4.0 (The R Foundation for Statistical Computing). All data are reported as mean ± SD, unless otherwise stated. Two-tailed P values below .05 were taken to imply statistical significance. All missing values were handled by exclusion from the relevant analysis without imputation. Comparisons were made using Student t test, Fisher exact test or chi-square test, Kaplan-Meier methodology with the logrank test, or Cox proportional hazards analysis as appropriate. Normality and skewness were assessed visually or with skewness tests for all subgroups, supplemented with the Shapiro-Wilk normality test for small-n subgroups. The selection of covariates for the multivariate Cox proportional hazards models of PTDM as the outcome variable was based on the significance of the univariate associations as well as biological plausibility.15,16
Results
A total of 1981 patients were identified on initial screening. There were 516 patients excluded from further analysis due to missing apolipoprotein concentration measurements, 191 due to pretransplant diabetes or diabetic nephropathy, and 170 due to a diagnosis of PTDM either in the first 3 months posttransplant or prior to apolipoprotein concentration measurement. Therefore, 1104 patients met inclusion criteria for further analysis (Figure 1). Full primary data were available for more than 95% of all physical and laboratory parameters measured. Patients were censored if lost to follow-up (no laboratory testing or clinic visits for 12 months) on the date of their last clinic visit. Median time to first Apo B/A1 measurement was 1.73 years for the 1998-2015 cohort and 3.3 months for the 2010-2015 cohort.
Demographic and other characteristics organized by quartiles of the Apo B/A1 ratio are provided in Table 1. Each quartile provided an approximately equal 775 patient-years of follow-up. A higher Apo B/A1 ratio correlated significantly with male sex, as did a higher waist and hip circumference, and polycystic kidney disease. Other notable associations with higher Apo B/A1 ratios included greater use of cyclosporine, higher serum C-reactive protein, parathyroid hormone, and uric acid concentrations, higher urine albumin-to-creatinine ratios, and decreased kidney allograft function (Table 1). More than 98% of all patients received prednisone. All measured lipid parameters demonstrated normality of distribution. Demographics for the restricted 2010-2015 cohort are provided in Supplementary Table 1.
Patient and Transplant Characteristics Across Apolipoprotein B/A1 Quartiles.

Note. R statistic not provided for binary characteristics, as logistic regression was used for these characteristics instead of linear regression. Laboratory measurements with unlisted units are mmol/L. Binary factors expressed in N (%) unless otherwise specified. p-y = patient years; ESRD = end-stage renal disease; BP = Blood pressure; HbA1c = glycated hemoglobin; HDL = high-density lipoprotein; LDL = low-density lipoprotein; GFR = glomerular filtration rate; ACR = albumin-to-creatinine ratio.
Posttransplant Diabetes Mellitus
There were 53 incident late PTDM cases in the total cohort over 3100 patient-years follow-up, corresponding to 1.71 cases/100 patient-years, including 29 incident PTDM cases in the 2010-2015 cohort. Median follow-up time after apolipoprotein measurement for the non-PTDM group was 3.07 years. Median time-to-incident PTDM after apolipoprotein measurement was 0.72 years or 262 days. Incidence rates by Apo B/A1 quartile demonstrate progressively increasing PTDM risk with increasing Apo B/A1 ratio (Figure 2). Late PTDM incidence differed between the highest and lowest quartiles for the Apo B/A1 ratio, 2.47 per 100 patient-years vs 0.88 per 100 patient-years (P = .005 for difference). Kaplan-Meier survival analysis of time-to-PTDM diagnosis in the entire cohort (Figure 3) indicates significance of the Apo B and the Apo B1/A ratio higher than the median concentration, but not for above-median serum HDL-C and LDL-C concentrations. Univariate Cox regression analysis of Apo B/A1 ratio on PTDM incidence limited to the 2010-2015 cohort (Table 3) indicates a similar association between Apo B/A1 and PTDM (P = .008, hazard ratio [HR] = 8.246).

Incidence rate of PTDM per apolipoprotein B/A1 quartile.
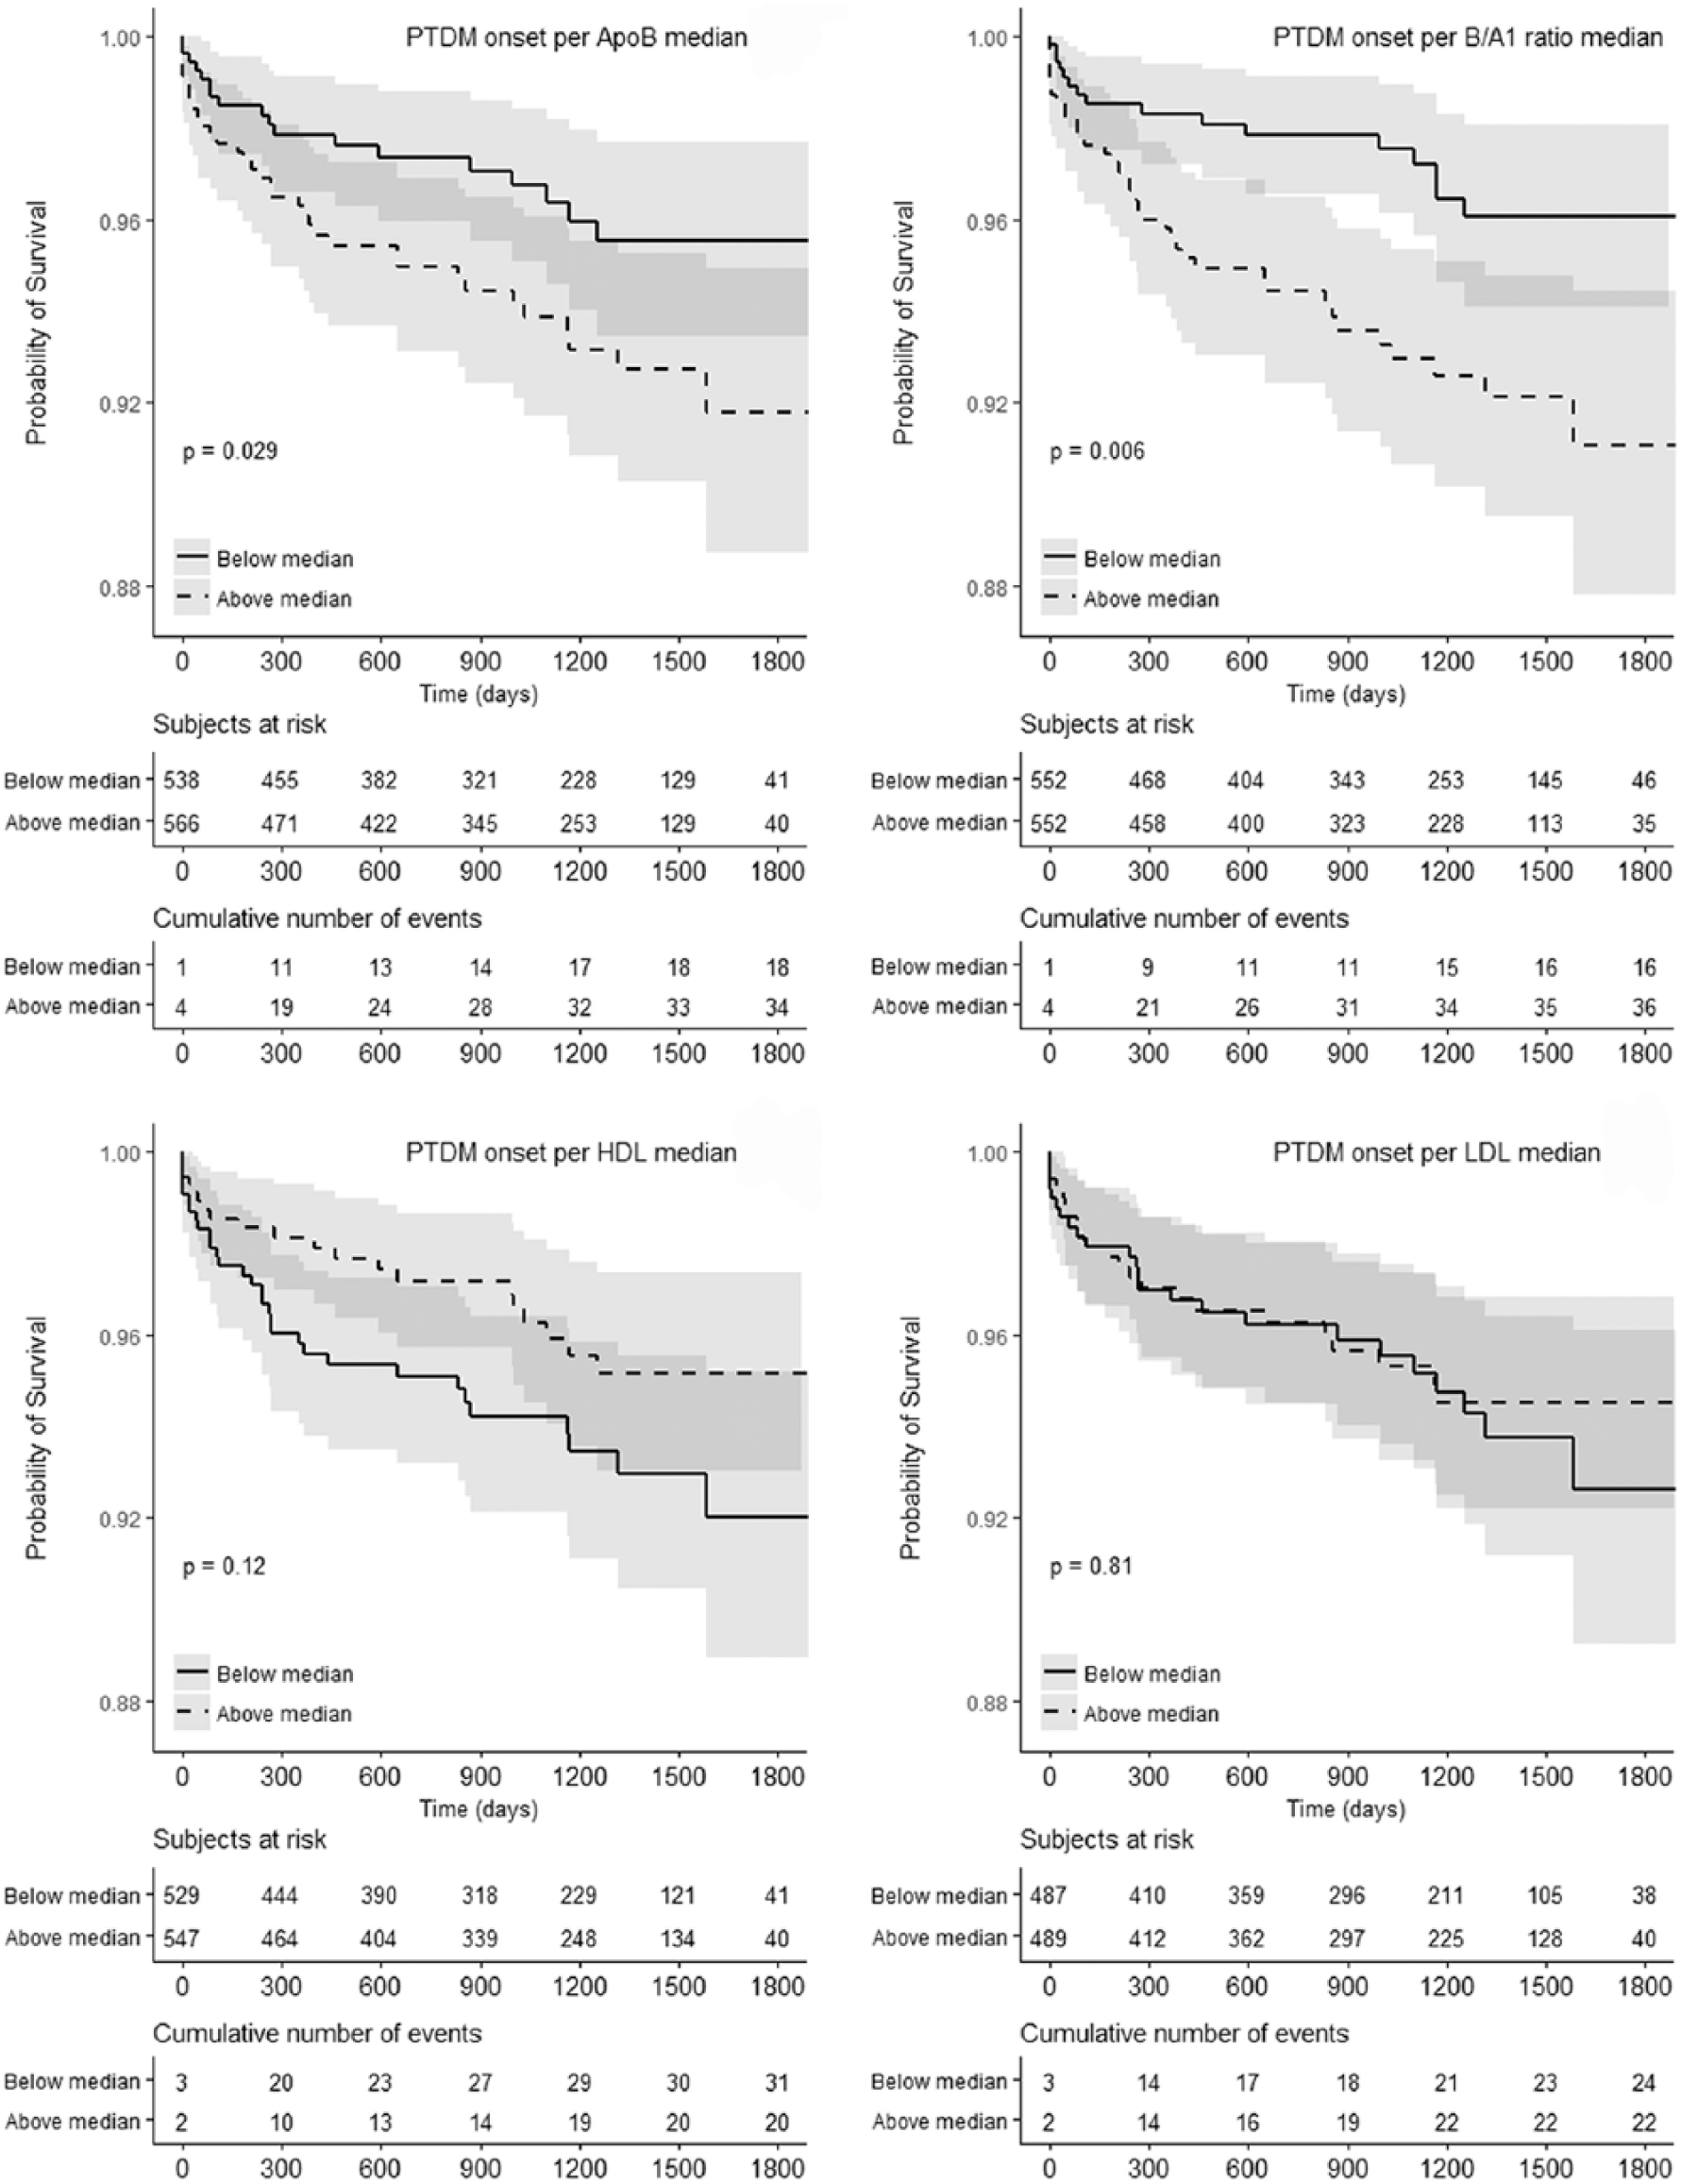
Time-to-PTDM incidence for Apo B, Apo B/A1, HDL-C, and LDL-C.
A phenotype characterization of the total cohort to identify differences between late PTDM and non-PTDM subjects is shown in Table 2, and for the restricted cohort in Supplementary Table 2. No significant differences were noted in graft failure, allograft function, or immunosuppression exposure between groups. Univariate Cox proportional hazards analysis for time-to-PTDM diagnosis of the restricted cohort is provided in Table 3, with significant predictors of PTDM including the Apo B/A1 ratio and Apo B concentrations, blood glucose and HbA1c concentrations, waist-to-hip ratio, and serum triglyceride concentrations. The results of multivariate Cox regression analyses in this cohort including other potential indicators of pretransplant dyslipidemia are shown in Table 4. Per-unit increases in serum Apo B (HR = 8.41, P = .007) and Apo B/A1 ratio (HR = 7.80, P = .039) outperformed other conventional lipid parameters, significantly correlating to PTDM incidence.
Differences in Clinical Characteristics Between Incident PTDM and Non-PTDM Cases.

Note. Significance assessed using comparison of incidence rates, Student t test, or Fisher exact test, as appropriate. PTDM = posttransplant diabetes mellitus; Apo A1 = apolipoprotein A1; Apo B = apolipoprotein B; Apo B/A1 = apolipoprotein B/A1; eGFR = estimated glomerular filtration rate; FBG = fasting blood glucose; RBG = random blood glucose.
Univariate Cox Proportional Hazards Regressions for Late PTDM Incidence, 2010-2015.

Note. PTDM = posttransplant diabetes mellitus; HR = hazard ratio; CI = confidence interval; BP = blood pressure; HbA1c = glycated hemoglobin; eGFR = estimated glomerular filtration rate; MDRD = Modification of Diet in Renal Disease; HDL = high-density lipoprotein; LDL = low-density lipoprotein; ACR = albumin-to-creatinine ratio.
Multivariate Cox Proportional Hazards Regressions for Late PTDM Incidence, Using the 2010-2015 Cohort.

Note. Four separate models are shown. Age refers to the age at time of measurement. Binary variables coded as 0 = no, 1 = yes. Multiple regression with Apo A1 not shown, HR (95% CI) = 0.51 (0.2-1.6), P = .248. Metabolic syndrome diagnoses use National Cholesterol Education Program Adult Treatment Panel III criteria. Non-HDL-cholesterol and LDL cholesterol expressed in mmol/L. PTDM = posttransplant diabetes mellitus; HR = hazard ratio; CI = confidence interval; Apo B/A1 = apolipoprotein B/A1; Apo B = apolipoprotein B; Apo A1 = apolipoprotein A1; BMI = body mass index; SBP = systolic blood pressure; Tac = tacrolimus; CsA = cyclosporine A; HDL-C = high-density lipoprotein cholesterol; LDL-C = low-density lipoprotein cholesterol.
The selective predictive value of Apo B and Apo A1 altered when considering statin use. Table 5 provides 6 stratified survival regression analyses for time-to-PTDM accounting for potential effect modifiers of the apolipoprotein-PTDM relationship. Apolipoprotein B, an obligate protein component of LDL-C, predicted PTDM in nonstatin users while Apo A1, the major protein component of HDL-C, protected against PTDM incidence in statin users (Table 5). Kaplan-Meier analyses of PTDM-free survival (Figure 4) demonstrated a predictive value to non-HDL-C in statin users corroborating this relationship of Apo A1 to PTDM.
Cox Regression Analyses for Apo B and Apo A1, Stratified by Statin Use, High Fasting Blood Glucose and White Ethnicity in the 1998-2015 Cohort.

Note. The stratification is dichotomized. Each group is tested in univariate Cox regression with Apo B and Apo A1, respectively. Apo B = apolipoprotein B; Apo A1 = apolipoprotein A1; FBG = fasting blood glucose.
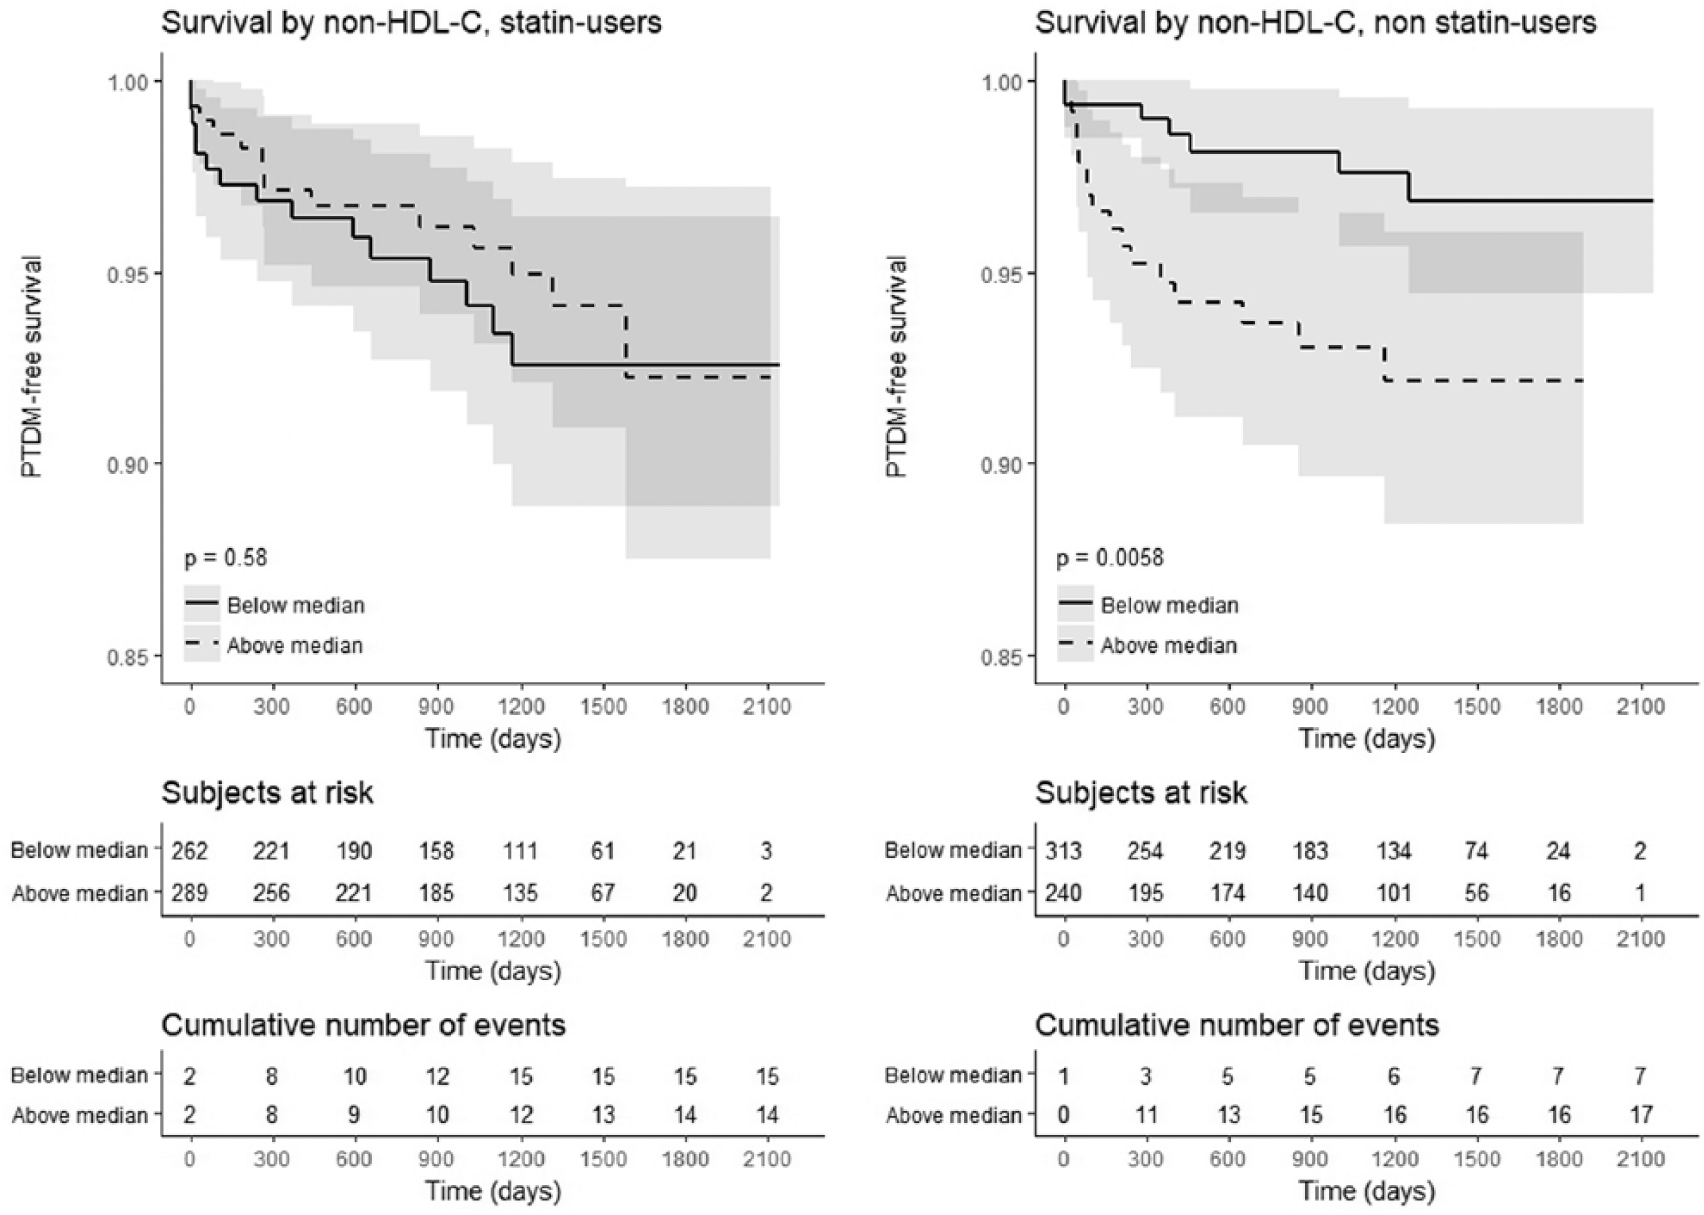
Kaplan-Meier analysis of PTDM-free survival by non HDL-C median based on statin use.
Discussion
This retrospective study of a large, multiethnic cohort of KTR suggests a predictive value of the posttransplant apolipoprotein profile over more conventional lipid parameters toward late PTDM. Although dyslipidemia and diabetes correlate posttransplantation, 17 HDL-C and LDL-C proved less useful than apolipoprotein measurements in this study for this purpose. Metabolic syndrome predicts PTDM 18 with the caveat that type 2 diabetes locates within the metabolic syndrome itself. 14 The association of a high Apo B/A1 ratio and Apo B concentration with late PTDM identifies a new potential risk factor for diabetes in the presence of chronic kidney disease.
Apolipoproteins provide a new potential predictive PTDM risk marker situated outside of established metabolic syndrome definitions. 14 Apolipoprotein B/A1 profile abnormalities reflect higher diabetes and cardiovascular risk or mortality in the general population 19 and prevalent dialysis patients.20,21 Such associations were previously unclear in KTR. Besides extending these findings to KTR, this study may also provide proximal mechanistic hypotheses of PTDM genesis and ultimately help reduce not only DM but cardiovascular disease located further along the causal pathway from PTDM because PTDM predicts cardiovascular disease. 22 Conventional risk markers of lipid turnover may assist in predicting diabetes in the general population but are less useful in KTR due to the presence of multiple confounders, so the apolipoprotein profile may be of greater assistance particularly in late PTDM. This study emphasizes risk factors for late PTDM, which is not the focus of clinical trials in KTR and whose risk factors require better delineation.
Hypertriglyceridemia occurs in type 2 diabetes from increased VLDL triglycerides or defective removal of plasma triglycerides. 23 IDL-C and LDL-C are the products of VLDL and chylomicron metabolism, which themselves contain triglycerides. 24 A posttransplant state impairs triglyceride clearance. 25 Given that Apo B is an obligate component of VLDL-C, IDL-C, and LDL-C, Apo B concentrations may more accurately reflect the hypertriglyceridemia burden of diabetes, and may hence indicate the prediabetic state. Apolipoprotein B overproduction has also been demonstrated to induce insulin resistance. 26 This study extends this role of Apo B to the posttransplant milieu after the environmentally murky early posttransplant phase has passed. As dyslipidemia and diabetes cluster as risk factors causing one another, 27 posttransplant dyslipidemia better reflects in serum Apo B rather than LDL-C concentrations. Subclinical inflammation is also a component of the insulin resistance syndrome, 28 so Apo B may mediate posttransplant insulin resistance. Triglyceride-containing particle count, reflected through the Apo B concentration, may be more important than the triglyceride concentration itself in leading to PTDM.
Treatment of posttransplant dyslipidemia impairs the ascertainment of causal pathways toward important clinical endpoints like PTDM. Statin therapy alters the relationship between Apo B and HDL-C or LDL-C, 29 exerting a greater effect on cholesterol and triglyceride than on apolipoprotein concentrations. In this study, statin use was associated with a lower Apo B but not lower triglyceride concentration. The ineffectiveness of LDL-C to predict PTDM in multivariate analysis (Table 4) may reflect the effects of statin therapy, known to reduce posttransplant cardiac events. 30 The obligate 1:1 inclusion of Apo B in hepatic-derived VLDL-C, IDL-C, and LDL-C structure 31 allows Apo B to serve as a formal count of LDL particles, unlike LDL-C that measures the cholesterol content of LDL particles. LDL-C may predict atherosclerosis only when LDL-C and LDL particle count are concordant.32,33 Therefore, if Apo B and LDL-C are not concordant in KTR, then Apo B and Apo A1 may provide greater predictive value toward posttransplant metabolic outcomes such as PTDM.
Measured HDL-C is a summation of HDL2 and HDL3 concentrations. 34 HDL3 less effectively transports apolipoprotein C-II 35 while HDL2 more effectively reflects decreases in total HDL-C. Total HDL-C may therefore poorly indicate PTDM risk if HDL structure shifts characterize the posttransplant state. Apolipoprotein A1, representing total HDL-particle count, may consequently also poorly reflect PTDM risk except in the presence of statins, which affects LDL-C more. Clinically, the benefit of statins in metabolic syndrome 36 might mediate through Apo B reduction, but this benefit may not be captured through LDL-C reduction.
Although our study presents an association between the posttransplant apolipoprotein profile and PTDM, it is limited by its retrospective, observational nature. The association between apolipoprotein concentrations and PTDM does not imply causality or the direction of the cause-effect relationship. Measurement of apolipoprotein profiles only since 2010 in a 1998-2015 cohort allowed for 3-month posttransplant standardized measurement in only a subgroup of patients, even though incident PTDM was recorded in all patients only after apolipoprotein profiles were measured. PTDM was ascertained through recorded transcription, possibly biasing against detecting more events based on blood glucose measurements particularly when mortality occurs or grafts fail early posttransplant. The small number of late PTDM cases, excluding a much larger number of earlier PTDM cases (170 vs 53), precluded adjusting for more potential confounders in regression analyses. We did not possess sufficiently granular information of immunosuppressive medication or their serum concentration as well as statin dosage for producing meaningful correlations. Greater patient numbers and longer follow-up will be required to better assess these and other relationships among lipid particle components in chronic kidney disease.
In conclusion, the apolipoprotein profile in our cohort was a superior predictor of late PTDM compared with traditional lipid profile parameters. Routine apolipoprotein measurement post kidney transplantation, if validated in other cohorts, may facilitate investigating mechanisms for PTDM, and might ultimately contribute to better monitoring and reducing long-term posttransplant cardiovascular risk.
Supplemental Material
Apolipoprotein_supplementary_tables_FINAL_UNMARKED_April_2019 – Supplemental material for Serum Apolipoprotein B and A1 Concentrations Predict Late-Onset Posttransplant Diabetes Mellitus in Prevalent Adult Kidney Transplant Recipients
Supplemental material, Apolipoprotein_supplementary_tables_FINAL_UNMARKED_April_2019 for Serum Apolipoprotein B and A1 Concentrations Predict Late-Onset Posttransplant Diabetes Mellitus in Prevalent Adult Kidney Transplant Recipients by Rohit Malyala, Lindita Rapi, Michelle M. Nash and G. V. Ramesh Prasad in Canadian Journal of Kidney Health and Disease
Footnotes
Acknowledgements
The authors acknowledge Philip W. Connelly, PhD, Division of Endocrinology and Metabolism, Department of Medicine, University of Toronto, for detailed discussions on cholesterol metabolism.
List of Abbreviations
Apo A1, apolipoprotein A1; Apo B, apolipoprotein B; BMI, body mass index; BP, blood pressure; DM, diabetes mellitus; eGFR, estimated glomerular filtration rate; ESRD, end-stage renal disease; FBG, fasting blood glucose; HbA1c, glycated hemoglobin; HDL-C, high-density lipoprotein cholesterol; IDL-C, intermediate-density lipoprotein cholesterol; KTR, kidney transplant recipient(s); LDL-C, low-density lipoprotein cholesterol; MDRD, modification of diet in renal diseases; PTDM, posttransplant diabetes mellitus; p-y, patient-years; RBG, random blood glucose; SBP, systolic blood pressure; SD, standard deviation; SMH, St. Michael’s Hospital; TG, triglycerides; VLDL-C, very low-density lipoprotein cholesterol.
Ethics Approval and Consent to Participate
Ethics approval was obtained from the Research Ethics Board at St. Michael’s Hospital. Since the study was a population-based retrospective review, individual consent to participate was not obtained.
Consent for Publication
All authors have reviewed a final version of the manuscript and have consented to publication.
Availability of Data and Materials
Data and materials may be made available to qualified investigators upon written request to the corresponding author. Reasonable requests for data access will be assessed in consultation with the appropriate Research Ethics Board.
Author Contributions
R.M. participated in research design, data collection, data analysis, and writing. L.R. participated in research design and writing. M.M.N. participated in research design and writing. G.V.R.P. coordinated research design, funding, performance of the research, data analysis, and writing.
Declaration of Conflicting Interests
The author(s) declared no potential conflicts of interest with respect to the research, authorship, and/or publication of this article.
Funding
The author(s) disclosed receipt of the following financial support for the research, authorship, and/or publication of this article: The study was funded by the Kidney Transplant Program, St. Michael’s Hospital, Toronto, ON, Canada.
Supplemental Material
Supplemental material for this article is available online.
References
Supplementary Material
Please find the following supplemental material available below.
For Open Access articles published under a Creative Commons License, all supplemental material carries the same license as the article it is associated with.
For non-Open Access articles published, all supplemental material carries a non-exclusive license, and permission requests for re-use of supplemental material or any part of supplemental material shall be sent directly to the copyright owner as specified in the copyright notice associated with the article.