
Abstract
Background:
Deceased donor kidney allocation in the United States is guided by the Kidney Donor Risk Index (KDRI). The generalizability of the KDRI beyond the United States has not been widely studied.
Objective:
To assess the generalizability of the KDRI in a cohort of non-US (Canadian) deceased donor kidney transplant recipients.
Design:
Population-based retrospective cohort study.
Setting:
Ontario, Canada.
Patients:
Recipients of deceased donor kidneys from January 1, 2005, to March 31, 2011.
Methods:
Using administrative data, we analyzed a cohort of deceased donor kidney recipients in Ontario, Canada. The Kaplan-Meier method and Cox proportional hazards models were used to assess the relationship between KDRI and the outcomes of graft loss and death. KDRI was modeled continuously and categorically. The ability of models with KDRI to predict recipient outcomes beyond donor age was also explored. Model discrimination was assessed using c-statistics, evaluated at 5 years of follow-up.
Results:
A total of 1299 consecutive deceased donor kidney transplant recipients were included. The median follow-up was 5.5 years. Mean donor age increased from 27 to 64 years across ascending KDRI quintiles. The adjusted relative hazards (95% confidence interval) for total graft loss from Q2 to Q5 (referent = Q1) were 1.27 (0.89-1.80), 1.58 (1.13-2.22), 1.43 (1.01-2.02), and 2.15 (1.54-2.99), respectively. Increased relative hazards across KDRI quintiles were also observed for death-censored graft loss, but not death with graft function. All-cause mortality was increased for the highest KDRI quintile only. In this cohort, a model with KDRI performed better than a model with donor age alone (P = .009).
Limitations:
Large health care databases may have precluded the complete capture of covariate data.
Conclusions:
In conclusion, the KDRI is generalizable to Canadian patients in Ontario and may help inform risk assessment beyond donor age. The performance of KDRI in other non-US settings, and the need for additional model refinement, warrants further study.
What was known before
The Kidney Donor Risk Index is a tool that was developed in the United States and has played an important role in guiding the allocation of deceased donor kidneys in the United States.
What this adds
The Kidney Donor Risk Index helps to risk stratify deceased donor kidneys beyond donor age alone among kidney transplant recipients in Ontario. Knowing this may potentially guide deceased donor kidney allocation in certain Canadian settings.
Introduction
Over the past decade, there has been a greater emphasis on allocation methods to maximize deceased donor kidney utilization for the treatment of end-stage renal disease (ESRD). In 2002, the concept of an expanded criteria donor (ECD) was first introduced to identify deceased donor kidneys that were at increased risk for graft failure.1,2 The system risk-stratified deceased donor kidneys in the US setting 3 ; however, its utility in non-US settings was questionable. 4 Moreover, variability in donor kidney quality even among ECD kidneys has been noted. 5
In 2009, Rao et al derived and validated the Kidney Donor Risk Index (KDRI). 6 It combined 15 donor and transplant factors, each independently associated with graft failure or death, summarized them into a continuous score, and compared it with a 40-year-old, non-Black, healthy donor. This was then simplified to a donor-only version of the KDRI with no loss in predictive ability. 7 The Kidney Donor Profile Index (KDPI) later followed, which remapped the KDRI onto a cumulative percentage scale using a reference population of all deceased kidney donors in the United States in the prior calendar year. 8
In 2012, the US Organ Procurement and Transplantation Network (OPTN) replaced the ECD classification system with the KDPI, which provided an estimate of the expected survival of a deceased donor kidney and a means to evaluate the suitability of deceased donor kidney offers. 9 However, a recent study in a cohort of Canadian kidney transplant recipients showed that the ECD classification system was no better at risk stratifying deceased kidney donors than donor age alone. 4 In light of these findings, the current study assessed the generalizability of the KDRI in a cohort of non-US (Canadian) deceased donor kidney transplant recipients.
Materials and Methods
This retrospective cohort study included recipients of deceased donor kidney transplants in Ontario, Canada, from January 1, 2005, to March 31, 2011. The study protocol was approved by the institutional review boards at the University Health Network and Sunnybrook Health Sciences Centre, Toronto, Canada.
Data Sources
The data sources used in this study are described in detail elsewhere. 4 In brief, the Trillium Gift of Life Network (TGLN) collects data on deceased donors in Ontario, Canada, and was used to identify the study population. 10 Additional data sources included the Canadian Organ Replacement Register (CORR), the Canadian Institute for Health Information (CIHI) data sources, Institute for Clinical Evaluative Sciences (ICES) diabetes and hypertension databases, the Ontario Health Insurance Plan (OHIP), and Ontario’s Registered Persons Database. These datasets were linked using unique encoded identifiers and analyzed at ICES.
Study Population
The study cohort included all consecutive recipients of first deceased donor kidney transplants during the accrual period. The exclusion criteria were donors and recipients < 18 years old, living donor kidney transplant recipients, dual kidney and multiorgan transplants, and transplants using out-of-province deceased donor kidneys. TGLN and CORR databases were used to ascertain baseline characteristics.
Exposure Assessment
The donor-only version of the KDRI was analyzed over the KDPI to avoid the need to scale to the preceding year’s donor cohort and maintains its value as a metric in regression analyses. The score was calculated for each recipient based on donor age; height; weight; ethnicity; history of hypertension, diabetes mellitus, and hepatitis C; cause of death; serum creatinine; and whether the donation was after circulatory (vs neurological) death.6,7 For missing height, weight, and serum creatinine, we assigned values based on age- and sex-specific medians. Missing race was considered not Black, and those with unknown hepatitis C status were assumed to be negative. This allowed for maximum inclusion of the cohort in the analyses.
Transplant Outcomes
Recipients were observed from transplant to a maximum follow-up date of March 31, 2015. The primary outcome was total graft loss, which was a composite of graft failure (ie, return to chronic dialysis or preemptive retransplantation) or death. Secondary outcomes included death-censored graft loss, death with graft function, and all-cause mortality. Recipients who emigrated from Ontario were censored from the analysis.
Statistical Analysis
Baseline characteristics were reported for the entire cohort and by KDRI quintile. Groups were compared using analysis of variance or chi-squared test for trend. The Kaplan-Meier product limit method was used to graphically assess time to graft loss or death. Cox proportional hazards models were used to examine the primary and secondary outcomes as a function of KDRI and other covariates. KDRI was modeled both linearly and categorically by quintiles. Models were adjusted for recipient age at transplant, sex, race, cause of kidney failure, pretransplant dialysis time, peak panel reactive antibody, the Johns Hopkins Aggregated Diagnosis Groups (ADG), donor sex, urine protein on dipstick, and year of transplantation. The Johns Hopkins ADG was used as a measure of comorbidity with the advantage of being applicable in both ambulatory and hospital-based settings. 11 Missing cause of ESRD was treated as a “missing” category. Models were stratified by transplant hospital. Results were reported as hazard ratios (HRs) with 95% confidence intervals (CIs). The proportional hazards assumption was assessed by adding a time dependent covariate to the models; interaction P value < .05 was considered statistically significant, suggesting nonproportionality. The assumption of a linear association between KDRI and total graft loss was assessed using a 3-knot restricted cubic spline (RCS) function and a plot of log(HR). 12 Model discrimination was assessed using c-statistics, evaluated at 5 years of follow-up. 13 A competing risks analysis was not pursued as estimates from a previous study of the same population showed similar results to conventional models, 4 suggesting minimal dependence between failure types (graft loss and death). 14
Sensitivity analyses examined the dose-response association between KDRI and transplant outcomes by the KDRI categories used in the original validation (<0.79; 0.79 to <0.96; 0.96 to <1.15; 1.15 to <1.45; ⩾1.45). 6 The likelihood ratio test was used to explore whether the addition of KDRI to models already including donor age could better discriminate higher vs lower risk kidneys. All analyses were conducting using SAS version 9.4 (SAS Institute Inc, Cary, North Carolina) and R version 3.3.0 (R Foundation for Statistical Computing, Vienna, Austria).
Results
A total of 1770 deceased donor kidney transplant recipients were eligible for study inclusion (Figure 1). After applying the prespecified exclusion criteria, 1299 deceased donor kidney transplant recipients were included in the final cohort. Figure 2 shows the distribution of KDRI. The median KDRI was 1.25 and ranged from 0.63 to 3.15. Overall, 21.3% of ECD donor kidneys were in the fourth KDRI quintile, and 78.6% were in the fifth KDRI quintile. Table 1 shows the baseline characteristics of the transplant recipients by KDRI quintile. The mean age of the recipients was 55 years (SD = 12 years). As the KDRI increased, mean recipient age increased (51 years in Q1 vs 59 years in Q5, P < .001). Recipients of the highest KDRI kidneys were more likely to be diabetic (43% in Q1 vs 58% in Q5) and have a prior history of cardiovascular disease (6% in Q1 vs 12% in Q5). Pretransplant time on dialysis was slightly longer in the lowest vs highest KDRI quintiles (62 months in Q1 vs 54 months in Q5). No significant trend was observed across KDRI for recipient sex, race, body mass index (BMI), cause of kidney failure, or Johns Hopkins ADG.

Study flow diagram.

Histogram of the distribution of KDRI values.
Transplant Recipient Baseline Characteristics.

Note. KDRI = Kidney Donor Risk Index; ESRD = end-stage renal disease; PRA = panel reactive antibody; ADG = Aggregated Diagnosis Groups.
KDRI ranged from 0.63 to 3.15, and divided into quintiles. Values used to define each quintile shown.
Table 2 summarizes donor and transplant characteristics. The P value for trend was statistically significant for each component used to calculate the KDRI (P < .001), except for hepatitis C status, preterminal serum creatinine, and donation after circulatory death. The mean donor age increased significantly across KDRI quintiles (27, 41, 48, 55, and 64 years from Q1 to Q5, respectively, P < .001). The cohort had very few Black patients (1.2% overall). Overall, 37.1% of the donors had a history of hypertension, and 10.5% had a history of diabetes; the prevalence of both conditions increased with increasing KDRI. A minority of donors were hepatitis C positive (ie, < 6 patients in the study cohort).
Donor and Transplant Baseline Characteristics.
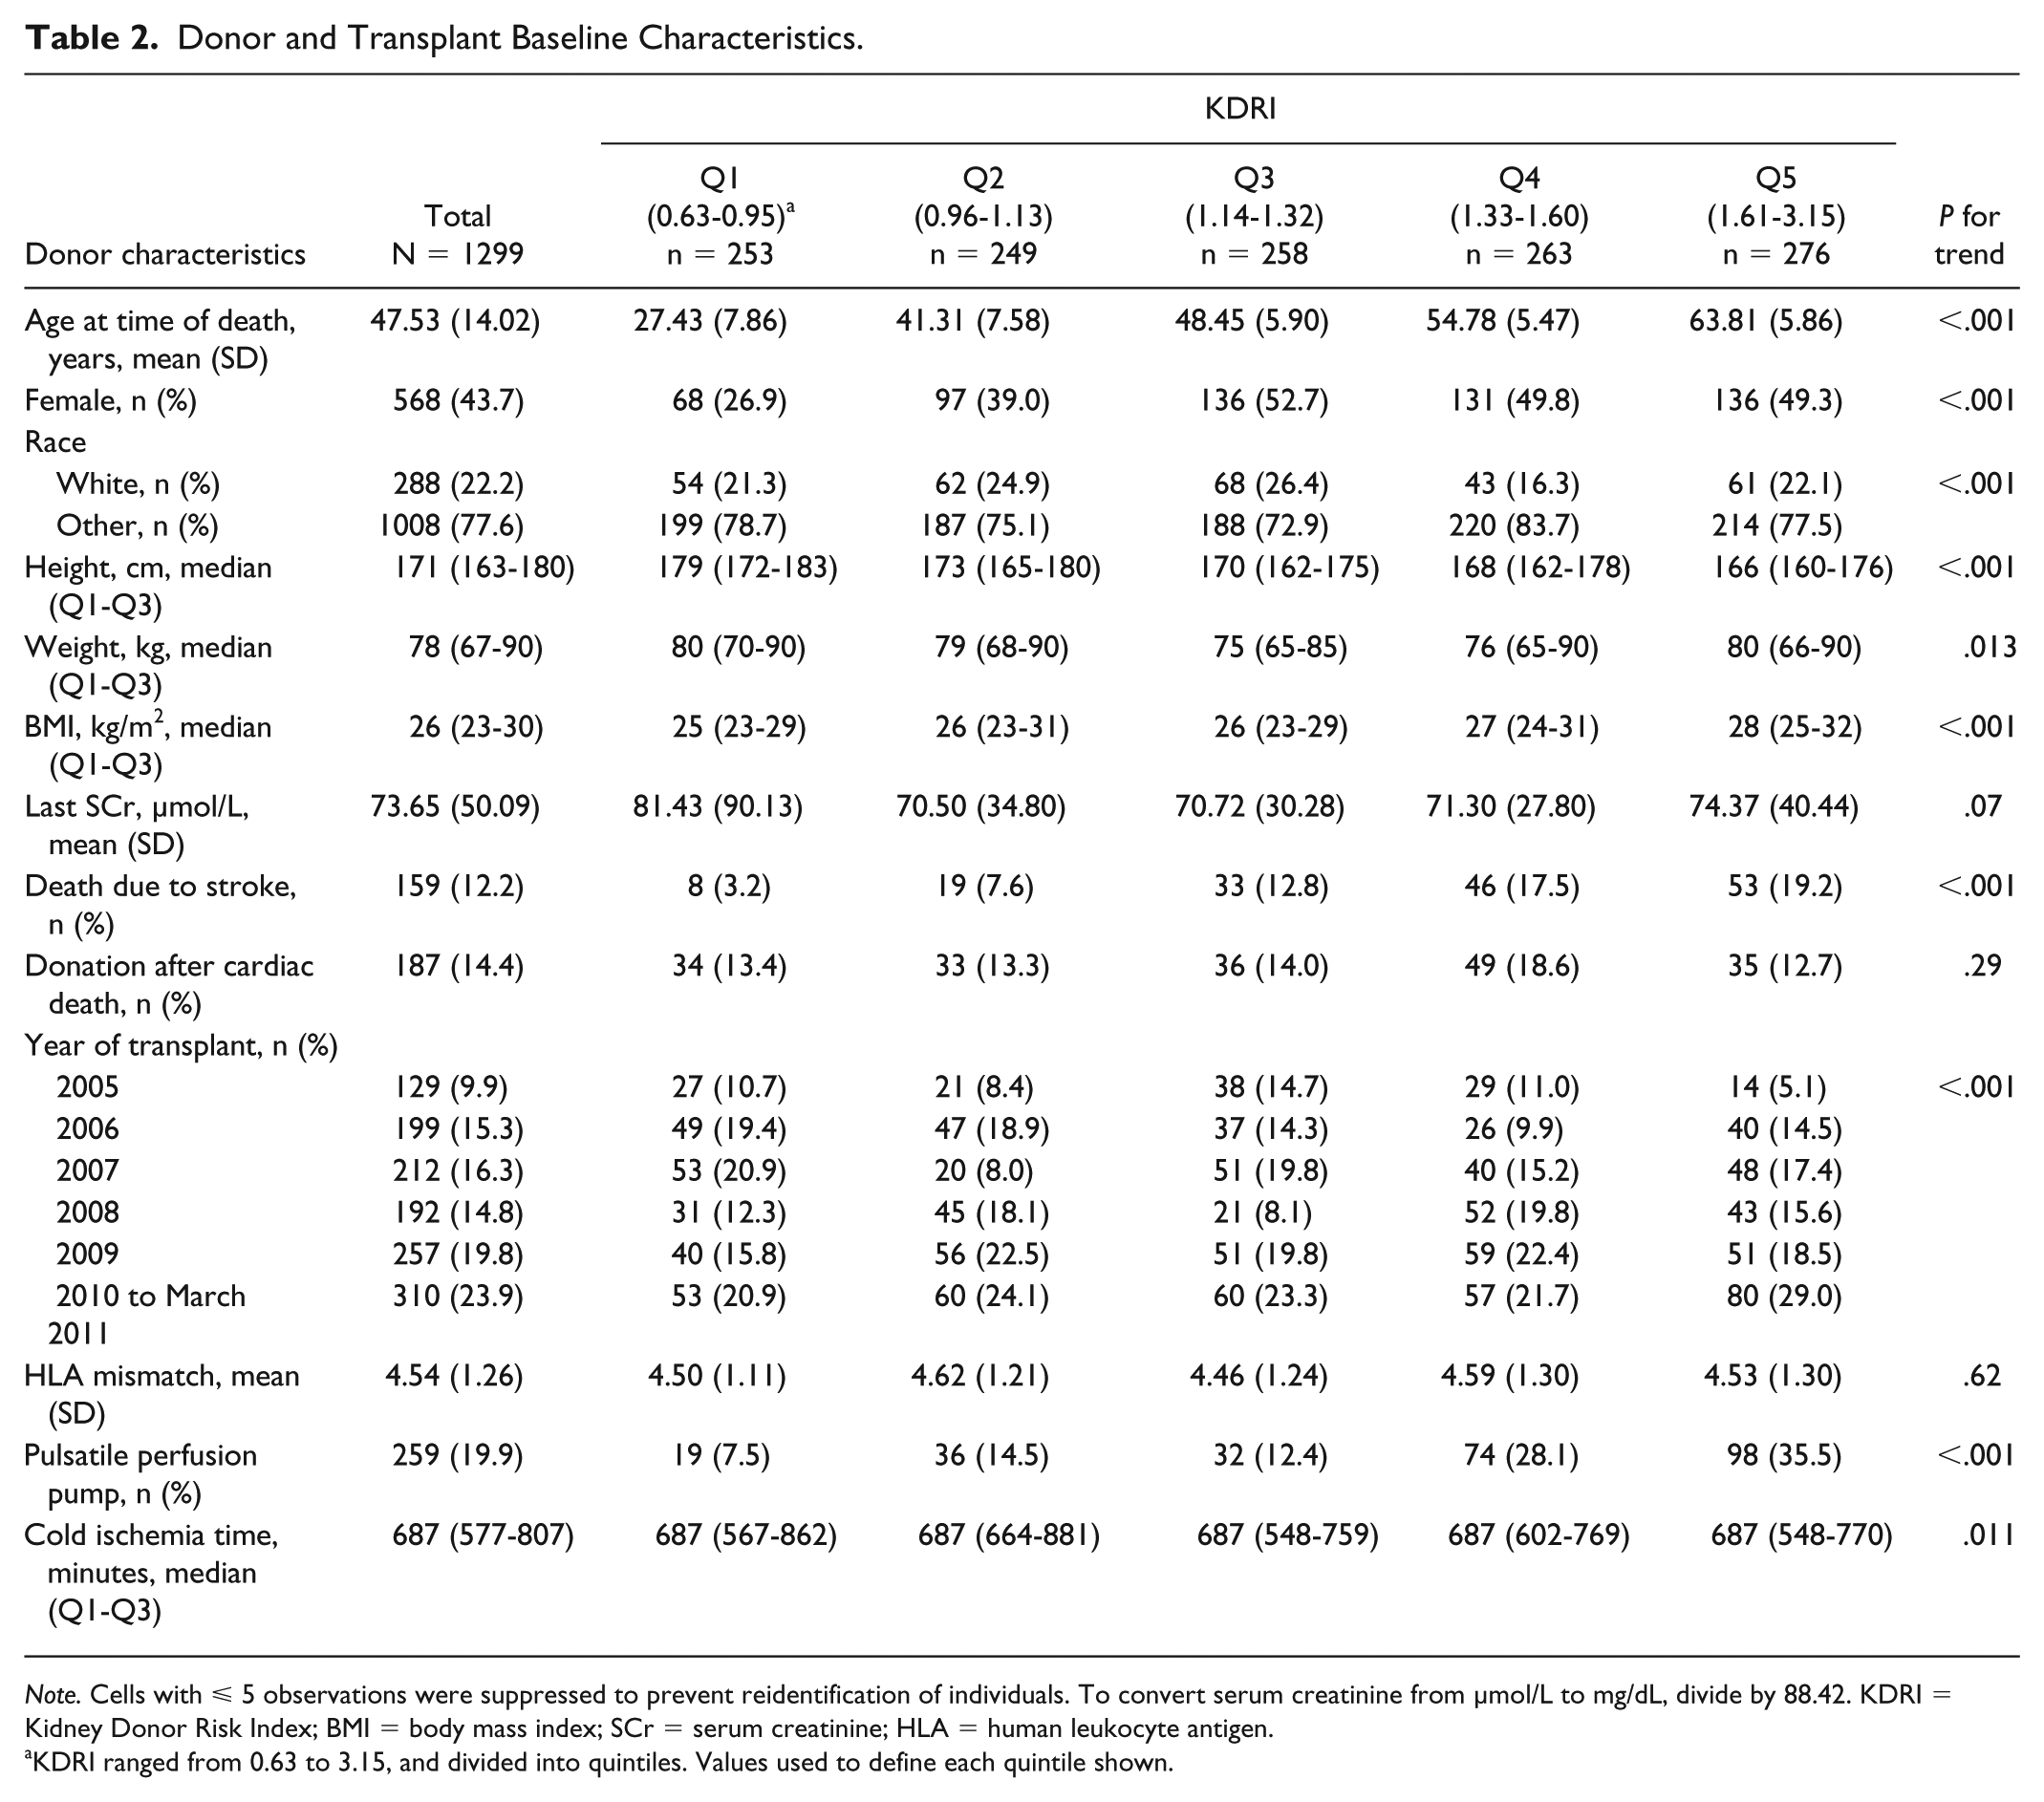
Note. Cells with ⩽ 5 observations were suppressed to prevent reidentification of individuals. To convert serum creatinine from µmol/L to mg/dL, divide by 88.42. KDRI = Kidney Donor Risk Index; BMI = body mass index; SCr = serum creatinine; HLA = human leukocyte antigen.
KDRI ranged from 0.63 to 3.15, and divided into quintiles. Values used to define each quintile shown.
The median follow-up time was 5.5 years (interquartile range: 4.2-7.5 years) with 7028 total person-years of follow-up for the primary outcome. In total, there were 417 total graft losses (graft failure or death), with 39.6, 50.2, 63.3, 57.1, and 90.2 events per 1000 patient years for each KDRI quintile, respectively. Figure 3A shows the Kaplan–Meier survival curves for each quintile. Figure 4 shows increasing adjusted hazard ratios for total graft loss across KDRI quintiles, which were statistically significant for Q3 (HR = 1.58, 95% CI = 1.13-2.22) to Q5 (HR = 2.15, 95% CI = 1.54-2.99). A plot of log(HR) for total graft loss by KDRI, where KDRI was modeled using a 3-knot RCS function, showed a linear relationship (p-value for linearity = 0.36, plot not shown). The 5-year c-statistic for total graft loss by KDRI quintile was 0.59.

Kaplan–Meier event curves by KDRI quintile for (A) total graft loss (composite); (B) death-censored graft loss; (C) death with graft function; (D) all-cause mortality.
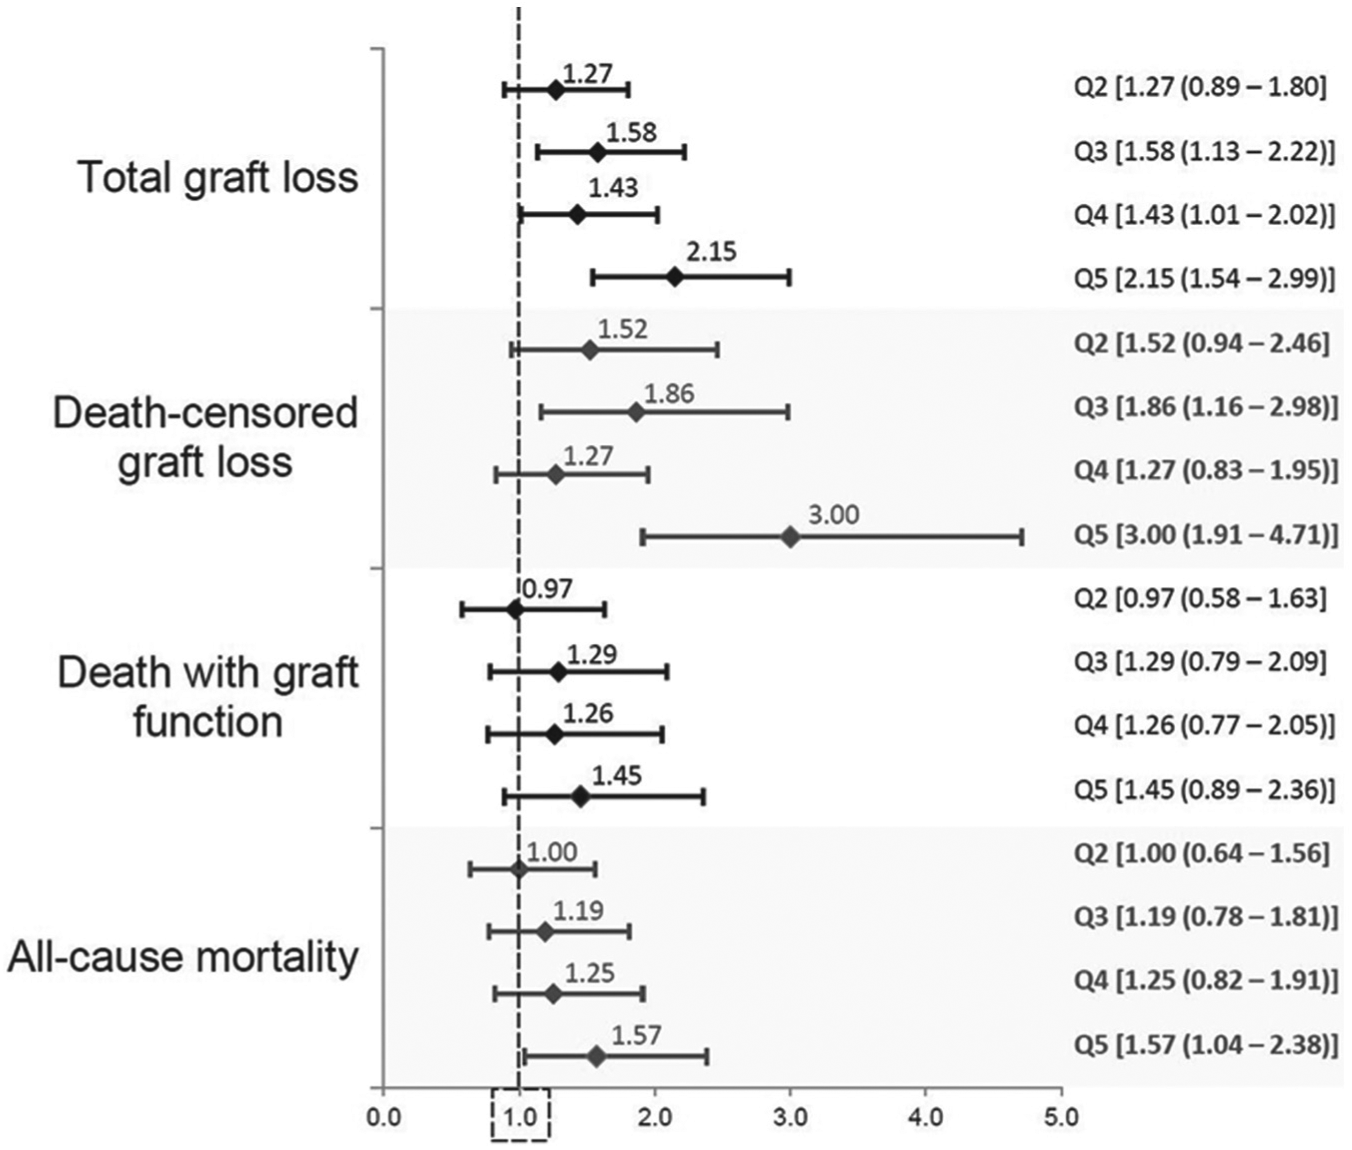
Adjusted relative hazards for study endpoints comparing recipients across Kidney Donor Risk Index quintiles (referent group for each outcome is the first quintile).
There were 228 death-censored graft loss events, with the incidence rate per 1000 patient years increasing across the KDRI quintiles. Kaplan–Meier survival curves for death-censored graft loss are shown in Figure 3B. At 5 years, the cumulative incidences from Q1 to Q5 were 10.3%, 15.1%, 17.7%, 13.2%, and 22.0%, respectively. The adjusted relative hazard was statistically and clinically significant for the highest quintile (HR = 3.00, 95% CI = 1.91-4.71). The 5-year c-statistic for death-censored graft loss by KDRI quintile was 0.59.
There were 254 deaths over the study period, of which 189 were deaths with a functioning graft. Survival curves are shown in Figures 3C and 3D. There was no statistically significant increase in the risk for death with graft function with increasing KDRI value. For all-cause mortality, the proportional hazards assumption did not hold. Accordingly, the average HR over the follow-up period was higher for the highest KDRI quintile (HR = 1.57, 95% CI = 1.04-2.38) (see Figure 4).
Sensitivity Analyses
Transplant outcomes were also assessed by KDRI categories used in the original validation. 6 There were 78 transplants with donor KDRI < 0.79, 180 with KDRI 0.79 to <0.96, 272 with KDRI 0.96 to <1.15, 387 with KDRI 1.15 to <1.45, and 382 with KDRI ⩾ 1.45. Baseline characteristics comparing categories were similar to the main analysis. Graft loss was only significantly increased for those with KDRI ⩾ 1.45 (total graft loss: HR = 1.71 95% CI = 1.07-2.72; death-censored graft loss: HR = 2.34, 95% CI = 1.21-4.52). The risk of death was not significantly increased.
To explore whether models with KDRI could better discriminate higher risk kidneys from models using only donor age, a model with donor age (parameterized as a continuous variable for the outcome of total graft loss) was compared with the same model with the addition of KDRI (as a continuous variable). There was a significant improvement in model performance with the addition of KDRI (P = .009). The c-statistic and Akaike information criterion (AIC) for the model using only donor age were 0.54 and 5648.1, respectively, while the c-statistic and AIC for the model with donor age and KDRI were 0.58 and 5633.3, respectively.
In contrast, donor age did not seem to add prognostic information to a model that already included KDRI (P = .79).
Discussion
In this study, higher KDRI values were associated with a higher relative hazard for total graft loss (2-fold increase for the highest quintile) and death-censored graft loss (3-fold increase for the highest quintile). The risk of death with graft function following transplantation did not significantly increase as a function of KDRI. In light of recent data showing that ECD as a construct for “higher risk” may not add more than donor age alone in risk stratifying the outcomes of a Canadian kidney transplant population, 4 these results suggest that the KDRI may be an improvement compared to the ECD system.
Recently, Rose et al published an analysis looking at the KDRI in a population of deceased donor kidney transplant recipients in British Columbia (BC), Canada. 15 They studied 785 deceased donor kidney transplants from 2005 to 2014 and found that there was no significant difference in allograft survival in the first 3 quintiles of KDRI, while the fourth and fifth quintiles had significantly worse graft survival compared with the first quintile. Furthermore, the KDRI and donor age performed similarly in their cohort. This differs from our study where multiple model comparisons suggested that KDRI added prognostic information above and beyond donor age (c-statistic 0.54 for donor age, and 0.58 for donor age and KDRI). These differing results may be partially explained by the differences in the patient populations examined. Both our Ontario cohort and their BC cohort had similar KDRI ranges (maximum 3.15 in Ontario and 3.06 in BC—both notably lower than the US derivation cohort), with the highest scores driven by donor age. Nonetheless, the donor population in Ontario appeared to have proportionately more “higher risk” characteristics compared with BC: slightly higher median BMI (26 vs 23 kg/m2), more hypertension (37% vs 24%) and diabetes (11% vs 5%), and more DCD (14% vs 10%). There was also a higher proportion of Black recipients in our Ontario cohort. While the discriminatory ability of the KDRI models was only modestly better than chance, results were comparable to the c-statistic observed by Rose et al.
In 2013, Gourishankar et al assessed the performance of the KDRI in a single center in Alberta, Canada. 16 In this study, they examined the 15-variable KDRI, which includes the additional characteristics of the degree of human leukocyte antigen matching, cold ischemic time, and transplant procedure type (single vs double vs en-bloc). 6 There is minimal difference in the predictive ability of the full-version KDRI compared with the 10-variable, donor-only version (c-statistic = 0.601 vs 0.596, respectively). 7 Using the same KDRI quintiles used in the original validation, and nonparametric statistical methods, they found that there was a significant difference in graft survival by KDRI strata (P = .002). Two studies from Korea have also assessed KDRI.17,18 In each, KDRI was calculated for their deceased donors, and a KDRI cutoff value (median KDRI of 1.119 17 or an arbitrary cutoff value of 1.4 18 ) was used to classify “higher” vs “lower” risk. Both studies highlighted that the higher KDRI group was associated with a higher risk of graft failure relative to the lower KDRI group. One of the key advantages of the KDRI over the ECD dichotomy is its continuous nature. Comparing recipients of “higher” vs “lower” KDRI kidneys detracts from the inherent advantage of the KDRI. In the current study, the continuous nature of the KDRI was assessed with RCSs, and a linear relationship was confirmed. Our presentation of results in quintiles better highlights dose-response relationships to ease clinical interpretability.
Watson and colleagues developed a United Kingdom Kidney Donor Risk Index (UKKDRI) in 2012, noting that compared with the United States, the proportion of diabetic donors and ethnic minorities were relatively small. 19 In this study of 7620 deceased donor kidney recipients, the most important donor-related factors influencing graft survival were found to be age, history of hypertension, weight, time of hospital stay, and vasopressor use. The c-statistic for the UKKDRI was similar to the US-based KDRI (0.62 vs 0.63), both with only fair probabilities of discriminating patients with longer vs shorter graft survivals beyond chance alone. 20
One of the key intents of the transition from the ECD to KDPI in the United States was to decrease discard rates. Recently, Bae et al evaluated the changes in discard rate after the introduction of the KDPI in the United States. 21 They found no significant change in the discard rate from the ECD era to the KDPI era among the entire population. However, the transition may have resulted in an unintentional increase in the discard rate for kidneys previously labeled as SCD but with a KDPI >85 (odds ratio = 1.42, 95% CI = 1.07-1.89). Some centers may be using the KDPI as a metric to determine donor suitability or a reason to reject a kidney, which was not the intent of its design.
Interestingly, the maximum KDRI in the original study from the United States was 4.2, 6 while in our study, the maximum KDRI was 3.15. Canadian transplant physicians may be more conservative, perhaps discarding those kidneys with the highest risk characteristics (such as elevated serum creatinine), and thus highest KDRI values. This is corroborated by previous work that showed that the vast majority (~80%) of ECD kidneys were classified as such on the basis of donor age ⩾ 60 years. 4 Moreover, certain high-risk characteristics (eg, hepatitis C positive donors) were uncommon in the Canadian donor population. An analysis of discards was beyond the scope of this analysis, but may provide insights on determinants of use and nonuse of deceased donor kidneys in Canada. The introduction of a new kidney allocation scheme in Canada would need to consider unintended outcomes of labeling. Staggered implementation of novel allocation schemes (potentially in a randomized fashion) could allow for a more formal assessment of both intended and unintended consequences.
The major strength of this study is that it is the largest, multicenter assessment of the KDRI in a non-US-based setting. Using a methodologically rigorous approach, we provide information that can help guide changes to the practice of deceased donor kidney transplantation. Limitations of this study include the incomplete capture of covariate data in large health care databases. For example, outpatient prescription claims for immunosuppression are primarily captured for patients over the age of 65 years. 22 Identifying acute rejection episodes via health care databases requires further validation. Due to relatively small numbers, our data did not allow for meaningful subgroup analyses. These analyses would be relevant as prior work has suggested that there may be a significant interaction by recipient characteristics, whereby the effect of KDRI on graft outcomes is less pronounced for older, diabetic, or black recipients.23,24 Procurement kidney biopsies are not routinely performed across transplant centers in Canada; thus, the relevance of incorporating such data into risk prediction is not known.
In summary, this study highlights the generalizability of the KDRI for the evaluation of deceased donor kidney quality in a non-US transplant population and defines the role of KDRI in informing risk assessment above and beyond donor age alone. Future directions include further refining KDRI to maximize its performance in non-US jurisdictions, an evaluation of variations in KDRI across jurisdictions, and identifying recipient populations most likely to benefit from the highest KDRI kidneys.
Footnotes
List of Abbreviations
ADG, Aggregated Diagnosis Groups; CI, confidence interval; CIHI, Canadian Institute for Health Information; CORR, Canadian Organ Replacement Register; DCD, donation after cardiac death; ECD, expanded criteria donor; ESRD, end-stage renal disease; HR, hazard ratio; ICES, Institute for Clinical Evaluative Sciences; KDPI, Kidney Donor Profile Index; KDRI, Kidney Donor Risk Index; OHIP, Ontario Health Insurance Plan; OPTN, Organ Procurement and Transplantation Network; OR, odds ratio; RCS, restricted cubic spline; SCD, standard criteria donor; TGLN, Trillium Gift of Life Network; UKKDRI, United Kingdom Kidney Donor Risk Index.
Ethics Approval and Consent to Participate
This study was approved by the institutional review board at the Sunnybrook Health Sciences Centre, Toronto, Canada.
Consent for Publication
All authors consent for publication.
Availability of Data and Materials
See Data Sources for details on where the data supporting these findings can be found.
Author Contributions
Study concept and design: Young, Knoll, Garg, Lok, and Kim. Acquisition of data: Young, Knoll, Garg, and Kim. Analysis and interpretation of data: Young, Dixon, Knoll, Garg, Lok, Lam, Kim, and McArthur. Drafting of the manuscript: Young and Kim. Critical revision of the manuscript for important intellectual content: Young, Dixon, Knoll, Garg, Lok, Lam, Kim, and McArthur. Statistical analysis: Young, Dixon, Kim, and McArthur. Obtained funding: Young and Kim. Administrative, technical, or material support: Knoll, Garg, and Kim. Study supervision: Knoll and Kim.
Declaration of Conflicting Interests
The author(s) declared no potential conflicts of interest with respect to the research, authorship, and/or publication of this article.
Funding
The author(s) disclosed receipt of the following financial support for the research, authorship, and/or publication of this article: This study was supported by the Institute for Clinical Evaluative Sciences (ICES), which is funded by an annual grant from the Ontario Ministry of Health and Long-Term Care (MOHLTC). The authors acknowledge that the data used in this study were provided by the Trillium Gift of Life Network (Toronto, Ontario), which is funded by the Government of Ontario. Parts of this material are based on data and information compiled and provided by Canadian Institute for Health Information (CIHI). The opinions, results, view, and conclusions reported in this paper are those of the authors and do not necessarily reflect those of TGLN or CIHI.