
Abstract
This study examines the impact of diet on health in different districts of mid-19th century London. Surveys of London diets and living condition were compared with mortality data between 1851 and 1880. Despite an abundance of fresh foods reaching London, the very poor labouring population living in the inner boroughs between 1850 and 1861 had great difficulty obtaining sufficient nourishment because of its cost. This population showed high death rates from infectious diseases, notably pulmonary tuberculosis, which was endemic and is typically associated with poor nutrition. This high death rate was exacerbated by more deaths from gastrointestinal infections associated with a polluted water supply from the river Thames. By contrast, the poor in the outer suburbs enjoyed both more nutritious diets and cleaner water which was associated with lower death rates comparable to those in rural Britain. Outer suburbs retained a relatively rural life-style associated with cleaner water and an abundance of locally grown food. In the following two decades, there was a significant reduction in the death rates from gastrointestinal infections in the inner boroughs which correlated with the major improvements in London’s water supply. The decline in death rates from tuberculosis and other infectious disease was inconsistent and increased in some boroughs, suggesting patchy economic improvement and a persisting limited ability of many of London’s poor to afford a nutritious diet.
Introduction
A reappraisal of the mid-19th century urban diet suggested that it provided the basis for a significant protection against disease. 1 This represents an over-simplification because there was no single urban environment. There remained until the 20th century, a relatively high death rate from infectious disease among children and young adults. In London itself, the largest city in Britain, there was great diversity in culture, living conditions and dietary practice as well as mortality rates. It can therefore be quite misleading to ignore the variety of small populations and their different living conditions. 2 The aim of this study is to review the mid-19th century diets in London and their likely impact on health. This is pertinent in the light of more recent epidemiological and experimental data on the relationship between diet, immunity and resistance to infectious disease in low- and middle-income countries.3,4
Methods
Contemporary surveys of diet and living condition, particularly those of Smith, Mayhew and Dodds as well as more recent studies, were reviewed. The information was compared with census and mortality data from mid-19th century Britain. The mortality data were taken from the decennial summaries in the 25th and 45th Reports of the Registrar General of Births, Deaths and Marriages in England. Death rates in the different areas of London were adjusted for age using the mean population in England and Wales between 1851 and 1860 as the reference. The death rates were usually not adjusted for those occurring in workhouse infirmaries or hospitals because only a few of these were located outside their respective districts and represent only a tiny proportion of London deaths in mid-century. 5 Average annual birth rates and death rates from all causes, gastrointestinal disease and pulmonary tuberculosis per 1000 population were calculated along with infant mortality rates and death rates of children under five years for each London registration district. Data for both sexes were combined as sex-differences were relatively small compared with regional differences. The category of gastrointestinal disease included those diagnosed as diarrhoea, dysentery, cholera, typhoid and typhus. Typhus was included because it was not clearly distinguished from typhoid earlier in the century and was later shown to cause only a few deaths compared with typhoid fever. Although there were several cholera epidemics during this period, they caused relatively few deaths compared with other gastrointestinal infections.
Regional characteristics of London
Although age-old patterns of poverty and wealth were changing, apart from a small minority of gentry, industrialists, commercial and professionals, the vast majority of the population in London were by today’s standards economically poor. 6 During the middle of the 19th century, London was made up of distinctive communities that mirrored the diversity of the rest of the United Kingdom. 7 On the north bank of the Thames, there were the three components of historic London, the City, the West End with more numerous wealthy residents and the predominantly industrial East End. Until the middle of the 19th century, the old City of London was a human place where houses and banks stood side-by-side, washer-women and brokers shared the streets with free roaming livestock. Whilst the City constituted the most important financial centre in Great Britain, it was not the overwhelming presence it would become later in the century. 8 Nevertheless, the City of London was the richest of all the central metropolitan districts.
Until mid-century, manufacturing was the most important source of employment. London contained distinctive industries such as silk weaving in Bethnal Green and Whitechapel, instrument and watch making in Clerkenwell and St Luke, printing in parts of the City and Finsbury and clothing trades in a number of boroughs. Although the inhabitants of the eastern part of London had always been characterised by low paid and insecure employment at the docks, economic factors after 1825 exerted a major part in determining conditions within the area. The collapse of silk weaving was responsible for the high levels of distress. Cheap production of clothing and shoes expanded at the expense of the more skilled branch of trade in the West End. 9
On the South Bank, there was a ribbon of development that included Lambeth, Bermondsey and Southwark. Trades that tended to accumulate south of the river were those which were more odorous and noisome such as tanning, textile manufacturing, brewing and distilling along with metal working, machine and tool manufacture as traditional industries declined. 10
Beyond these inner boroughs were extensive suburban areas spreading crab-like along the roads, embracing ancient villages separated by shrinking common land, pasture and woodland. Although outer boroughs such as Lewisham and Hampstead were being rapidly urbanised along with improved transport links, they retained their rural characteristics in mid-century. Like other villages at a similar distance from central London, they were popular places of residence for the wealthy. In addition, the 1851 census showed that over 20 in 1000 Lewisham residents were described as farmers, graziers, farm labourers, gardeners or nurserymen. This compared with about 80 in 1000 residents in the country at large and 100 in the rural county of Herefordshire. Market gardening on the clay soils of the south London boroughs and other areas within 10 miles of the centre of London had developed to supply the needs of the population. 11 Market gardening and farming had become highly productive because of the availability and ease of transport of a vast supply of manure from the metropolis. In mid-century Hampstead, there were still over 600 acres being farmed, mostly pasture and grassland for hay and for milk production.
Dietary patterns in London
In the late 18th and early 19th centuries, Londoners benefitted from the improved transport links and it role as a major port for the import of a great variety of foods.12,13 Mayhew describes the huge amount and variety of foods conveyed into London each day in the middle of the 19th century. Large quantities of beef, lamb, pork and veal came via Smithfield and other markets slaughtered on site. Increasingly, meat was brought in from the country by train. Large quantities of poultry and game came to London through Leadenhall market. Vast quantities of fish were also brought in from the coast by train rather than along the Thames on the tide. Fresh vegetables and fruit were conveyed from market gardens within a 12-mile radius of the City along with imported fruit and nuts. 12 Although traditionally eggs had also been transported from the surrounding countryside, Mayhew reports that by mid-century, the overwhelming number of eggs was imported from France. Milk and other milk products, however, were produced locally mostly in the outer boroughs. It was costly and of variable quality sometimes watered down for the poor. Bread was usually purchased from bakers. Although it was white, flour was traditionally ground, not highly sifted or subject to roller milling, thus retaining some of the nutrients of whole grains.
Poorer people purchased many of these foods in small quantities on the London streets or at the door from costermongers rather than in more expensive shops. 12 Although fruit was regarded as a luxury, poor people bought fruit at the peak of the season when cheap. Hazelnuts were sold in every poor shop in London. Meat was expensive but the poor purchased cheaper cuts and offal. 14 A relatively small proportion of poultry was sold on the streets as it was quite expensive.
Although fish was regarded as inferior to meat, Mayhew remarked on the large quantities of cheap fish which were consumed by the poor as he noted that all their dwellings smelt horribly of cooked fish. Although fish supply was seasonable, some species of cheap fish were nearly always available. Beer was the principle beverage in London. Tea with sugar was widely consumed as it was warm alongside a cold meal although overall sugar consumption was still far less than later in the late 19th and early 20th centuries. In addition, large amounts of cheap prepared foods and drinks were available on London streets. These included hot eels, pickled whelks, oysters, sheep’s trotters, pea soup, fried fish, ham sandwiches, hot green peas, kidney puddings, meat puddings, beef, mutton, kidney and eel pies as well as baked potatoes. Mayhew estimated that during the potato season, from the end of September through to March, over 200 hundredweight of baked potatoes were sold every day on the streets of London. 12
This abundant range of foods would now be considered to provide the basis for a healthy natural diet and supports the analysis of Clayton and Rowbotham that showed that the urban mid-19th century diet was excellent. However, analysis of actual food routines showed that unlike some rural areas where payment in kind often prevailed, the quantity of food of families in urban areas was limited by its cost. Better off working families on weekly incomes of up to £4 would have a very good diet with a plentiful supply of meat, fish, cheese, milk with vegetables and fruit in season in addition to bread. At the lowest income levels of up to £1 per week, families would have struggled. They ate large amounts of bread but very limited access to fats, meat and vegetables, with infants being fed on water-based pap rather than cow’s milk after weaning. 14
In 1863, Smith surveyed the diets of the very poorest in London, the silk weavers and throwsters in Bethnal Green and Whitechapel (Spitalfields) and needlewomen, albeit those in work not the unemployed. Bread with some butter was the main component of these diets supplemented by potatoes, green vegetables, and small amounts of meat, milk and cheese. 15 Tea with sugar had increasingly supplemented beer for the very poorest. Mayhew described many of these poor buying sprats and other cheap fish in view of its wide availability and cheapness.
The nutritional adequacy of the diets of the very poor studied by Smith have been difficult to assess because evaluation was by family and distribution within the family was uneven, with foods such as meat and cheese traditionally going to the bread-winner, penalising children and women. However, the analysis by Barker and colleagues suggested that calorie and protein intake was likely to have been borderline supplying little over 2000 Kcal and 55 g protein per day for the very poorest sedentary workers. 16 Diets are likely to have been inadequate among the unemployed.
The City of London remained an exception because of its large number of ancient and wealthy charities. Unlike all other London boroughs, it refused to build workhouses until 1867 but spent vast sums of money on its paupers giving outdoor relief largely in cash but also generous allowances of food and drink. 17 Children of the poor were fed and educated and the old looked after.
In contrast to much of central London, the outer regions of London such as Hampstead and Lewisham retained life-styles similar to more rural areas of Britain with more direct access to locally produced foods from the pastures and highly productive market gardens producing potatoes and a wide range of vegetables and fruit alongside corn and hay as well as pasture for cattle and milk production.
Height and nutrition
Investigation of the heights of male military recruits during the 19th century has shown that men from rural Scotland, Ireland and the north of England were generally taller than their southern English counterparts which is believed to be largely the result of better nutrition during childhood. 18 Despite men in rural communities being generally taller, the report of the Anthropometric Committee in 1878 suggested that male Londoners were taller than men in some southern rural counties and in rural Wales. 19 Moreover, from a study of more recently available data of male heights in the 1840s Register of Seaman’s Tickets, Humphries and Leunig were able to match heights to the precise place of birth of seamen. 20 They showed that poor men born in the periphery of London were taller than their counterparts born in central boroughs. This supports the idea that the diets in the outer London boroughs were likely to have been better for the poor than those growing up in central London.
London water supply
The quality of water began to draw adverse comment early in the 19th century and it deteriorated rapidly after 1815 in the face of increasing urban growth. 21 Water in London was largely provided by several different companies. During the cholera epidemics of 1848–1849 and 1853–1854, John Snow recognised that the most polluted water was being supplied by companies drawing water from the Thames below the outlets of London sewers, notably the Southwark and Vauxhall Water Company. 22 Cleaner water was being supplied to north London and the City of London by the New River Company and the West End was provided for by the innovative Chelsea Water Company drawing water from the Thames upstream of London sewers. 21
By 1866 when the last cholera epidemic reached London, all water companies drawing water from the Thames had moved their intake above Teddington and were filtering their water prior to distribution so the incidence of cholera was reduced. By contrast in the north east of London, water quality in the river Lea used by the New River Company had deteriorated since 1854 due to additional sewers discharging from Stratford, West Ham and from East London. This was demonstrated by the resulting higher mortality rates in the north east of London from cholera in 1866 than in 1853 and 1854. 22
Patterns of disease
A summary of the overall death rates per 1000 population in the different registration districts of London, infant and childhood mortality rates and death rates from gastrointestinal infections and pulmonary tuberculosis (phthisis) for each of the 10 years 1851–1860 and 1871–1880 are provided in Table 1 and Figures 1 to 4.
Map of London registration districts showing total death rates from all causes per 1000 population. Numbers denote district names given in Table 1. Adjusted death rates using mean population in England and Wales 1851–1860 as reference. a: not applicable. Kensington included Fulham until 1875. Fulham separated in 1875 from Kensington so only six years. Westminster St Margaret moved into St George Hanover Square in 1871–1880. §St Martin in Fields: abolished 1868 and moved to Strand. Hampstead without smallpox deaths in an all-London fever hospital opened in Hampstead in 1869. Clerkenwell and ‡‡St Luke incorporated into Holborn in 1869. §§East London and West London merged into London City in 1870. Stepney and Mile End Old Town were separated in 1857. St Olave had a very poorly managed hospital for paupers. Bermondsey abolished in 1870 and moved into St Olave Southwark. §§§St George the Martyr Southwark abolished 1870 moved into St Saviour Southwark. Newington was abolished 1870 and moved into St Saviour Southwark. Rotherhithe abolished in 1870 to be part of St Olave. Woolwich created in 1868. Parish of Woolwich from Greenwich and Charlton, Kidbrooke, and Plumstead, from Lewisham in 1861.

Deaths from diseases such as atherosclerosis and ischaemic heart disease were uncommon, if not rare compared with their epidemic proportions in the 20th century. Cancer was also infrequent. 23 Whilst the overall mid-century death rate in England and Wales and London from heart disease was around 1.6 per 1000 population, much of this was the sequelae of infection, notably rheumatic fever. Autopsies conducted between 1868 and 1982 at St Bartholomew’s Hospital in the City of London also showed that ischaemic heart disease and atherosclerosis were uncommon until the 20th century. 24
Most deaths were the result of infectious disease or its sequelae. The highest overall mortalities during the period 1851–1860 were in the central districts, particularly in those bordering the Thames although the City of London itself showed a lower overall mortality rate (Figure 1). Infant and childhood mortality rates and death rates from gastrointestinal infections followed this geographical pattern (Figures 2 and 3). Whilst higher death rates from pulmonary tuberculosis were present in these central areas, some other boroughs also showed higher rates (Figure 4).
Map of London registration districts showing death rate of children under five years per 100 births. Numbers denote district names given in Table 1. Map of London registration districts showing death rates from gastrointestinal infections per 1000 population. Numbers denote district names given in Table 1. Map of London registration districts showing death rates from pulmonary tuberculosis (phthisis) per 1000 population. Numbers denote district names given in Table 1.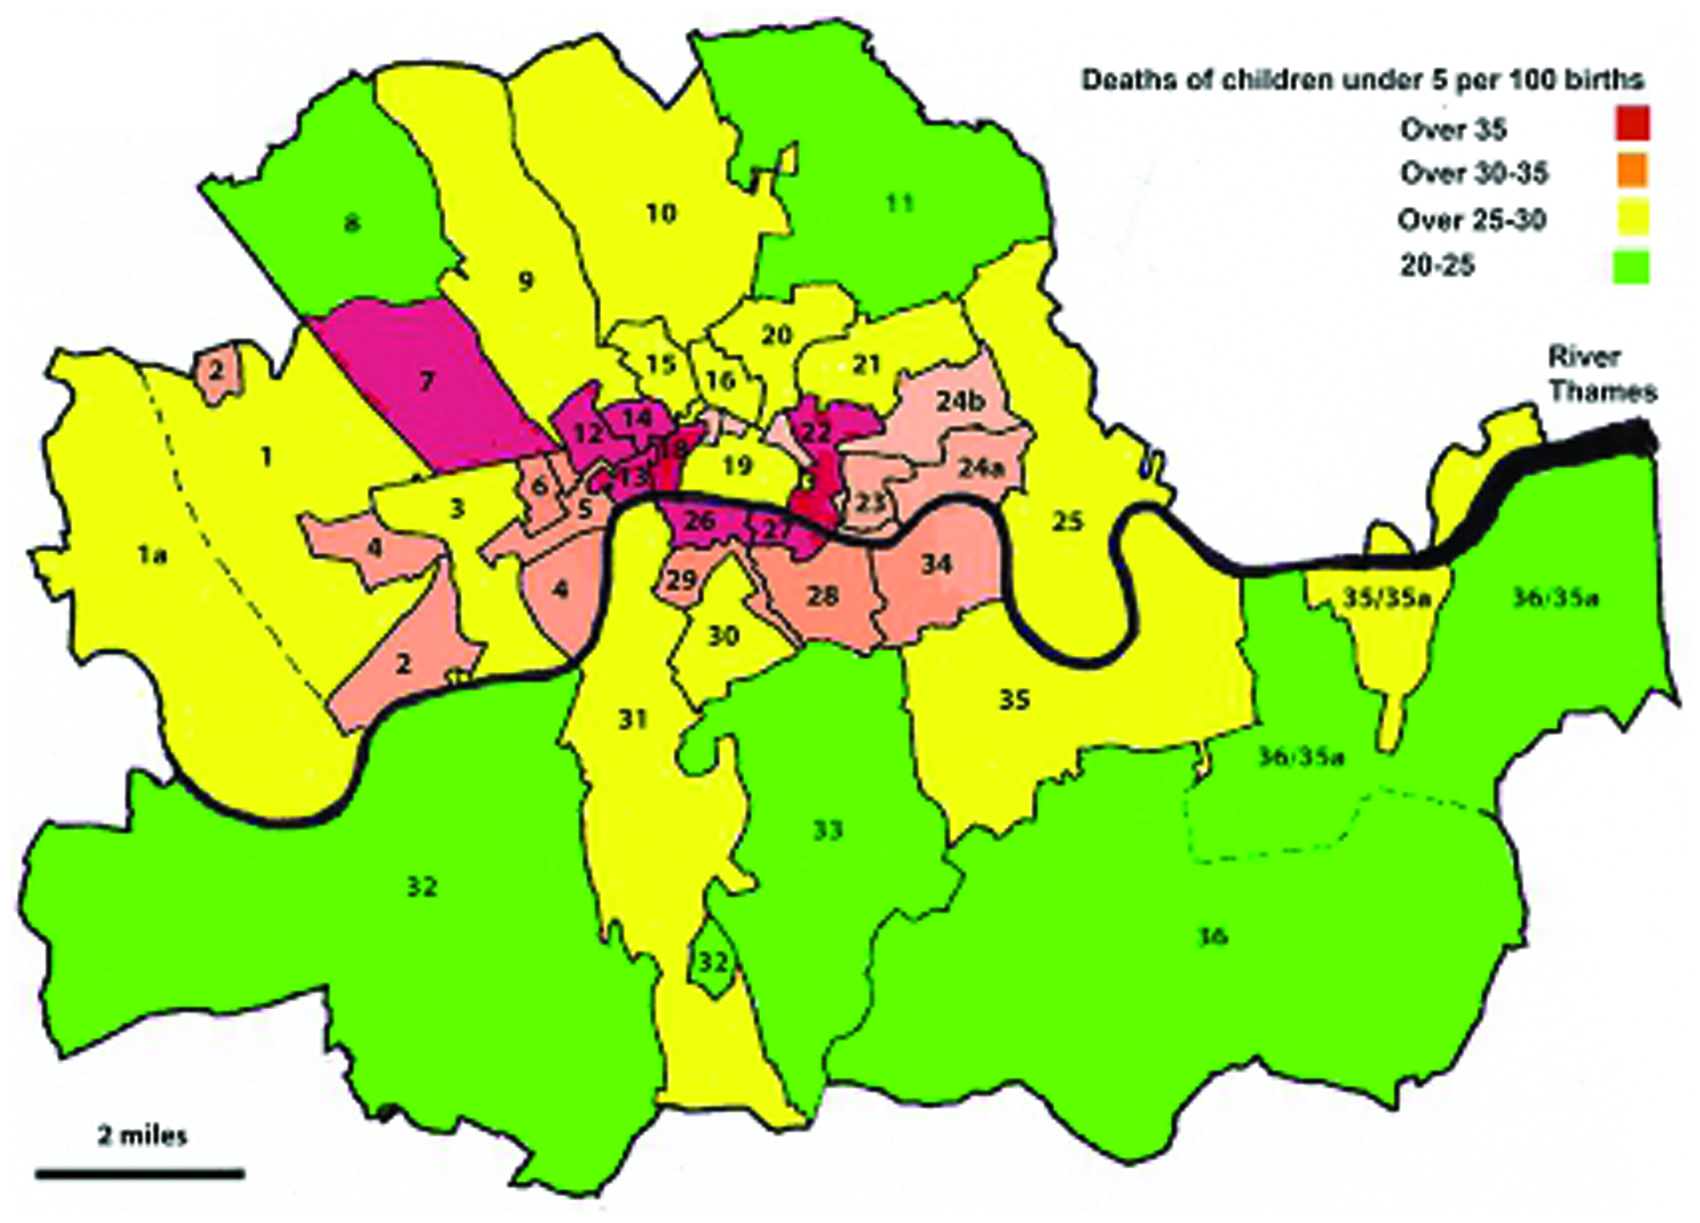


A similar distribution was observed in the decade 1871–1880, although one of the most striking differences between the two decades was the significant decrease in the death rate from gastrointestinal infections in the central districts to a general level seen in the rest of the country (Table 1). Although overall London death rate from pulmonary tuberculosis also declined, it was less consistent, and death rates increased in some boroughs.
Some outer London registration districts, notably Hampstead and Lewisham, showed the lowest overall mortality rates during both decades. The death rates in the City of London appeared higher in the latter period but this is confounded by the combination of the City with East and West London registration districts both with higher mortality rates.
Discussion
Much of our information about food development in the late 18th and the 19th century is based on data from around London. This information underpinned the analysis by Clayton and Rowbotham that suggested the mid-Victorian urban diet provided the basis for a significant protection against disease. 1 The sheer diversity of local fresh foods reaching London described by Mayhew supports the view that the diet of many Londoners in the mid-19th century was indeed likely to be highly protective.
Whilst the availability of this mid-Victorian diet was associated with a low incidence of atherosclerosis, ischaemic heart disease and cancer, there was a relatively high death rate from infectious disease, notably from childhood diseases such as measles, whooping cough and scarlet fever as well as infantile diarrhoea and among young adults from pulmonary tuberculosis. There is now overwhelming evidence from both experimental work and epidemiological research in middle- and low-income countries that poor nutrition has an adverse effect on resistance to infectious disease mediated by weakened immune responses.25–27 Poor nutrition does not affect all infections equally. Some such as bacterial and viral diarrhoea, measles, pertussis and tuberculosis, all important causes of death in 19th century London, poor nutrition has been shown to influence the clinical course and final outcome of the disease. 25
It is therefore not surprisingly that higher death rates from infections were concentrated in the poorer areas of London, the East End and along parts of both banks of the river Thames. The studies of Smith showed that many of the poor in these boroughs, even when in work, often struggled to obtain an adequate diet simply by virtue of its cost. 15 The high death rate from gastrointestinal infections as a result of a polluted water supply from the Thames in these boroughs during mid-century would have exacerbated ill-health and may itself have had a direct or indirect detrimental effect on nutritional status.4,28 It is remarkable that between 1851 and 1860, the City of London, although close to the river Thames and surrounded by parishes with high mortality from infectious disease, showed much lower overall mortality as well as lower death rates from gastrointestinal infection and tuberculosis, lower than in England and Wales as a whole. The fact that the City was supplied by clean water from the north of London and spent vast sums of money supporting and feeding the poor, underlines the importance of clean water and a plentiful diet. As the itinerant destitute from all over Britain flocked to the City to benefit from this largess, this system of poor relief ultimately became unsustainable. 17
In the decade 1871–1880, there was a decline in mortality rates in these inner boroughs although this was due to a significant decline in the mortality rates from gastrointestinal infections that correlated with the improved water supply. However, infant mortality remained static and the death rates from pulmonary tuberculosis showed a patchy decline and increased in some boroughs. This suggests that the poor in these areas were still struggling to obtain adequate nutrition despite decreasing food costs. 29
Like the City of London, the outer boroughs such as Hampstead and Lewisham also showed lower death rates from infectious disease during both decades studied. Because farming had evolved into highly productive market gardening alongside corn and other crops, the local inhabitants had a plentiful supply of locally produced foods. That the outer suburbs provided a better diet is supported by the study of poor young recruits to the merchant navy that showed that men born in the outer suburbs of London were taller than their counterparts born in central London. 20 In this respect, the diets in these outer suburbs were a parallel to those associated with the best longevity observed in the northern regions of England, Scotland and the west of Ireland that retained a peasant-style dietary tradition. 30
All these conditions were also in the process of evolving in the face of increasing urbanisation and delocalisation of food supply. Nevertheless, improvements in living conditions, better transport links and cheaper foods, ultimately led to an improvement for many of London’s poor.