
Abstract
Objectives
There is a need for research which informs on the overall size and significance of clinical skills deficits among new medics, globally. There is also the need for a meta-review of the similarities and differences between countries in the clinical skills deficits of new medics.
Design
A systematic review of published literature produced 68 articles from Google/Google Scholar, of which nine met the inclusion criteria (quantitative clinical skills data about new medical doctors).
Participants
One thousand three hundred twenty-nine new medical doctors (e.g. foundation year-1s, interns, postgraduate year-1 doctors).
Setting
Ten countries/regions.
Main outcome measures
One hundred twenty-three data points and representation of a broad range of clinical procedures.
Results
The average rate of inexperience with a wide range of clinical procedures was 35.92% (lower confidence interval [CI] 30.84, upper CI 40.99). The preliminary meta-analysis showed that the overall deficit in experience is significantly different from 0 in all countries. Focusing on a smaller selection of clinical skills such as catheterisation, IV cannulation, nasogastric tubing and venepuncture, the average rate of inexperience was 26.75% (lower CI 18.55, upper CI 35.54) and also significant. England presented the lowest average deficit (9.15%), followed by New Zealand (18.33%), then South Africa (19.53%), Egypt, Kuwait, Gulf Cooperation Council countries and Ireland (21.07%), after which was Nigeria (37.99%), then USA (38.5%) and Iran (44.75%).
Conclusion
A meta-analysis is needed to include data not yet in the public domain from more countries. These results provide some support for the UK General Medical Council’s clear, detailed curriculum, which has been heralded by other countries as good practice.
Introduction
There is some research about deficits in new medical doctors’ experiences with different clinical tasks, 1 –3 but there is a need for research which informs on the overall size and significance of the deficit across different countries. There is also the need for research which compares the size of the deficit between countries. It is important to harmonise induction curricula in different countries because there is a high level of demand for medical professionals, globally, 4 and good opportunities for their mobility between health systems. Some countries’ professional associations, such as the UK General Medical Council, have presented clear guidelines about educational and induction curricula, whereas some countries have not yet done this. 2 As a step towards finding out whether these country differences matter, this article explores and presents a systematic review of the similarities and differences between countries in the clinical skills deficits of new medics.
Methods
Searching
The search produced 68 articles. Figure 1 is a flow diagram based on Quality of Reporting of Meta-analyses (QUOROM), showing the process of searching, screening and evaluating articles, and a summary of the reasons for exclusion. Appendix 1 shows the QUOROM checklist statements. This systematic review began with a search of Google Scholar for articles about new doctors’ clinical skills. Search words included ‘clinical skills’, ‘new medic’, ‘new doctor’, ‘newly qualified doctor’. This produced 42 articles, two of which were included.
1,2
The search was repeated on Google web to include non-indexed journals from more countries and also adding regionally used labels (e.g. ‘medical interns’) and country names. This produced 26 articles, seven of which were included.
5
–11
A flow diagram showing the process of searching, screening and evaluating articles, and a summary of the reasons for exclusion.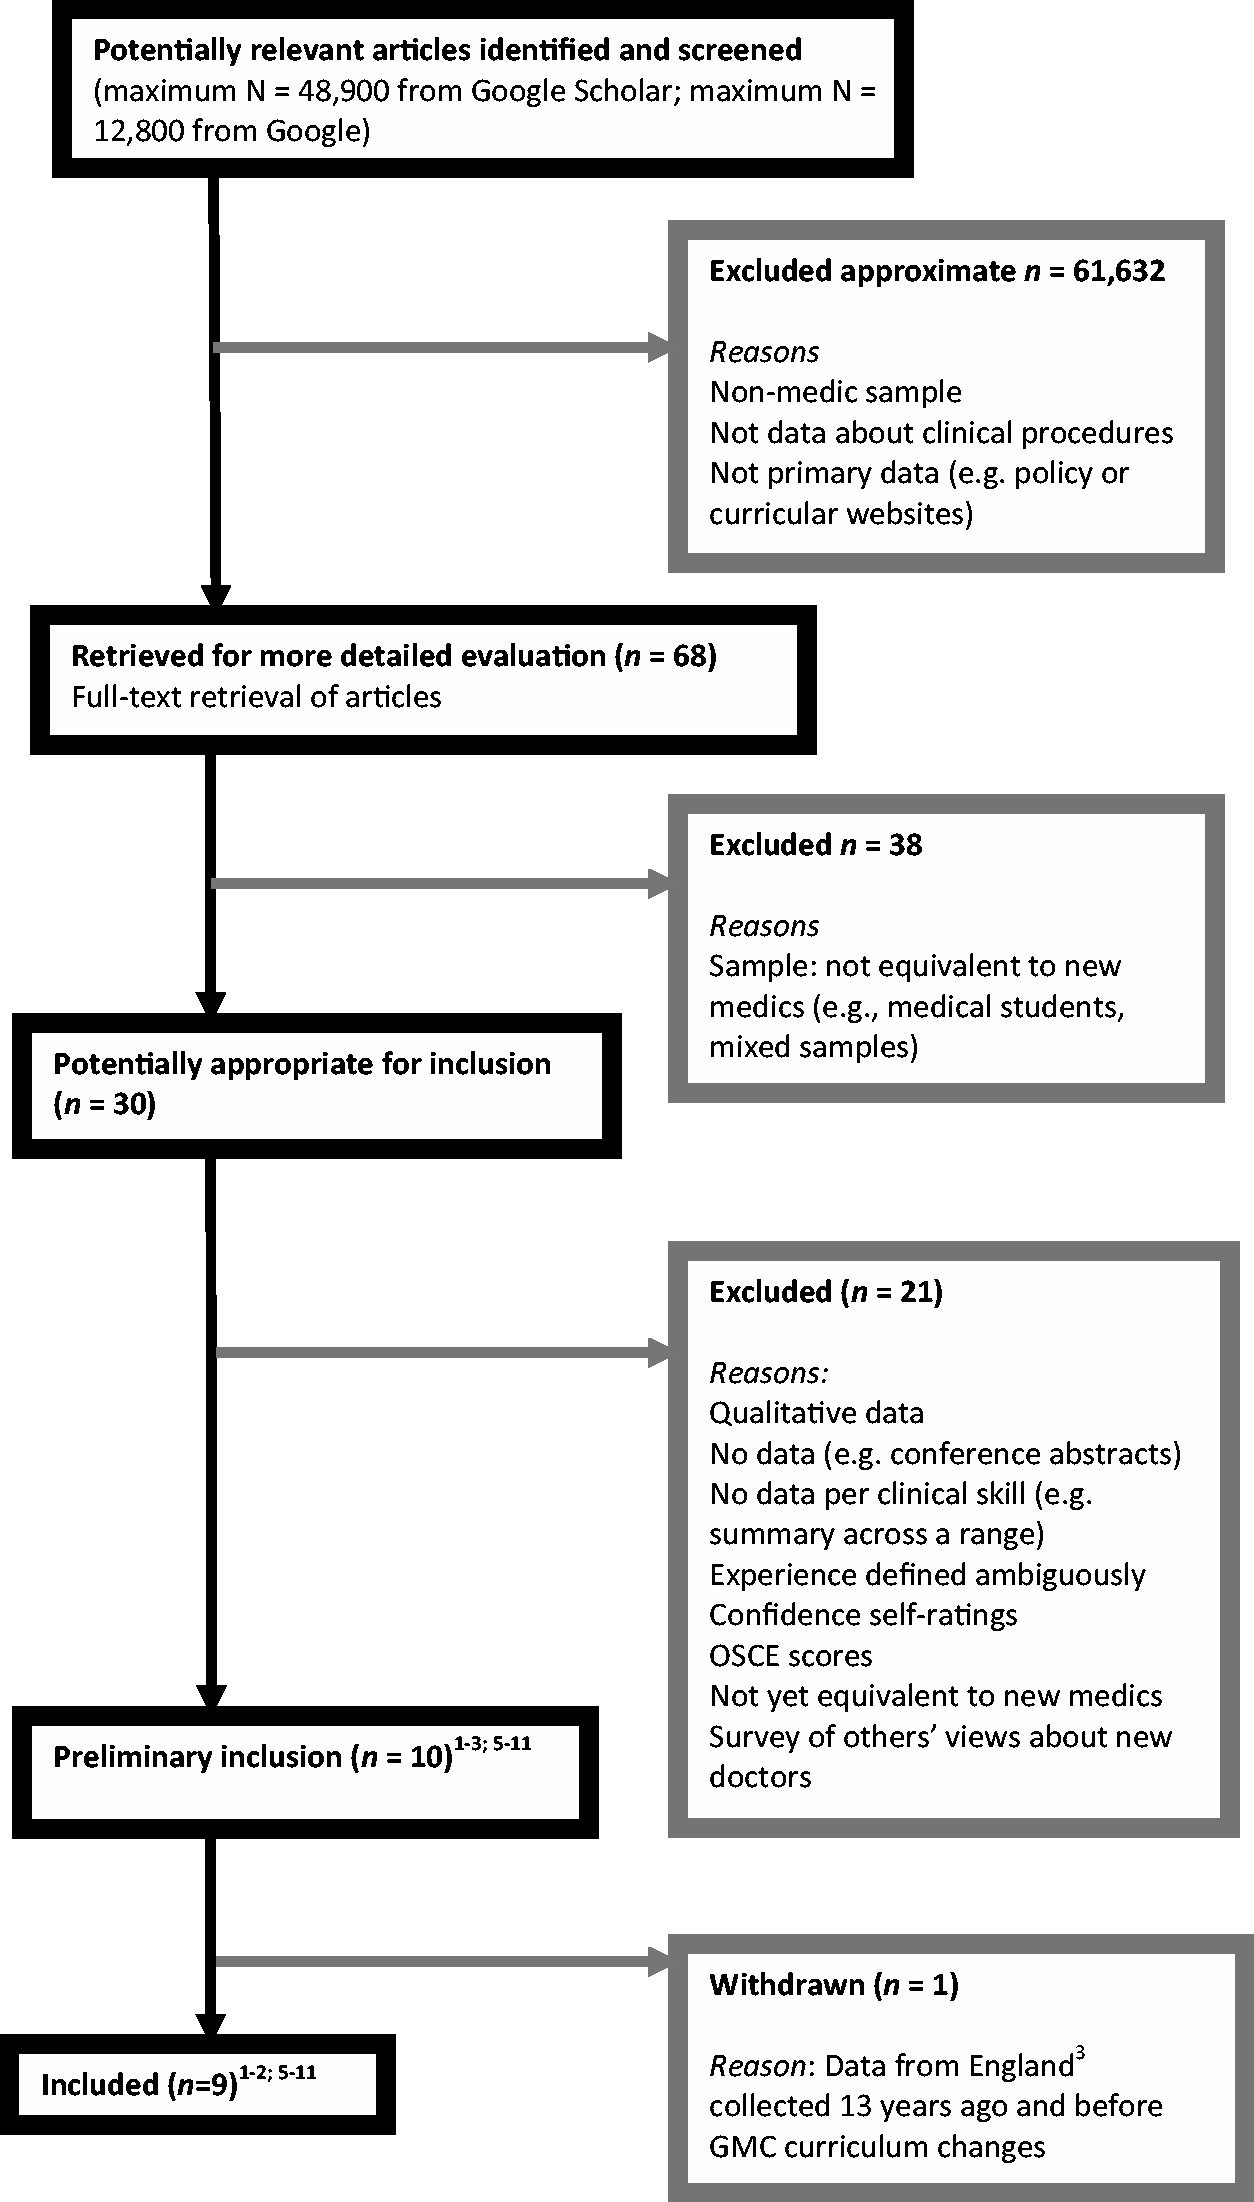
Selection
The criteria for inclusion were as follows: the data should be published and quantitative; the sample should be new medical doctors or at an equivalent level; the article should report the percentage of respondents with experience or inexperience in each clinical skill or provide scores that can be converted into percentages. There was no a priori definition of experience; articles which used comparable methods of operationalising experience were included.
Validity assessment
Proportion of new doctors without sufficient task experience, by country.†

†Interpretations of the table should take into consideration how each article defined experience (see Methods).
Data abstraction
The searches, conversions of data into percentages and calculations were conducted by the author manually and using SPSS.
Study characteristics
The first article 1 provided data from 30 postgraduate year-1 doctors (PGY1s) in New Zealand, who were asked about their clinical skills at the start of their postgraduate year and again at the end. Data from Time-1 were used for this analysis. The PGY1s were given a 134-item questionnaire and asked to rate their experience with a procedure using a 0 to 5 scale, whereby 0 = ‘never heard of the procedure or skill’; 1 = ‘know the principle’; 2 = ‘observed, or done on a model’; 3 = ‘done with supervision or assistance’; 4 = ‘have done independently’; 5 = ‘very comfortable with this skill – mastered’. 1(pp.1–2) The researchers then coded responses of 3 or higher as experience, and the percentages reported represented the respondents who had performed a given skill under supervision, independently or mastered it. The second article 2 provided data from Egypt, Kuwait, Gulf Cooperation Council countries and Ireland. There were 91 medical interns who indicated the number of times they had performed each clinical skill, and therefore the researchers reported the percentage that had never performed each skill. The third article 5 represented data from 100 medical clerks (equivalent to medical interns). The authors measured the frequency of clerks who have performed each task under observation <2 times, 2–5 times, 6–9 times and >10 times. The fourth article 6 represented data from 91 foundation year-1 doctors; they were recruited from 16 NHS trusts in the Mersey Deanery region of England. The authors asked them to rate their preparedness for each task on a scale ranging from 1 to 5, and they operationalised good preparedness as a score of ‘quite well prepared’ or better. The fifth article 7 represented data from 89 newly qualified doctors in South Africa, who were surveyed about their internship experiences with different tasks. They responded using a scale ranging from 1 to 5, whereby 4 represented the ability to perform the task independently and 5 the ability to teach it to someone. The sixth article 8 represented data from 681 PGY1s (medical interns) in USA. The authors also surveyed medical programme directors to identify the tasks that 66% of them believe are tasks that medical interns should be able to perform independently without prompting or coaching. The seventh article 9 represented data from 84 medical students in Nigeria who had just completed their last lecture. The authors reported the number of students with 0 attempts of each clinical procedure; an attempt was defined as the number of times the procedure had been successfully performed. The eighth article 10 represented data from 93 graduates in Nigeria who were about to begin their medical internships. The study focused on urethral catheterisation, and the authors reported the percentage who responded that they could do this under supervision or independently. The ninth article 11 represented data from 70 medical interns in Nigeria and focused on episiotomies, a procedure frequently expected of interns in Nigeria.
Quantitative data synthesis
From the first article, 1 each value was subtracted from 100 to obtain the percentage of respondents who had never performed a given skill under supervision, independently or mastered it (listed in Table 1). The data from the second article 2 were extracted and reported in Table 1. The data extracted into Table 1 from the third article 5 represented the percentage with the least experience (<2 times). From the fourth article, 6 the frequency of the new doctors who rated themselves as being less than ‘quite well prepared’ was converted into a percentage and listed in Table 1. The scores from the fifth article 7 were converted into percentages; the levels of inexperience in Table 1 were then calculated by subtracting these values from 100. The percentages of interns in the sixth article 8 who responded that they cannot independently perform a task which 66% of medical programme directors said is expected of medical interns were calculated for Table 1 (excluding management or judgement tasks not measured in other studies and also including clinical procedures measured by several other articles in the current review). From the seventh article, 9 the data in Table 1 are the percentage of respondents who had not successfully attempted each procedure. The data extracted from the eighth article 10 represented the percentage who responded that they could not perform the procedure under supervision or independently. The data extracted from the ninth article 11 represented the percentage of interns who had not ever performed the procedure.
Results
The significance of the rate of task inexperience across the 123 data points was calculated using a one-sample t-test with bootstrapping. This showed that the rate of task inexperience is significantly different from 0 at p ≤ .05, with t (df = 122) = 14.01, p = 0.001. The bootstrapping used a simulation of 1000 bootstrap samples and showed a bias level of .01, standard error = 2.51. The mean level of task inexperience was 35.92% and the standard deviation (SD) 28.44%. The 95% lower confidence interval (CI) of this difference was 30.84% and the 95% upper CI was 40.99%.
The average rate of inexperience was significantly different from 0 in all countries, with separate one-sample t-tests all producing p ≤ .05. The average inexperience in South Africa was 17.90% (lower CI = 12.87, upper CI = 23.40), t (df = 13) = 6.41, p = .001. In Iran, the average inexperience was 51.33% (lower CI = 36.39, upper CI = 66.11), t (df = 17) = 6.49, p = .001. In USA, the average inexperience was 41.95% (lower CI = 32.10, upper CI = 52.30), t (df = 19) = 7.84, p = .001. In Nigeria, the average inexperience was 35.34% (lower CI = 15.60, upper CI = 55.90), t (df = 9) = 3.18, p = .011. In England, the average inexperience was 9.75% (lower CI = 5.57, upper CI = 14.62), t (df = 10) = 4.13, p = .002. In New Zealand, the average inexperience was 37.89% (lower CI = 26.33, upper CI = 48.89), t (df = 27) = 6.35, p = .001. In Egypt, Kuwait, Gulf Cooperation Council countries and Ireland, the average inexperience was 40.11% (lower CI = 31.07, upper CI = 49.73), t (df = 21) = 8.21, p = .001.
A meta-analysis then calculated the combined t value, Winer’s Zc
, using the formula
12
Analysis on a smaller set of clinical skills
Some country datasets represented a much wider variety of clinical tasks than the datasets from other countries. The analysis of the average level of inexperience in each region was therefore replicated, but this time restricting the analysis to clinical tasks that commonly occur across the different articles. This restricted list of tasks had 37 data points and included catheterisation, IV cannulation, IV administration, venepuncture and nasogastric tubing. The average deficit in experience across all countries, focusing on this smaller selection of clinical skills, was 26.75% (lower CI 18.55, upper CI 35.54). The small number of data points from each geographic region (e.g. 3 data points) meant that inferential statistics were not appropriate for country-by-country comparisons.
Looking at the mean deficits in five countries, the average level of inexperience with the smaller selection of clinical skills was still comparable to the average level of inexperience with the wider range (in Table 1) in five countries. These were England, Iran, Nigeria, USA and South Africa. In South Africa, the mean level of inexperience with the selected clinical tasks was 19.53% (SD = 15.60; lower CI = −19.23, upper CI = 58.29). In Iran, the mean level of inexperience with the selected clinical tasks was 44.75% (SD = 37.48; lower CI = −14.89, upper CI = 104.39). In the USA, the mean level of inexperience with the selected clinical tasks was 38.5% (SD = 16.66; lower CI = 11.98, upper CI = 65.02). In Nigeria, the mean level of inexperience with the selected clinical tasks was 37.99% (SD = 37.78; lower CI = 6.40, upper CI = 69.58). In England, the mean level of inexperience with the selected clinical tasks was 9.15% (SD = 7.73; lower CI = 1.04, upper CI = 17.26). In New Zealand, the mean level of inexperience with the selected clinical tasks was 18.83% (SD = 24.64; lower CI = −7.03, upper CI = 44.70) and substantially lower than the average level of inexperience with the whole range of 28 skills in Table 1 (37.89%). The same was true in Egypt, Kuwait, Gulf Cooperation Council countries and Ireland, where the mean level of inexperience with the selected clinical tasks was 21.07% (SD = 24.85; lower CI = −5.02, upper CI = 47.15) and substantially lower than the average from Table 1 (40.11%).
The average skills deficits, from largest to smallest, were as follows: Iran, then USA, Nigeria, the combination of Egypt, Kuwait, Gulf Cooperation Council countries and Ireland, followed by South Africa, then New Zealand, then England.
Discussion
Statement of principal findings
The average rate of inexperience with clinical tasks spanning 123 data points was 35.92% across England, Egypt, Gulf Cooperation Council countries, Iran, Ireland, Kuwait, New Zealand, Nigeria, South Africa and USA. Calculations showed that the overall rate of clinical task inexperience is significantly different from 0 and therefore, as a global average, important. However, there are country differences. Within a selected range of procedures, the average skills deficits, from largest to smallest, were as follows: Iran, followed by USA, then Nigeria, followed by the combination of Egypt, Kuwait, Gulf Cooperation Council countries and Ireland, then South Africa, followed by New Zealand, then England. Foundation year-1 doctors in England therefore presented the smallest average skills deficit.
Strengths and weaknesses of the study
This systematic review offers a useful focus on new medics, presents a broad range of clinical skills and involves data spanning over 10 countries. This review is preliminary because of a lack of access to unpublished data from more countries. Second, the acceptable level of experience for new medics can vary from one clinical skill to another 8 and therefore a follow-up meta-analysis should take this into account.
Strengths and weaknesses in relation to other studies
There is no known systematic review of this kind but, compared to the methodology in non-review studies, this study could have benefited from a standardised measure of clinical task experience. Interpretations of Table 1 must therefore take into account the way in which each article measured task experience.
Meaning of the study: possible mechanisms and implications for clinicians or policymakers
A universal approach to medical education is needed, given the global demand for medical professionals. The lower deficit rate in England provides some support for the UK General Medical Council’s clear, detailed induction curriculum, which has been heralded by other countries as good practice. 2 This research shows that the UK General Medical Council’s curriculum should be implemented in more countries. Clinically, the data are useful in identifying the potential skills deficits among newly qualified recruits from other countries and the inductions that should be provided.
Unanswered questions and future research
Further research is needed to include unpublished data from more countries. Follow-up primary research should measure task inexperience in a universal format, also clarifying the conditions under which the experience was gained (patients vs. simulations). Some studies defined ‘task experience’ differently than others, and therefore (to allow a full meta-analysis) future research should ensure that clinical task experience is measured in a standard format.
Footnotes
Declarations
QUOROM checklist.
Heading
Subheading/Descriptor
Reported (Y/N)
Page number
Title
Identified as a systematic review
Y
Title page (p.1)
Abstract
Structured format
Y
Abstract page (p.1)
Objective
Y
Abstract page (p.1)
Data sources
Y
Abstract page (p.1)
Review methods
Y
Abstract page (p.1)
Results
Y
Abstract page (p.1)
Conclusion
Y
Abstract page (p.1)
Introduction
Y
Introduction page (p.1)
Methods
Searching
Y
Methods page (p.1)
Study selection
Y
Methods page (pp.1–2)
Validity assessment
Y
Methods page (p.3)
Data abstraction
Y
Methods page (p.3)
Study characteristics
Y
Methods page (p.3)
Quantitative data synthesis
Y
Methods page (p.3)
Results
Trial flow
Y
Figure 1 (p.2)
Study characteristics
Y
Table 1 columns (pp.4–8)
Quantitative data synthesis
Y
Table 1 columns (pp.4–8) and analysis pages (pp.8–9)
Discussion
Y
Pages 9–10
