
Abstract
The increasing energy demand of data center infrastructures is at the heart of debates about the environmental sustainability of the internet. Expanding these debates, this paper analyses how the electricity needed to power data centers interact with power grid decarbonisation and thus climate change. We trace this interaction by using a relational approach and by unflattening a dominant metric used in the data industries to define sustainability: the carbon intensity of electricity. Drawing on fieldwork in two locations: an underwater data center in Orkney islands, Scotland; and a wind farm used to offset data center power in Ragunda, Sweden, we identify five issues for power grid infrastructures as data center industries decarbonise their operations: land and community conflict, electricity grid capacity limits, grid curtailment, grid reinforcement challenges, as well as grid grabbing. We demonstrate how the sustainability of data centers and the internet requires thicker “unflat” accounts of an inseparable data and energy infrastructure, in order to envision more sustainable relations between these two sectors. In a final generative move, we unflatten carbon intensity from its usual form on a map into a fuller electricity atlas and offer five speculative fabulations for how such an atlas could lead to more liveable futures.
Keywords
The once-white pressure cylinder sits on the dockside beside an old herring derrick. Its barnacle-encrusted curve, almost 15m long, rises over the gray harbor waters. The steel container, filled with more than 800 servers surrounded by nitrogen gas, has spent 2 years underwater. A maritime worker on a crane lift is spray cleaning the sides, revealing a familiar logo: the four colored squares of Microsoft. This is Project Natick, the testing of an underwater data center in the islands of Orkney, off the northeast coast of Scotland. These remote islands have become “one of the most exciting places in tech” (Rose, 2018). However, it is a long way from Redmond, Microsoft's headquarters, so why go so far? What does Orkney have that the coast of Washington State does not? One answer is “100% locally produced renewable energy from onshore wind and solar, offshore tide and wave”; that is, Orkney electricity is almost net zero carbon (Cutler et al., 2018). Project Natick was an experimental data center, installed beneath the waves from 2018 to 2020, to explore a sustainable future for Microsoft's data center business. The underwater data center was also plugged into the electricity grid, altering its renewable energy capacity. This moment was one transformative encounter between the data center industry and the energy industry, where a shared green future was created. How does this technocultural encounter between two different industries happen in practice, and what are its consequences? At this point, we note the importance of green electricity in this encounter and start there as our case study.
Introduction
In our climate-changing world, there is growing pressure on data industry multinationals, such as Microsoft, Google, and Amazon, to decarbonize their infrastructure (Cook et al., 2017). The massive electricity consumption by data processing and storage has become a regular headline in the media (e.g. Ambrose, 2024). Critical internet scholarship has linked the energy use of computing infrastructure to environmental damage and increased carbon dioxide emissions. It has called for new methods and approaches to the environmental sustainability of digital industries (Brevini, 2020; Brodie, 2023; Carruth, 2014; Hogan, 2018; Kuntsman and Rattle, 2019; Marks et al., 2024; Mollen et al., in press; Pasek et al., 2023a; Sutherland and Bopp, 2023; Vonderau, 2019).
Cloud service providers have sought to address environmental criticism by declaring goals to become carbon free and even carbon negative. The industry now publishes its carbon emissions in corporate annual reports using a range of metrics and assessments as evidence of doing sustainability. Google has led the development of the 24/7 Carbon-Free Energy Compact, a United Nations–backed commitment to buying carbon-free electricity matched to corporate consumption with hourly precision (GoCarbonFree247, 2024). Amazon Web Services (AWS) has a renewable energy offset commitment (AWS, 2024). Data center businesses vie for customers on the basis of how green their data centers are using a measure of carbon emissions from their data center electricity consumption as an indicator (e.g. EcoDataCenter, 2024). Customers of data center services use live dashboards, such as Microsoft's Azure Emissions Impact Dashboard (Microsoft, 2024), to track their changing carbon emissions from cloud hardware and software. These metrics have become necessary to meet regulatory requirements, such as the European Union's recent Corporate Sustainability Reporting Directive. Microsoft's choice of 100% renewable energy-powered Orkney for testing a new data center can be considered part of this overall trend. 1
Carbon emissions are generated in the energy industry and then actioned in the data industry. This is not just a theoretical connection. The two industries are physically connected through cables as inseparable infrastructures—nothing happens in a data center without the lights being on.
In this article, we examine the relationship between these conjoined infrastructures, in particular, through the places and practices that make the carbon metrics they share. We begin by understanding how the carbon intensity of electricity is made as a “flat fact” and then we “unflatten” this fact through our experiences in two empirical field sites. This enables us to reframe the way data industries approach electricity and, ultimately, to explore more livable green futures for both data and electricity networks.
Scholars of media studies and critical internet infrastructure research have begun to point to energy as the pivotal domain that shapes the politics of locating data center infrastructures (Bresnihan and Brodie, 2020; Johnson, 2023; Pasek et al., 2023b; Velkova, 2021). Discussing the relationship between data industries and energy politics has allowed scholars to point at the planetary environmental impacts of data (Brodie, 2023), explore new economic and infrastructural arrangements built around the energy emitted by data centers, such as heat (Velkova, 2016), and locate data industries as actors who contribute to environmental conflicts (Hogan, 2018; Valdivia, 2024). In most of this work, the energy industry and electricity infrastructure appear as black boxes.
In the meantime, in social studies and anthropologies of energy, we have seen the reverse black boxing: digital industries are, with a few exceptions (Maguire and Winthereik, 2021; Ortar et al., 2023; Salling, 2024; Salling and Winthereik, 2025), assumed to be necessary to construct sustainable energy futures. Research is framed in terms of electricity grids, energy markets, and energy communities, without considering the data network implications (Boyer, 2019; Goulden et al., 2014; Howe, 2019; Lunde et al., 2016; Powells and Fell, 2019; Silvast et al., 2020; Strauss et al., 2013).
Our analysis brings these perspectives together to contribute to the ongoing debate on the environmental sustainability of data infrastructure and to emergent work on digital energetics (Pasek et al., 2023b).
Unflattening methods
We examined two empirical field sites in Northern Europe where energy and data intersect: the islands of Orkney, Scotland, where Microsoft's underwater data center was tested (researched by Watts), and the forest landscape of Ragunda, Sweden, where a wind farm was constructed to offset data center carbon for Google (researched by Velkova). As part of these two field sites, we gathered planning and strategy documents concerning electricity grid and wind power developments in Sweden and the United Kingdom. Separately, we also followed both field sites through the carbon metric used to make the sustainability of their electricity comparable and interviewed one company where that metric is made in practice, Electricity Maps, which is located in Denmark.
We used empirical evidence from our specific field sites to propose more general points about the encounter between energy and data industries as it happens through the carbon intensity of electricity.
Watts has spent over 15 years collaborating with the renewable energy communities in Orkney as an ethnographer and consultant (Watts, 2019) and was living within view of the underwater data center when it was being deployed and recovered from the European Marine Energy Centre (EMEC) test site. She discussed the project with energy industry experts on the islands during that time. 2
Velkova has tracked how wind power becomes productive for Google in Sweden, with a focus on wind farm development in the municipality of Ragunda. She visited the municipality on three occasions in 2023 and 2024; conducted interviews with politicians and residents engaged in protests against wind power in the area; and analyzed court case documents concerning lawsuits made by the Sámi people.
We bring together these two distinct field sites and trace how the physical and social complexities of low-carbon electricity infrastructure are flattened into a number, the amount of carbon in the electricity used by the data center industry at these sites. We explore the relations that become irrecoverable from this metric as a result.
We are mindful of our location in the Global North and the limits of our claims as a result. Nevertheless, even within our privileged world where electricity grids and internet access are assumed to be “always on,” a close engagement with energy and data infrastructures shows how they are entangled in the politics of disempowerment and disruption. We are also mindful that our fieldwork sites do not reflect all kinds of data center developments and industry actors. Our discussion is based on cases related to two well-known multinational companies, and we acknowledge that the industry includes many more diverse actors. However, we consider our cases as exemplars of an emergent issue: how the two industries of energy and data centers are impacting each other and the world, as they intersect in carbon metrics.
A multitude of metrics can be found in the encounter between data center and energy industries, ranging from the water temperature in data center heat pumps to the megawatts of IT Power used by data center equipment. But the dominant metric used by the data center industry for comparison of green electricity in different places is grid carbon intensity. The question “How green is my electricity here?” is answered in units of grams of carbon dioxide equivalents per kilowatt-hour. This is the unit Microsoft gives on its Azure cloud emissions dashboard. It is the unit for electricity carbon emissions that gets added to all the other carbon emissions in a sustainability report.
Carbon intensity also guides ongoing research around a low-carbon internet. For example, computer science researchers are exploring green data networking and carbon-responsive computing, where computation is load shifted from sites and times of high-carbon electricity to places and moments of low-carbon electricity, shifting compute loads in direct response to grid carbon intensity metrics (Nafus et al., 2021; Zilberman et al., 2023).
However, carbon intensity is not a straightforward measurement. Carbon metrics stand on contradictory and uncertain epistemological foundations, as has been discussed in critiques of carbon accounting practices (e.g. Archer, 2024; Lippert, 2015; MacKenzie, 2009). Scholars of digital media infrastructure have given careful attention to carbon accounting in data industries and have called for a different politics in their environmental approach. Pasek et al. (2023a) call for an approach that accounts for the relationships between the many social, technical, and spatial elements tied to the operation of digital networks and services in ways that could enable novel sustainable infrastructure.
In this article, we build on that relational approach. Rather than rehearsing critiques of carbon assessment, we take grid carbon intensity as a “flat fact” (Latour, 2007) that we can unflatten to examine one encounter between the electricity and data center industries.
Our approach to unflattening derives in two ways. First, it is inspired by the classic Flatlands allegorical tale of a two-dimensional world (Abbott, 1992, first published 1884), where the inhabitants are unable to comprehend three-dimensional shapes, which appear to inexplicably grow and shrink as they move through the world's surface.
Our flatland is the world of the carbon metric we found in both our field sites: carbon intensity of electricity. Three-dimensional everyday practices across the data and energy industries were flattened into a metric on a two-dimensional map, with inexplicable consequences. Eiffel Tower-sized wind turbines in Northern Sweden are funded by Google to produce low-carbon intensity electricity but without connection to any Google data center; the carbon intensity of the Orkney electricity grid is not singular but depends on who you get your number from. Unflattening grid carbon intensity makes these, and much else, explicable.
Unflattening is also derived from critical scholarship, where it is understood as a relational simplification. Rich, entangled sociomaterial relations are reduced to a simple line or point. Scholars make visible unflat relations and the practices that constitute them (Latour, 2007; Law, 2004). Sousanis’ (2015) visualizes this approach using “split vision” from feminist technoscience, where seeing the world through two eyes is embodied and situated (Haraway, 1988). By keeping both eyes open, critical scholars can locate bodies and digital bits, practices, and energetic places, which are lost when their constitutive relations are flattened together.
Reflecting on what we see is not enough, however. In addition to this critical unflattening of carbon intensity, we want to use our analysis to be generative (Haraway, 2016; Latour, 2004). Therefore, we conclude with a more livable, speculative future generated from the relations we see in this encounter between data and energy industries.
Flattening green electricity through carbon intensity
We return to the pressurized white cylinder of Microsoft's underwater data center, sitting on the dockside in Orkney, one of our field sites. Microsoft chose this location for its renewable energy, which it communicates to customers as a carbon intensity metric on its Emissions Impact Dashboards.
The carbon intensity of the electricity grid at any particular location in the world is a highly specialized metric delivered to companies, such as Microsoft, from third-party vendors. One vendor that makes this metric is Electricity Maps. On 7 August 2024, Electricity Maps gave 14 g for the carbon intensity of the Orkney electricity grid zone, derived from 100% renewable energy sources (see Figure 1). In comparison, the carbon intensity of the mainland UK grid was 201 g from 29% renewable energy sources (see Figure 2). Grams (g) is a frequent shorthand for the actual unit, gCO2eq/kWh, because the unit is considered a standardized metric for collating green-house gas emissions. It is often taken as a “flat fact” that 200 g means that the equivalent of 200 g of carbon dioxide has been emitted into the atmosphere as a result of the electricity generated, even though the making of this metric is complex and contentious, as we will discuss. On the basis of this example asking Electricity Maps the question “How green is my grid here?” might make Orkney a tempting location for a green-powered data center, compared to the rest of the United Kingdom.

Screenshot of the Electricity Maps app showing the Orkney grid carbon intensity on 7 August 2024, 7.00 CEST. For details of their method see https://www.electricitymaps.com/content/deep-dives.
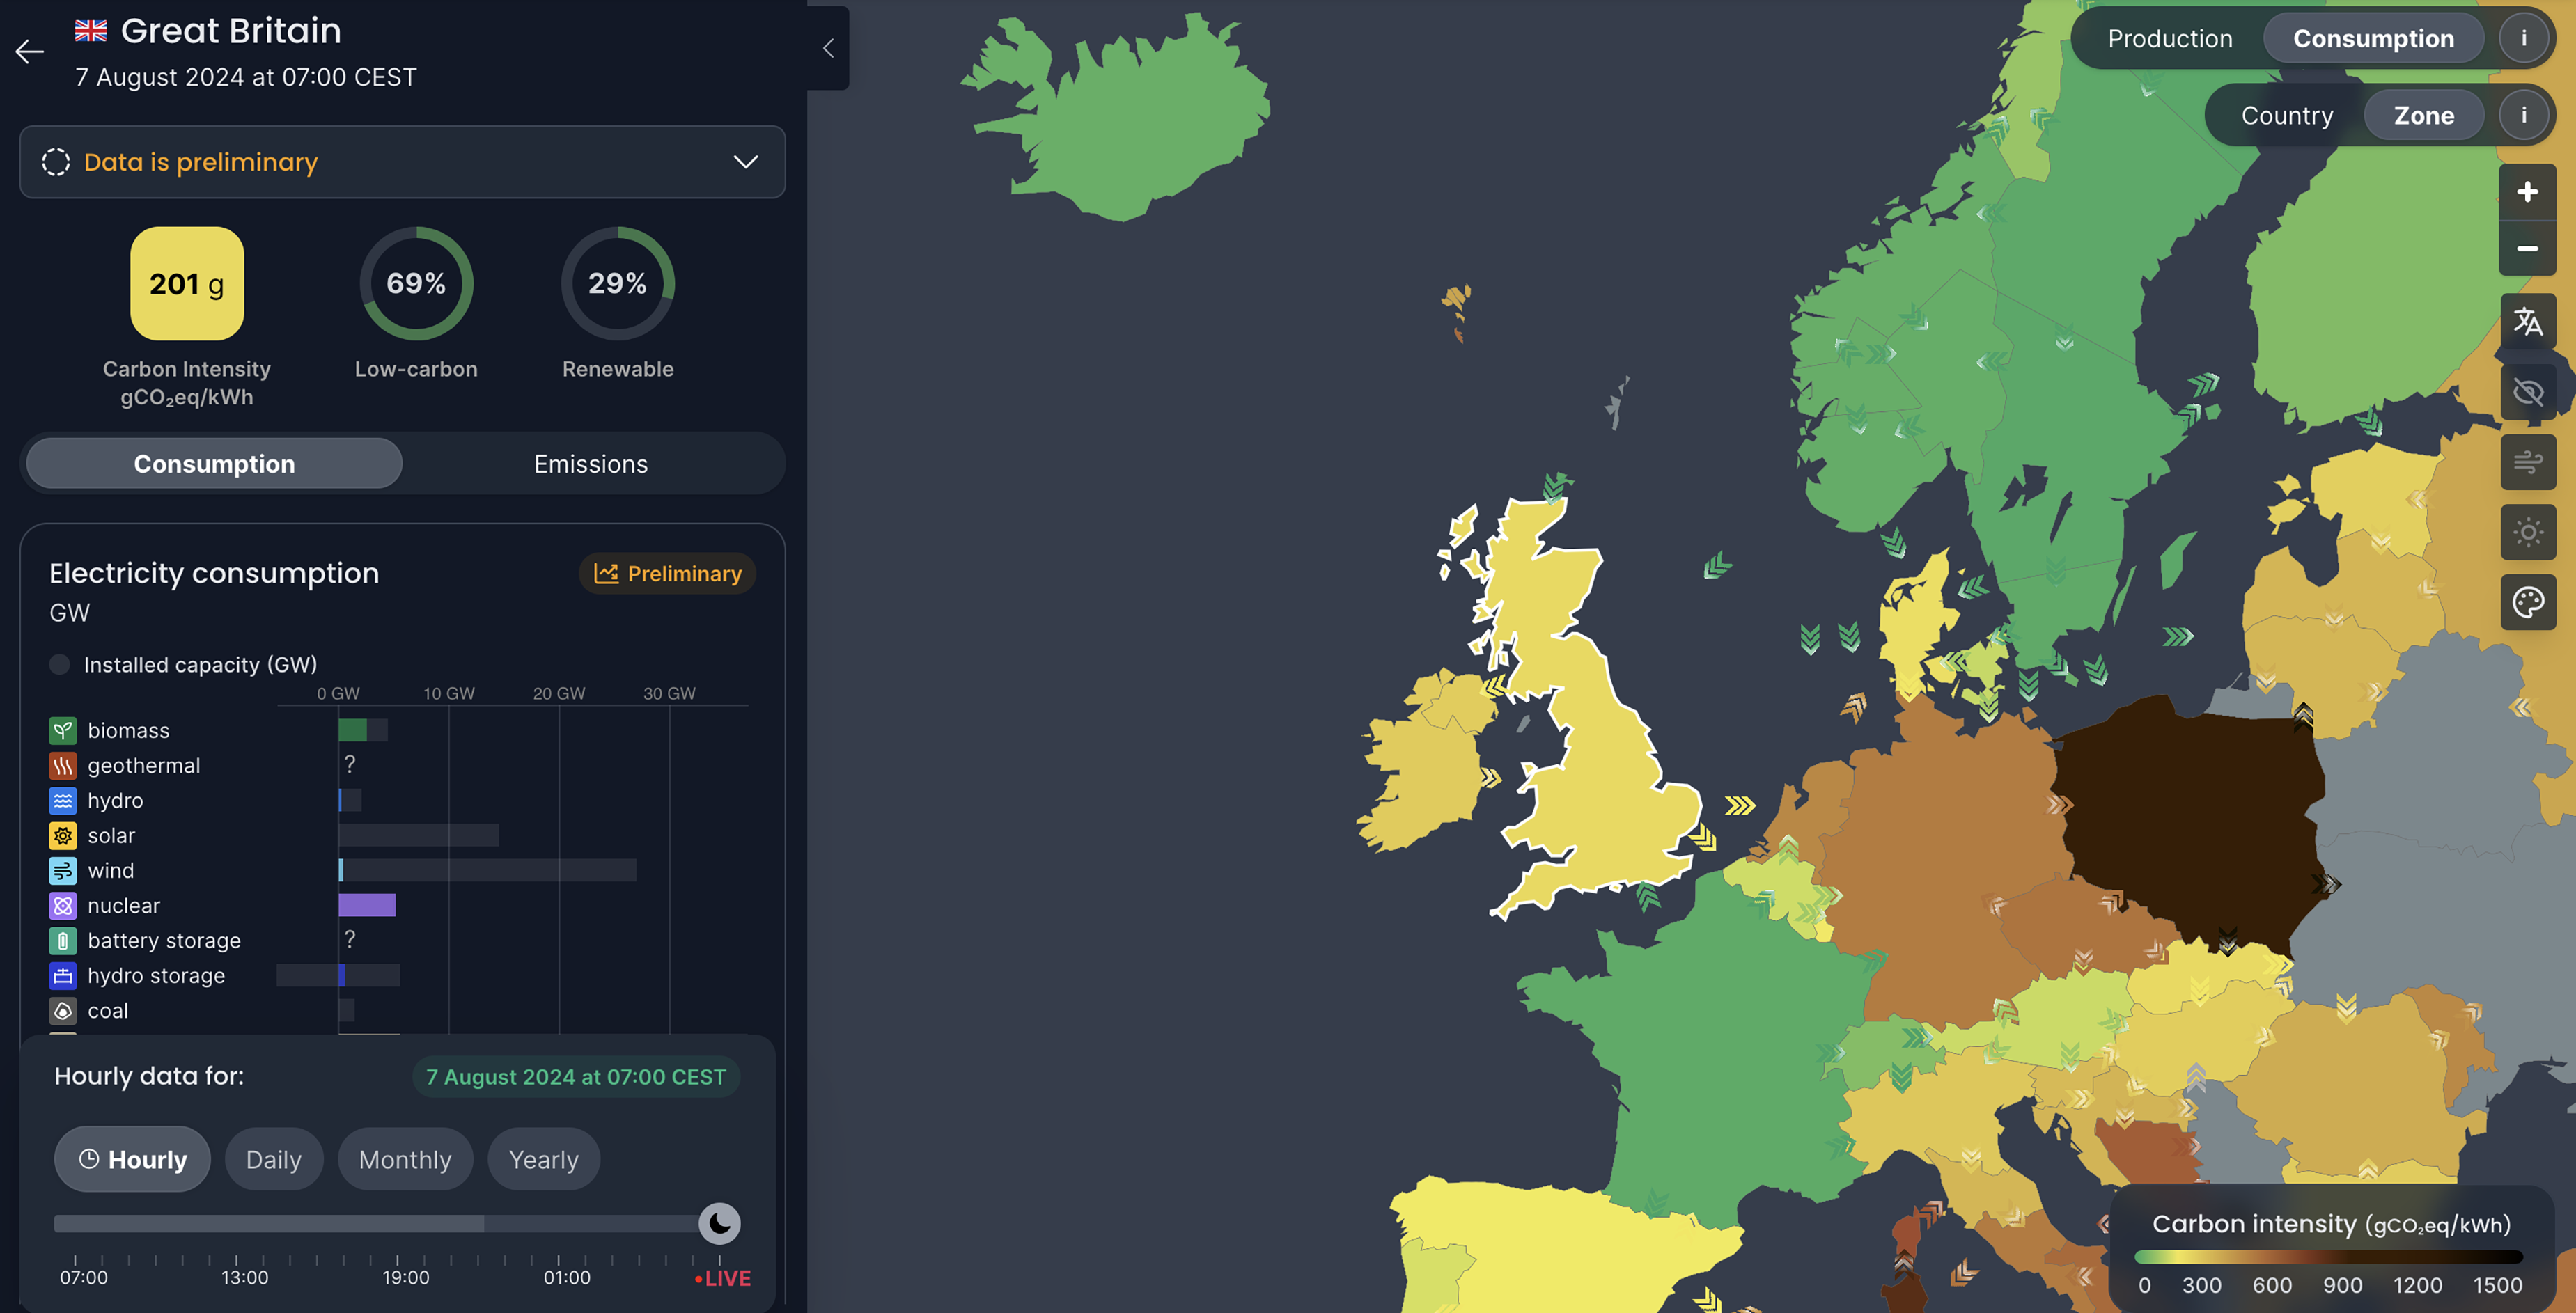
Screenshot of the Electricity Maps app showing the mainland UK “Great Britain” grid carbon intensity on 7 August 2024, 7.00 CEST. For details of their method see https://www.electricitymaps.com/content/deep-dives.
However, companies calculate grid carbon intensity in different ways. WattTime, a nonprofit competitor, has no data for the Orkney grid zone and performs its calculations on the UK grid as a whole. In WattTime's calculation, Orkney's renewable energy is aggregated with all of mainland UK's power stations. Asking WattTime “How green is my grid here?” would elicit the same answer, regardless of whether your data center is in London or Orkney. 3 The difference in these flat facts has material consequences: Do you build your low-carbon data center here or there? Do you follow Microsoft's choice of Orkney or build elsewhere? We will explore these consequences in detail.
Let us start by understanding how the carbon intensity of electricity is flattened into a number because it is not simply that one company is right and the other wrong. First, the unit gCO2eq/kWh appears to relate to mass, that is, grams of carbon dioxide, but it is actually “grams equivalent” or gCO2eq. These are derived from the electricity generators on the grid: the greenhouse gas emissions from a fossil fuel power station or carbon from when a wind turbine is installed. However, electricity does not transmit this measure of “greenness” down a grid cable because electricity cables do not carry data but only volts. To ask for carbon intensity at a grid location, for example, where a data center is plugged in, is to miss how nonlocalized electrical power is as a phenomenon (Anusas and Ingold, 2015). Electricity grids are interconnected, at least in Europe; power from one wind turbine on the grid is transmitted around its grid and through interconnector cables to other national grids in other countries. In essence, the electricity from one wind turbine is everywhere the turbine has a connection to. So what does the carbon intensity of electricity even mean? How is it calculated?
We are going to focus on the carbon intensity of the Orkney electricity grid as an example and will combine this with knowledge gained from our interview with Electricity Maps. This rather detailed explanation is crucial to understanding how flattening is done in practice.
An object, such as a carbon intensity metric, is created by cutting it out so it is distinct. A boundary is needed to know what is inside and outside the object. The Orkney grid is connected to mainland Scotland by a single interconnector cable. 4 The cable acts like a bottleneck. This creates a boundary between the Orkney grid and the Scottish grid. It also enables the grid operator to measure the electricity going in or out of Orkney through a power sensor on the interconnector cable. The power measured by the sensor produces a number that flattens together everything inside the Orkney grid—all the power cables, pylons, substations, generators, kettles, computers, and (for a time) an underwater data center. There is no way to distinguish where the electricity comes from because electricity cannot be traced. How can we get from untraceable electrical power to carbon?
Inside Orkney, there are only renewable energy generators, the vast majority being wind turbines. Most of the time, Orkney exports electricity since it generates more wind power than it can use. This means that when the cable is exporting electricity to mainland Scotland, all the power is “green.” If Microsoft's underwater data center was plugged in, it would be 100% powered by Orkney “green” energy. However, Electricity Maps gave the Orkney grid carbon intensity as 14 g from this 100% renewable energy. Given that wind turbines do not emit carbon, the 14 g relates to carbon from the infrastructure materials and lifecycle emissions. Electricity Maps uses the IPCC's standardized lookup table for direct and indirect emissions of carbon intensity for different categories of electricity generators (Schlömer et al., 2014), which is the source of the 14 g of carbon.
There are three essential points to note from this flattening calculation. First, the carbon intensity of electricity is not a direct measurement. It is a method. It is made from measuring power at a specific place in the grid network, and performing a calculation using lookup tables, among much else. Electricity Maps performs its calculation following one method, but other vendors of grid carbon intensity use other methods and power measurements from different cables, and therefore have different grid zones. WattTime's calculations are just as valid as those of Electricity Maps, but their method produces different numbers.
Second, the Orkney grid carbon intensity can be calculated because the operator publishes the power measurement from the interconnector cable as a data set. However, grid data is not a given. According to Electricity Maps, when they sought data for a grid within one European country, “[They] blocked us. They don’t want anyone to look at what's going on within the bidding zone. It's too touchy of a subject.” Some grid operators in that country had legacy fossil fuel power stations and others new wind farms, creating different energy markets, costs, and benefits. 5 The operators were all too aware that the question “How green is my grid?” is a political question as much as a calculated one. In such cases, the carbon intensity vendor must construct sophisticated grid models that can approximate live power flows using whatever data is available. As always, numbers are not neutral but come with substantial politics (Porter, 1996).
Third, calculating carbon intensity produces a single number no matter how big the flattened grid is, and grid zones are often much bigger than Orkney. National and regional grids are managed by distinct operating companies whose boundaries mirror their network topology, such as the California Independent System Operator or Svenska Kraftnät in Sweden. Interconnector cables between these national and regional grids create measurable power bottlenecks from which carbon intensity can be calculated. Even though the carbon intensity of electricity is visualized on a map and the question is framed by data industries as “How green is my grid here?” there is no distinction possible between places in the same grid zone on these maps. Grid carbon intensity has no geography. Grid carbon intensity has only network topology. It is the cable connections that matter, not the cartography.
The carbon intensity of electricity appears to be framed as a spatial question: Where is the grid greenest? However, the answer is a number that has flattened away the physical infrastructure and its geography. In the next section we examine the consequences of this grid flattening for the future of both the energy and data industries.
Unflattening power grids
Renewable energy may “renew” with the blowing of the wind, but the sociotechnical infrastructures that transform it into electricity mean that power cannot be produced whenever and wherever Google or Microsoft needs it. The land for wind or solar power plants and their substations must be planned and leased; the cables that connect them must be hung on pylons or buried in the ground; the market price for the electricity must be paid; engineers have to keep the grid balanced so the lights stay on. The decision making of data industries based on carbon intensity have an impact on all these relationships.
When electricity grids are flattened into numbers and maps, the relations that constitute them, particularly their ongoing transformation in the green energy transition, become invisible to the data industries. Five issues become clear when we unflatten grid carbon intensity.
Unflattening carbon offsetting and power purchase agreements
Carbon intensity as a metric allows the data industry to practice carbon offsetting. One way to do it is through power purchase agreements (PPAs). Data center operators purchase green energy credits from power plants with low carbon intensity, such as wind or solar, at a price fixed in advance (Christophers, 2022). This practice allows data industries to offset continuing fossil fuel use with purchased renewable energy: the more credits a company buys, the lower its overall reported carbon emissions are, regardless of the location of its data centers and the fuel mixture of the grids that power them.
Carbon offsetting is a widespread practice that has been debated at length; critics argue that it does not address carbon dioxide emissions per se but only a carbon balance sheet (see European Parliament, 2024). Nevertheless, there is high demand from data industries to identify suitable sites from which they can purchase low-carbon electricity. Between 2016 and 2020, data industry multinationals contracted 40% of all renewable energy developments through PPAs (Hook and Lee, 2021, cited in Christophers, 2022). AWS claims to be the largest corporate buyer of renewable energy in the world (AWS, n.d.).
On the basis of fieldwork in Ragunda, Sweden, Velkova discovered that PPAs contracted for carbon offsetting are not made with existing wind power plants—at least not in Sweden—but with prospective ones. These get built because a PPA has been signed. A PPA de-risks the financial investment needed to build a large-scale wind power plant by guaranteeing future electricity prices (Christophers, 2022). The moment a company signs a PPA is also when carbon intensity ignites land and community politics; it is when energy histories in a region are made and remade.
In 2019, Google signed a PPA with a wind power plant in northern Sweden, at Björkvattnet, in the municipality of Ragunda. Its zero carbon emissions were to offset the carbon intensity of Google's data center in Hamina, Finland (Alley, 2019). Vast areas of the Swedish forest and cloudberry marshes were cleared to place 33 Eiffel Tower-sized Cypress General Electric wind turbines. The turbines remade the landscape in the Björkvattnet area and demanded that people from nearby villages, reindeer herds, birds, and plant life develop a new relationship to this altered landscape. This has not been an easy relationship to come to terms with.
The wind power plant stands on the winter pasture lands of three Sámi villages: Jijnjevaerie, Ohredahke, and Raedtievaerie and encroaches Sámi reindeer migration routes. 6 It has reduced their use of pasture land in the area. Jijnjevaerie Sámi village members went to court and sued the wind developer companies that engaged in permit and land preparation planning issues prior to Google's arrival. 7 They lost on the grounds that renewable energy has high societal value and is in demand. They were told that the Sámi should adapt, a common argument in the long history of Swedish colonialism (Lawrence, 2014).
After the wind farms were built, local politicians regretted their decision to “green light” the construction. The wind power plants, including those that offset carbon for Google, “did not end up being such a good thing in the end as we thought” for the Sámi, shared one local politician in an interview with Velkova. “Right now, we act with great consideration toward the Sámi,” they said, and explained that the municipality then vetoed new construction until questions of compensation were resolved.
As of 2023, the Jijnjevaerie Sámi village has more than 400 giant wind turbines on its pasture lands (Össbo, 2023). At least 33 of these generate green credits that offset carbon emissions of data industry giants, such as Google. They also turn landscapes and communities into a new resource frontier and a site of struggle for life and land that draws on the legacy of multiple forms of colonialism (Bresnihan and Brodie, 2020). In the Arctic and Northern Sweden, this is called green colonialism (Kårtveit, 2022).
Non-Sámi residents in Sweden were also upset by the Björkvattnet wind plant development. In an interview with Velkova, the then head of the municipal council explained how he demanded compensation from the state for the contribution the community makes to renewable energy generation by allowing the transformation of its landscape and social fabric: “We want to put things in order here concerning the compensation we get as a municipality for allowing this construction… We are positive to new energy developments, but how much should a municipality bear in terms of green energy? We are producing 10% from Sweden's hydropower electricity, which is also green. We are delivering a lot of green electricity, but the wind power has also claimed very large surfaces in the forest, and disturbed the landscape and nature.”
The compensation that the politician was hoping to get was to go toward public infrastructure in what is today one of the poorest municipalities in Sweden, and one of the largest renewable energy producing areas in the country.
Although a PPA can make the data industry futures seem sustainable, it can simultaneously ignite local conflicts around land governance and economic distribution that result in land dispossession and economic loss for a community. Electricity carbon intensity, which is essential to PPAs, erases these relations. The metric flattens a three-dimensional wind power plant and all the place-based relations that make it operational into a cost and contract that is exchangeable on the international carbon market. The struggle for livable futures for people, animals, and plants in these emergent low-carbon energy landscapes is irrecoverable by data industries from these metrics. Carbon intensity metrics contain the conflicts but flatten them into numeric nonexistence.
Unflattening grid curtailment
Carbon offsetting and PPA issues are not the only challenges that derive from the flattening of social, technical and environmental relations into grid carbon intensity. The grid itself is also facing challenges. When Microsoft's underwater data center was tested in Orkney, it increased electricity demand there. But what happens when the grid has to carry extra electricity? And who benefits from selling this electricity?
Many wind turbines in Orkney are owned by island charities that work to benefit their island community (Watts, 2019). The islander turbines generate revenue by selling their power to the electricity grid. However, the Orkney grid is limited in the amount of electricity it can export down the interconnector cable due to material constraints: Too much electricity conducted would melt the cable. This means that local turbines do not have a guaranteed grid connection. When the wind is blowing but there is low demand, such as when it is warm and no one wants the heating on, the grid switches off some wind turbines to keep the grid balanced and to stop the cables from overloading—a practice called curtailment. Local-owned wind turbines in Orkney can be curtailed as much as 40% of the time (Watts, 2019), which represents a substantial loss of revenue to these fragile communities. The underwater data center increased electricity demand, although very minimally, and therefore may have reduced curtailment.
Grid carbon intensity is oblivious to the islanders’ plight and to curtailment in general. The calculation is insensible to the places where green electricity capacity exists but is being lost due to the lack of demand.
Curtailment happens across national grids. Large-scale generators, such as offshore wind farms and fossil fuel power stations, respond to signals from the grid that require them to reduce generation due to unanticipated lack of demand. 8
Depending on their location, data centers might increase or decrease electricity demand in an area, influencing revenue distribution that occurs due to curtailment. Researchers have started to examine how data centers could respond to curtailment signals (Zheng et al., 2020). However, there lacks a consideration of the community benefit that might result: The ethical issue of whether to increase the sale of local-owned curtailed wind electricity (as in Orkney) or corporate-owned curtailed wind electricity (as in Björkvattnet).
Our point is that the flattening of the grid into place-less carbon intensity makes it difficult to correlate with place-based curtailment and communities. Rather than addressing curtailment, data center companies are instead moving to install their own power “behind the meter,” which usually means an onsite microgrid that is not managed by the grid operator. Data centers are being co-located with solar, nuclear, and wind farms, for example. This can add further challenges to the grid since regulations often require grid capacity to be available in order to carry power away from these microgrid systems should the data center go offline.8 “Bring your own power,” as the data center industry calls it, adds to grid capacity problems and could lead to curtailment of other renewable energy generators in the same grid zone; there are only so many electricity cables to go around.
Unflattening the grid showcases the fine-grain relationship between the electricity demand by data centers and curtailed renewable energy generation.
Unflattening grid reinforcement
A parallel issue to curtailment is grid reinforcement. Wind power plants of the scale of Björkvattnet, with a current annual electricity output of 175 megawatt-hours, aims to output more than 500 gigawatt-hours, putting enormous pressure on the local grid. This massive increase in the region's grid capacity must go somewhere. It has to be transmitted down power lines or consumed in the area; otherwise, the grid will go off balance and the lights will go out. With PPAs in place, the wind turbines have a guaranteed connection to the grid and are unlikely to be curtailed except in extreme circumstances. As a result, the Swedish national grid operator, Svenska Kraftnät, has to reinforce transmission capacity in the area—it has to build more power lines, cables, and substations. In the meantime, it has contracted balancing services from a grid battery provider, Neoen. The company installed a battery array near Björkvattnet in 2024 (Neoen, 2023) as the first stage in grid infrastructure reinforcement. The batteries store wind energy when producing more than the grid can take and then release electricity to the grid when the wind turbines reduce their output. The battery park was built in spite of some politicians and citizens being against it for the fear of fires and environmental contamination, and not consenting to its installation after allowing the wind power infrastructure to be built.
Electricity grids are dimensioned—built and operated—for a specific capacity; there are material limits on what power cables and substations can carry. Places considered “energy rich,” such as Orkney and Björkvattnet are often distant from population centers and consequently have serious grid capacity limits. Consequently, grid reinforcement is slow work: A line of pylons cannot just be built through people's backyards. Offshore wind farms in the North Sea are waiting more than ten years to secure a connection to the UK national grid because it will take that long to build out the infrastructure needed to transmit power from the North Sea coast to cities (Dempsey and Plimmer, 2023). In the United States, the average wait time for grid connection is 5 years, but the queue for new renewable energy projects stands at 2.6 TW, which is twice the US current generating capacity (Rand, 2024). Grid reinforcement involves installing miles more grid cables, pylons, and substations, which is currently being done in Ragunda, Sweden, raising more questions and contestations by residents and politicians that remain unsettled. Grid reinforcement is necessary to transmit electricity from where it is generated from new renewable energy power plants to where it is consumed, such as in a hyperscale data center on the outskirts of a city. However, grid reinforcement is also a source of disputes and politics that are rendered invisible by carbon metrics.
Grid reinforcement is a preeminent issue across national grids in the transition to green electricity. Grids are shifting from burning fossil fuel to intermittent renewable power: The wind, sun, and tides change with the weather and with the turning of the Earth. By contrast, energy infrastructures in the Global North are aligned with cultural expectations of “always on” connectivity and are considered a public service. People and businesses, particularly data centers, expect electricity to be nonintermittent. Grids must transform not only their generators but also their entire infrastructure to keep the lights on, even when the wind doesn’t blow. The nuance of this ongoing transformation to a decarbonized grid is flattened into obscurity when the data center industry engages with electricity only in terms of its carbon intensity.
Unflattening grid grabbing
Due to grid constraint, data center demands for terawatts of low-carbon energy lead to stark choices for electricity grid operators. Data center vendors are crowding out competing industries, as they order or “book” their electricity capacity years in advance, preventing others, such as new homes or businesses, from being allowed to connect to under-dimensioned grids (Libertson et al., 2021; Ortar et al., 2023). The long-term electricity demands by data centers have led to conflicts around the fair distribution and access to electricity by communities and cities that are difficult to resolve (Velkova, 2026).
Data centers reserve electricity capacity a decade or so into the future as a hedge. Companies “over book” capacity to cover all the electricity they might need in the future. This is one way that data center operators can offer dynamic and scalable low-carbon computation services in the cloud to their customers.
This overbooking of grid capacity is a result of a logic of hyperscalable computation (see Narayan, 2023; Velkova, 2026). It is akin to “land grabbing” and “ocean grabbing,” where large organizations expropriate land or seabed as property to prevent others from accessing the resource, often to the detriment of local communities (Bennett et al., 2015; Burow et al., 2018). The optics are the same. There is an empty map (terra nullius) of grid carbon intensity on which data center companies can locate themselves to claim the low-carbon electricity in that grid zone. Grid carbon intensity maps and their relational flattening produce a kind of electra nullius, that is, the mapping of an electricity grid that appears empty, filled with extractive potential, with no existing relations between people, their places, species, and histories visible. We think of this as “grid grabbing,” and it uses familiar energy extractive logics: the dispossession of local people, industries, and places from their electrical power.
In summary, data center companies are more than just entangled in energy politics or mere buyers of low carbon electricity. They are reshaping the materialities, landscapes, politics, and potential of electricity grids through a vision of power grids presented as flat carbon intensity maps.
Unflattening grid resource
Renewable energy is place specific; energy infrastructures require natural resources as well as technical equipment. Orkney and Björkvattnet have substantial wind power, but London and Stockholm do not, and no amount of energy market tinkering can change this. Places come with both grid capacity limits and environmental resource limits: The wind is here, not there.
Although data industries are interested in shifting computation to sites of renewable energy, grid carbon intensity knows nothing about the different environmental resources in different places. Grid carbon intensity contains no geography, as we have argued. It flattens the infrastructure into a large grid zone. Landscape resources are invisible. The carbon intensity of electricity knows nothing about where the winds blow and the tides flow. It does not know where wind generators are or where they could be in the future.
Grid carbon intensity purports to make climate concerns visible to data industries so that data processing and machine learning can be said to be powered by renewable energy. Electricity Maps provides this information to its data industry clients. Therefore, grid carbon intensity is economically, politically, and technically productive. However, the metric removes data industries, particularly data center clients, from the place-based decisions and challenges associated with grid decarbonization, such as where environmental power is actually located.
We are not arguing that the carbon intensity of the grid is the only metric that data industries use in their decision-making and environmental assessments, but it is a crucial one. Grid carbon intensity does not allow data companies, particularly data center customers who use cloud-based services, to participate in localized, landscape specific energy—and data—futures they are already enrolled in.
Discussion
In this article, we have investigated one encounter between the energy and data industries through one metric, grid carbon intensity, and associated practices such as power-purchase agreements. We also investigated how this metric is generated from energy industry cables and sensors, and becomes flattened into a metric that data industries use in their emissions dashboards and decision making. Although shown on maps, we have demonstrated how grid carbon intensity has no geography but is an effect of electricity network topology; it is constituted as an object where grid boundaries can be made through cable bottlenecks, power measurements and modeling.
We have shown five issues related to decarbonization of the electricity grid that are invisible to the data industry due to grid carbon intensity flattening away relations:
Unflattening carbon offsetting and power purchase agreements make visible human and nonhuman struggles for livable futures in low-carbon energy landscapes, such as reindeer pastures for the Sámi villages in Björkvattnet. Unflattening grid curtailment makes visible local communities and nonlocal investors who generate revenue from increased electricity demand by data centers. Unflattening grid reinforcement makes visible the challenge of transforming the electricity grid to a low-carbon energy system and how data centers participate in this. Unflattening grid grabbing shows how data center companies expropriate electricity from grid regions to the detriment of local businesses and homes. Unflattening grid resource allows data center companies to see local environmental resource and the potential for where renewable energy generators could be located in the future.
Through these five issues, we emphasize the deeply entangled way that data and energy industries are bound together through the electricity grid.
Our approach to unflattening grid carbon intensity followed the call of Pasek et al. (2023a) for relational footprinting. Through this approach, we demonstrated how data industries, when using this metric to reduce their carbon emissions, are unable to know how they are interpellated into unsustainable social, environmental, and technical relations in the places that power them. In particular, we showed how grid grabbing and insensibility to grid decarbonization impacts the livable future for those whose lives and landscapes interact with data centers (even when they are not located there, such as Ragunda). Now, we want to raise two further important implications.
From public to private power
First, the loss of relational knowledge for the data industry fails to expose the blunt fact that electricity infrastructures are finite, so data infrastructures are finite. Despite predictions of exponential growth in both electricity capacity and data center power demand, neither can hold (e.g. Goldman Sachs Insights, 2024). Industry, policy, and many scholars continue to assume that computation capacities could be limitless, an imaginary inherited from cultural practices of dematerializing energy in computing (Pasek, 2023c). However, no matter how much wind power you contract on paper, you still need cables and material substrates to move both electrons and digital bits. Constraint on the electricity grid is an ipso facto constraint on data networks. This may not be just a technical problem that can be solved. These limits may be inviolate for political, social, and environmental reasons. Grid carbon intensity flattens these facts and fails to attend to the limits of metals, power lines, communities, animals, and environments.
Second, these entangled energy-data futures have widespread implications for the electricity network as a public service. Grid grabbing is about the privatization of electricity access through policy instruments and contracts, such as power purchase agreements. These remove present and future renewable energy capacity from the public sphere and funnel it into private digital companies; sometimes, not even to power their data centers but simply to offset their corporate carbon accounts, as in the case of Björkvattnet.
Rather than seeing this as some energy-data dystopia, we conclude with a more generative proposal that moves from these flatlands to more livable futures.
From electricity map to electricity atlas
We are inspired by existing moves to unflatten territorializing maps. Decolonizing approaches to maps note how they can provide different orderings of knowledge: Maps do not have to show territories but can show navigation and geographic stories (Huggan, 1995; Turnbull, 1993). The Feral Atlas (Tsing et al., 2020) demonstrates how relations across species, economics, politics, and culture can be made visible together online. Crawford (2021) emphasized how AI computation benefits from taking an atlas approach, moving from universality to partiality, and from transparency claims to accountable interrelations.
Following these but attuned to our encounter between energy and data, we imagine an “electricity atlas.” This proposal is not intended as a solution but as a speculative fabulation to stay with the trouble of grid carbon metrics and to explore how other futures might get made (Haraway, 2013). An atlas is not one holistic map of the world but a collection of partial maps and related knowledges—populations, pieces of places, and perhaps even histories.
An electricity atlas would have pages or layers of information relating to a geographic region. The carbon intensity of electricity and other data used in power-purchase agreements would be transformed into related, perhaps overlayed, pages. Pages might include the following data that we believe is available or could be:
Environmental resource maps across different energy types with a page on wind energy, solar energy, tide energy, and so on (e.g. Global Wind Atlas).
9
Heat maps of the electricity grid showing where grid curtailment is severe (e.g. ESO Stability Pathfinder).
10
Geographic locations of power plants showing the names of their owners, whether a large energy company or local community organization (e.g. Carbon Brief's visualization).
11
Visual database of Environmental Impact Assessment or similar planning reports for energy and data infrastructures, which are required to reflect on the long-term multispecies and human relations. Highlighted areas of public concern with access to public consultations that have happened and make visible siting issues. Locally curated page of photographs and oral histories relating to existing electricity and data infrastructures, perhaps including archeological records (e.g. Trove in Scotland).
12
This is just a partial list of what an electricity atlas might contain based on our situated knowledge. It is limited by our Northern European field sites and we encourage expanding and altering this imagined electricity altas for different locations.
Even though what we propose is normative in many respects, we can speculate on five more livable futures that might result from data industries living with such an unflat electricity atlas (Watts, 2018). In this speculative writing, we do not intend to predict a future or expect this to be taken as a literal roadmap. Speculative fabulations, such as these, are intended to explore the possibility for futures being otherwise not to determine them. They are “modest possibilities for partial recuperation” (Haraway, 2016, p. 10). Therefore, we invite these more livable futures to be read with a sense of the possible.
A data center operator wants to reduce their carbon emissions and considers investing in a North Sea offshore wind farm. They look at the electricity atlas and learn that there are risks due to a lack of local grid reinforcement and public concerns around the siting of substations in peatland, which is important for both carbon sequestration and wildlife. The operator looks at the resource map and notes the massive potential for tide energy up the coast, where a local organization has uploaded a report on a tide energy array that has planning permission. Therefore, the data center operator makes an investment to support the popular tide energy array, not in the delayed offshore wind farm. This supports the future of a precarious coastal community. An urban data center operator is considering how to upgrade its backup power, which is a diesel generator. They want to reduce their carbon footprint but have limited space. They look at the electricity atlas and discover there is a local energy company that represents houses and businesses in the city who have formed an energy community (Chemnitz et al., 2021). They have home batteries, solar panels, electric car charges, and thermal storage, which they balance among themselves and from which they sell electricity to the grid. The urban data center contracts this local organization to provide their backup power and forms a long-term, trusting relationship with them. A northern European data center company wants to build another data center, but it is struggling to find a suitable power purchase agreement that is big enough with good local relations. The company looks at the heat maps of grid curtailment and identifies three points in the grid infrastructure where excess capacity is wasted. Instead of one hyperscale data center, the company builds three smaller data centers near these sites of grid curtailment and shifts computational load to follow the curtailment. Owing to their support of locally owned, formerly curtailed, renewable energy generators, they increase local income from the wind turbines and contract extremely cheap electricity from the local owners. A customer of a multinational cloud provider accesses the electricity atlas and learns how they are interpellated into problematic relations. To improve their own sustainability report, they demand a contract from their cloud provider that includes not just carbon emissions but also qualitative statements around sustainability of landscapes and places where the data centers they use are located. A multinational cloud company wants to reduce its carbon offset by increasing local power supplied directly to its data centers and decreasing energy costs. By reading the electricity atlas, it deduces that several of its data centers are in areas where a variety of grid decarbonization projects are planned and have widespread local support. It makes an investment in these local projects, which reduces their costs to the energy operator, lowers consumers’ bills (who would otherwise have to pay for grid upgrades), and the multinational receives a favorable electricity price as a result.
These are livable futures that we speculate on, given the existence of an unflat electricity atlas that restores the relations we have shown to be lost when calculating grid carbon intensity. Livable futures for data industries require the maintenance of livable relations. These are not relations to carbon as a number but relations between people, places, energy, and data.
We are mindful that data industries have diverse company cultures, with some focusing on environmental sustainability as a selling point (as we have discussed) and others removing such references from their reporting. Therefore, this unflat electricity atlas is not prescriptive but serves as a direction for future research and collaboration. We present this speculative future to demonstrate how data industries could participate in making a shared energy-data future that is more sustainable for themselves and for us all.
Footnotes
Acknowledgements
The authors thank the communities in Ragunda, Sweden, and Orkney, Scotland, for their collaboration; as well as the data center and energy industry professionals, particularly Electricity Maps, who shared their insights with us. They greatly shaped and motivated this article. The authors thank Flora Mary Bartlett, Harald Rohracher, and Johanna Sefyrin, our fellow research team, for their sharp comments that significantly informed and improved this work; and the three anonymous peer reviewers for their careful reading and constructive suggestions. Velkova thanks the REIMAGINE-ADM project research team for timely feedback on an earlier version of this article.
Ethical approval and informed consent statements
We adhered to the ethical standards for social science research at Linköping University which are in compliance with the procedures as mandated by the Swedish Research Council and the Swedish Ethical Review Authority. We have signed consent forms from all interviewees who participated in the research and provided qualitative data for the article. Parts of the research on the Björkvattnet wind power plant developments included interviews with politicians and indigenous people that required special ethical approval which was granted by the Swedish Ethical Review Authority, under application number 2022-07241-01.
Funding
The authors disclosed receipt of the following financial support for the research, authorship, and/or publication of this article: This research was funded by the Marianne and Marcus Wallenberg Foundation, project 2022.0070 “Megabytes vs Megawatts: Understanding Infrastructural Frictions between Data Centers and Energy Grids for Sustainable Digitalization”, and co-funded by Linköping University. Parts of the fieldwork in Ragunda municipality were funded by the Swedish Energy Agency under grant nr. 52641-1, project “Municipalities in tailwind and head-wind”.
Declaration of conflicting interests
The authors declared no potential conflicts of interest with respect to the research, authorship, and/or publication of this article.
Data availability statement
Data is qualitative and due to consent limitations is not available to anyone outside the project.