
Abstract
Technologies in the smart city, such as autonomous vehicles and delivery robots, promise to increase the mobility and freedom of people with disabilities. These technologies have also failed to “see” or comprehend wheelchair riders, people walking with service animals, and people walking with bicycles—all outliers to machine learning models. Big data and algorithms have been amply critiqued for their biases—harmful and systematic errors—but the harms that arise from AI's inherent inability to handle nuance, context, and exception have been largely overlooked. In this paper, I run two machine learning models across nine cities in the United States to attempt to fill a gap in data about the location of curb ramps. I find that while curb ramp prediction models may achieve up to 88% accuracy, the rate of accuracy varied in context in ways both predictable and unpredictable. I look closely at cases of unpredictable error (outlier bias), by triangulating with aerial and street view imagery. The sampling of cases shows that while it may be possible to conjecture about patterns in these errors, there is nothing clearly systematic. While more data and bigger models might improve the accuracy somewhat, I propose that a bias toward outliers is something fundamental to machine learning models which gravitate to the mean and require unbiased and not missing data. I conclude by arguing that universal design or design for the outliers is imperative for justice in the smart city where algorithms and data are increasingly embedded as infrastructure.
Introduction
In 2018, 3 years after Uber started experimenting with autonomous vehicles (Metz and Conger, 2020), Elaine Herzberg was walking her bicycle across the street in Tempe, Arizona, and was struck and killed by one of Uber's self-driving cars (Wakabayashi, 2018). The algorithms detected her but classified her as a vehicle, then a bicycle, then other, and on and on until it was too late. How did this happen? The algorithm trained to recognize pedestrians was not taught to look for jaywalkers and had never seen anyone walking a bicycle (Marshall and Davies, 2019; Whittaker et al., 2019). Delivery robots on city sidewalks have similarly failed to recognize pedestrians. Haben Girma, who is blind and walks with a service animal, was blocked on the sidewalk by a delivery robot (Girma, 2020). Emily Ackerman, a power wheelchair rider, had a similar experience with a robot in Pittsburg. As she writes, “The robot was sitting motionless on the curb cut on the other side of Forbes Avenue. It wasn’t crossing with the rest of the pedestrians, and when I reached the curb, it didn’t move as the walk signal was ending. I found myself sitting in the street as the traffic light turned green, blocked by a non-sentient being incapable of understanding the consequences of its actions” (Ackerman, 2019). These examples point to artificial intelligence's (AI) potentially deadly inability to deal with context, nuance, and outliers which leads to a particular harm or bias to people with disabilities. 1
With unintended consequences that range from merely annoying to fatal, when these kinds of technologies consider accessibility and disability in their boosterism, they often promise to increase the mobility, freedom, and inclusion of people with disabilities in urban environments. Such smart city rhetoric is often techno-ableist, meaning infused with an ableist view of “disability that at once talks about empowering disabled people through technologies while at the same time reinforcing ableist tropes about what body-minds are good to have and who counts as worthy” (Shew 2020, 43; see also Newman-Griffis et al. 2023). Disability justice scholars and activists acknowledge ambivalence toward technologies which can at once reinforce ableist notions while also contributing to independent living (e.g., see references to cyborg in Kafer, 2013). We would be remiss to simply critique these developments in the smart city as techno-ableist at best. For example, autonomous vehicles, which use deep learning to sense the environment in real time (Li et al., 2020), might give people who cannot drive the ability to go wherever they like. In the United States, people with disabilities take fewer trips than those without (Brumbaugh, 2018). Many believe that self-driving cars would begin to bridge that long-standing gap (for example, Alexiou, 2021; Claypool et al., 2017; Fiol and Weng, 2022; Reardon, 2021; VentureBeat, 2020). The same AI sensing technology powers delivery robots, which could similarly improve quality of life by bringing prescriptions or groceries to people who otherwise hire someone to do those errands (Hossain, 2022). 2 Other scholars have used AI tools to examine the accessibility of the transportation environment, including sidewalk assessment (Abbott et al., 2018; Bolten et al., 2015; Ku et al., 2022; Luo et al., 2019; Marangão et al., 2022), Americans with Disabilities Act (ADA) 3 compliance evaluation (Ai and Tsai, 2016; Goldchain, 2017; Saha et al., 2019), and crosswalk identification in aerial images (Ahmetovic et al., 2017; Berriel et al., 2017; Ghilardi et al., 2018; Li et al., 2023).
The case of transportation, artificial intelligence, and accessibility illuminates weaknesses and contradictions in the smart city. Disability justice scholars and practices of universal or inclusive design may provide helpful avenues for addressing the harms of data and algorithmic bias. In this paper, I use the specific case of curb ramp classification across two algorithms, multiple data sources, and nine cities to understand the textures of outlier bias on an infrastructural feature. This analysis allows me to examine how error varies across context in ways that are not systematic and thus cannot just be coded in. Drawing on disability justice and inclusive design, I propose a new frame for interpreting and working toward a more universal right to the smart city.
Bias in the smart city
The smart city is not something wholly new, but rather a new iteration of old ideas (Kitchin et al., 2023). It is also an empty signifier which “contains no inherent meaning on its own, but remains flexible in its applications potential” (Burns, Fast and Mackinnon 2023, 4). For the purposes of this research, I define the smart city as a city run on complex algorithms and ever bigger datasets. In this smart city, the data and algorithms are part of the infrastructure.
Data and algorithms are biased—the error is distributed unevenly. This uneven error often disproportionately harms certain populations (D’Ignazio and Klein, 2020; O’Neil, 2017). These biases emerge with the application of new algorithms to new arenas of life. For example, facial recognition software less accurately identifies female and non-white faces (Buolamwini and Gebru, 2018), people of color are more likely to be labeled criminals by policing algorithms (Selbst, 2017) and more likely to receive longer jail sentences (Angwin and Larson, 2016), and families in poverty are more likely to be targeted by algorithms for child welfare investigations (Eubanks, 2018). New iterations of generative AI are no better and have been observed amplifying racial and gender discrimination (Nicoletti and Bass, 2023; Srinivasan and Uchino, 2021).
Some systematic and harmful errors could have been caught before they did harm by simply looking for patterns in model error. Google's ethical AI team released a paper in 2019 that amply covers a framework for doing just that. Their framework, “model cards for model reporting” suggests conducting “benchmarked evaluation in a variety of conditions, such as across different cultural, demographic, or phenotypic groups” (Mitchell et al., 2019). While the standardization of such ethical reporting is more complex in practice, the solutions are straightforward.
However, there is another class of errors which are potentially more pernicious because they are not so cleanly systematic. I call these kinds of errors outlier bias because they systematically exclude or harm any person or event that falls outside of a social or algorithmic conception of “normal.” 4 People with disabilities are an expansive constituency group, and the kinds of algorithmic errors that negatively impact this group could not be coded out of an algorithm easily (Treviranus, 2018). An algorithm used for employment screening, for example, has been shown to disproportionately harm people with disabilities (Engler, 2019; Whittaker et al., 2019). Even recognizing this, weeding it out is almost impossible. As Shari Trewn, an accessibility researcher at IBM states, “The way that AI judges people is with who it thinks they’re similar to—even when it may never have seen anybody similar to them—is a fundamental limitation in terms of fair treatment for people with disabilities” (Engler, 2019). The encounters with autonomous vehicles and robots outlined above fit this kind of non-systematic outlier error within machine learning.
Classification, emergent consequences, and a right to be an outlier in the smart city
Outlier bias illuminates avenues for bias and harm in the smart city that lack technical solutions. Not everything can be counted or turned into data (Bowker and Star, 2000; D’Ignazio and Klein, 2020; Onuoha, 2019). Yet, data algorithms from simple linear regression to generative AI assume that data are normal, un-skewed, not missing, and not biased and do not contain outliers. Practically speaking, “no classification system, any more than any representation, may specify completely the wildness and complexity of what is represented” (Bowker and Star, 2000: 232). Thus, no algorithm that requires data can be unbiased and that bias is likely to emerge in wild and unpredictable ways.
If the right to the city is the right to live in the city and be unalienated from the production of new forms of urban life (Attoh, 2011; Harvey, 2003; Lefebvre, 1992), what does this mean in the smart city? Disability justice scholars and practices of universal or inclusive design provide avenues for productive work. Specifically, design from and for the margins is most likely to benefit most people (Hamraie, 2017; Hamraie and Fritsch, 2019; Treviranus, 2021). The curb ramp itself is an example of universal design (see Figure 1). While a product of the disability rights movement, it benefits anyone on or accompanied by wheels (e.g., a parent pushing a stroller or a traveler pulling luggage).

Curb ramp (United States Department of Justice Civil Rights Division, 2012; author photo).
What would the universal right to the smart city look like in practice? In this paper I explore that question through the case of curb ramp classification in nine urban environments across the United States using two machine learning algorithms. First, the lack of data on curb ramp locations disadvantages people on wheels from navigating the environment and stunts ADA compliance enforcement. Second, the curb ramp is identifiable and classifiable by humans but also ranging in characteristics so that it is more difficult for machines and algorithms to identify. Using triangulation and qualitative methods, I explore algorithmic error to contribute to understanding outlier bias.
Methods
Study area and data
AI methods require training data. I created a training set based on the open data about curb ramps for nine cities across the United States: Arlington, Boston, Denver, Indianapolis, Nashville, San Francisco, Seattle, Spokane, and Washington DC. Based on work assessing the open data practices across U.S. municipalities (Deitz et al., 2021), these nine cities were the only ones with both adequate data on curb ramp locations (for labeling), LiDAR point cloud data that were open and spatially/temporally proximate to the curb ramp data, and aerial imagery at the time of this analysis. These data were sourced from the USGS (2020) (see Table 1). The LiDAR point clouds had densities ranging from 4 to 45 points per meter. Data on the location of streets and landmarks came from the Census’ TIGER/line shapefile program (US Census Bureau, 2020). I classified ground points in the LiDAR data using the standard algorithm in ArcGIS. This algorithm has a tolerance for slope variation that allows it to capture gradual changes in topography (ESRI, 2020). With the street data, I created a point feature for intersections by finding all locations where two streets crossed.
Data source and year of measurement*.

*All TIGER/line data are from 2020.
I then created a tessellation of hexagons across each city. Each hexagon has an approximate area of 50,000 square feet (see Figure 2). I selected one of these hexagons per city as my training sample for a total of nine hexagons. This was done to reduce data size and to have a balanced sample 5 area from each city. I created a second sample of 10,000 square foot hexagons as the validation set for each city.

Training and validation samples.
Within these nine hexagons, I created a second hexagon tessellation of equal areas of about 50 square feet. This was done for multiple reasons—to capture the aerial nature of curb ramps in real life, to create a balanced sample of labeled points and to add spatial contiguity to the balanced sample. While a curb ramp is not necessarily a discrete entity (but rather a sloped and blended area connecting paths), most curb ramps do not extend beyond 50 square feet. 6 These smaller hexagons were clipped to the LiDAR-labeled ground locations because a curb ramp is not going to be found, for example, on the top of a building or in a tree (see Figure 3).
Ground hexagon samples.
Next, I created a sample of the smaller hexagons with equal numbers of ramps and non-ramps across the training and validation areas of each city. In total, this resulted in 25,822 hexagons for training and 5,054 for validation. These hexagon locations were used to clip the point data from the LiDAR point cloud. The point dataset had 1,117,930 points for training and 251,131 for validation. Within the point training and validation set, I calculated the distance to the nearest: street, intersection, and landmark. I also summarized the DEM and aerial image raster information at the point. Figure 4 summarizes these data cleaning processes.

Overview of data cleaning and methodological approach.
Machine learning
I ran two machine learning algorithms to predict curb ramp locations and triangulate predicted results. The selected models used were random forest regression and a point-based convoluted neural network (PointCNN; see Figure 4). The random forest method was used because it is one of the oldest machine learning methods and relatively less opaque. The PointCNN model is a cutting-edge deep learning model used for sensing environments, and the mechanisms for learning are hard to decipher. The differences between the models are interpretability, newness, and spatial awareness.
Random forest classification
Random forest classification is one of the oldest machine learning methods. It was developed by Tin Kam Ho in 1995 and improved by Leo Breiman in the early 2000s (Breiman, 2001; Ho, 1995). The random forest regression method simply involves running multiple models or decision trees through a set of training and prediction data and allowing them to vote on the answer for each location. I ran the random forest using the scikit-learn library for Python in Google Colab. The variable to predict or classify was a binary ramp value, and the potential explanatory variables were distance to street, distance to intersection, distance to landmark, elevation from a digital elevation model (DEM), and raster value across all four aerial imagery bands. The random forest model is spatially unaware, in the sense that it does not account for or weigh neighboring features. The distance measures and raster values were added as predictors to manually give the models spatial information.
PointCNN
PointCNN is a deep learning model using convolutional neural networks (Li, 2021; Li et al., 2018). Convolutional neural networks, or CNNs, are a promising advancement in object detection using AI and have been used extensively on autonomous vehicles. At the basic level, a CNN scans over the input data and breaks it into smaller parts. PointCNN is especially suited for LiDAR data because it accounts for the irregular and unordered nature of point clouds. I ran PointCNN using the ArcGIS deep learning frameworks and Jupyter notebooks. I set up my model with 100 epochs, early stopping 7 , and a one-cycle learning rate. The one-cycle or cyclical learning rate method lets the learning rate cycle between reasonable boundaries and has been shown to achieve improved classification accuracy over fewer iterations without a need for further tuning (Smith, 2017). Extra features (beyond x, y, and z) used for learning included LiDAR intensity, scan angle, and return number. The validation loss stopped decreasing at 11 epochs.
Error and outlier analysis
I analyzed the success of these models on the classification task according to classic accuracy metrics, contextual benchmarking, triangulating between models, and a qualitative process of ground-truthing with Google Street View imagery.
Performance metrics
As stated above, machine learning results are predominately evaluated in terms of overall accuracy and by class (see Table 2). Overall accuracy is simply the proportion of correct classifications over all possible classification locations. Precision is used to understand the proportion of positive identifications that were correctly classified. Recall accounts for the number of false-negative classifications or the number of positive classifications that were correctly identified. I calculated all three-performance metrics for each model across the entire sample.
Performance metrics.

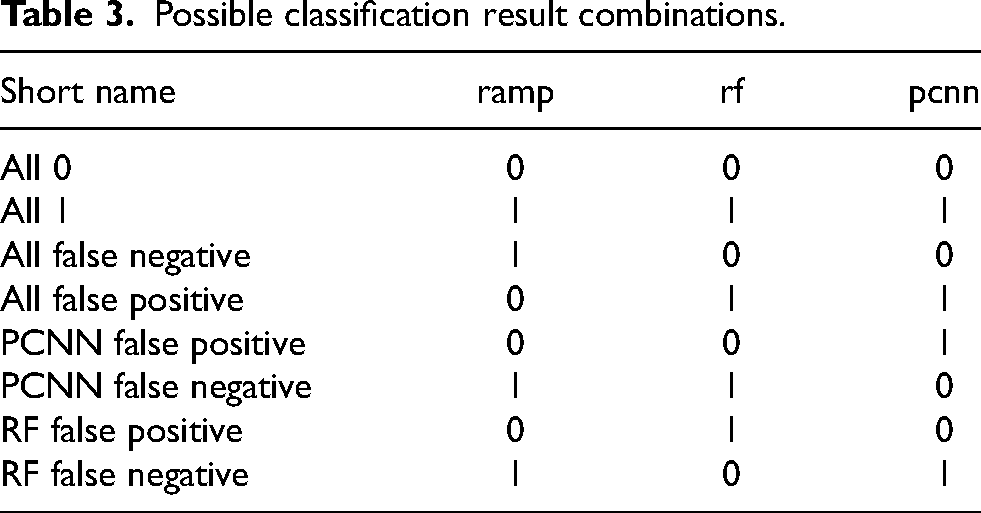
I also looked at the rate of agreement between models and the original training data. There were eight possible combinations of results (see Table 3). The first two were that all were correct (all 0, all 1, where 0 is not ramp, and 1 is ramp). The second two were that all were incorrect (all false negative, all false positive). The next four were combinations of only one model or the other making a false classification (PointCNN (PCNN) false negative, PointCNN false positive, random forest (RF) false positive, and random forest false negative).
Possible classification result combinations.
Contextually benchmarking
I then looked at the error in a way like that proposed in “model cards for model reporting.” That is, “benchmarked evaluation in a variety of conditions” (Mitchell et al., 2019). In this case, my conditions were geographic area and model. I calculated the overall accuracy by city and model as well as the agreement between models by city. The model comparison could also be called triangulation.
Qualitative analysis
Finally, I used satellite imagery (Google Street View) and cartographic visualizations to better understand the error for a random sample of locations and look for potential non-systematic outliers. I mapped the model predictions on an aerial image and found the locations in Google Street View. Pairing the results, aerial imagery, and street view imagery allowed for thicker description of the performance measures and contextual benchmarking. This method also allowed for the identification of outliers and surprise trends. The act of showing rather than just telling and reporting opens the process to other interpretations and observations. The results of this qualitative work are presented in the discussion section below (see Figures 5–8).
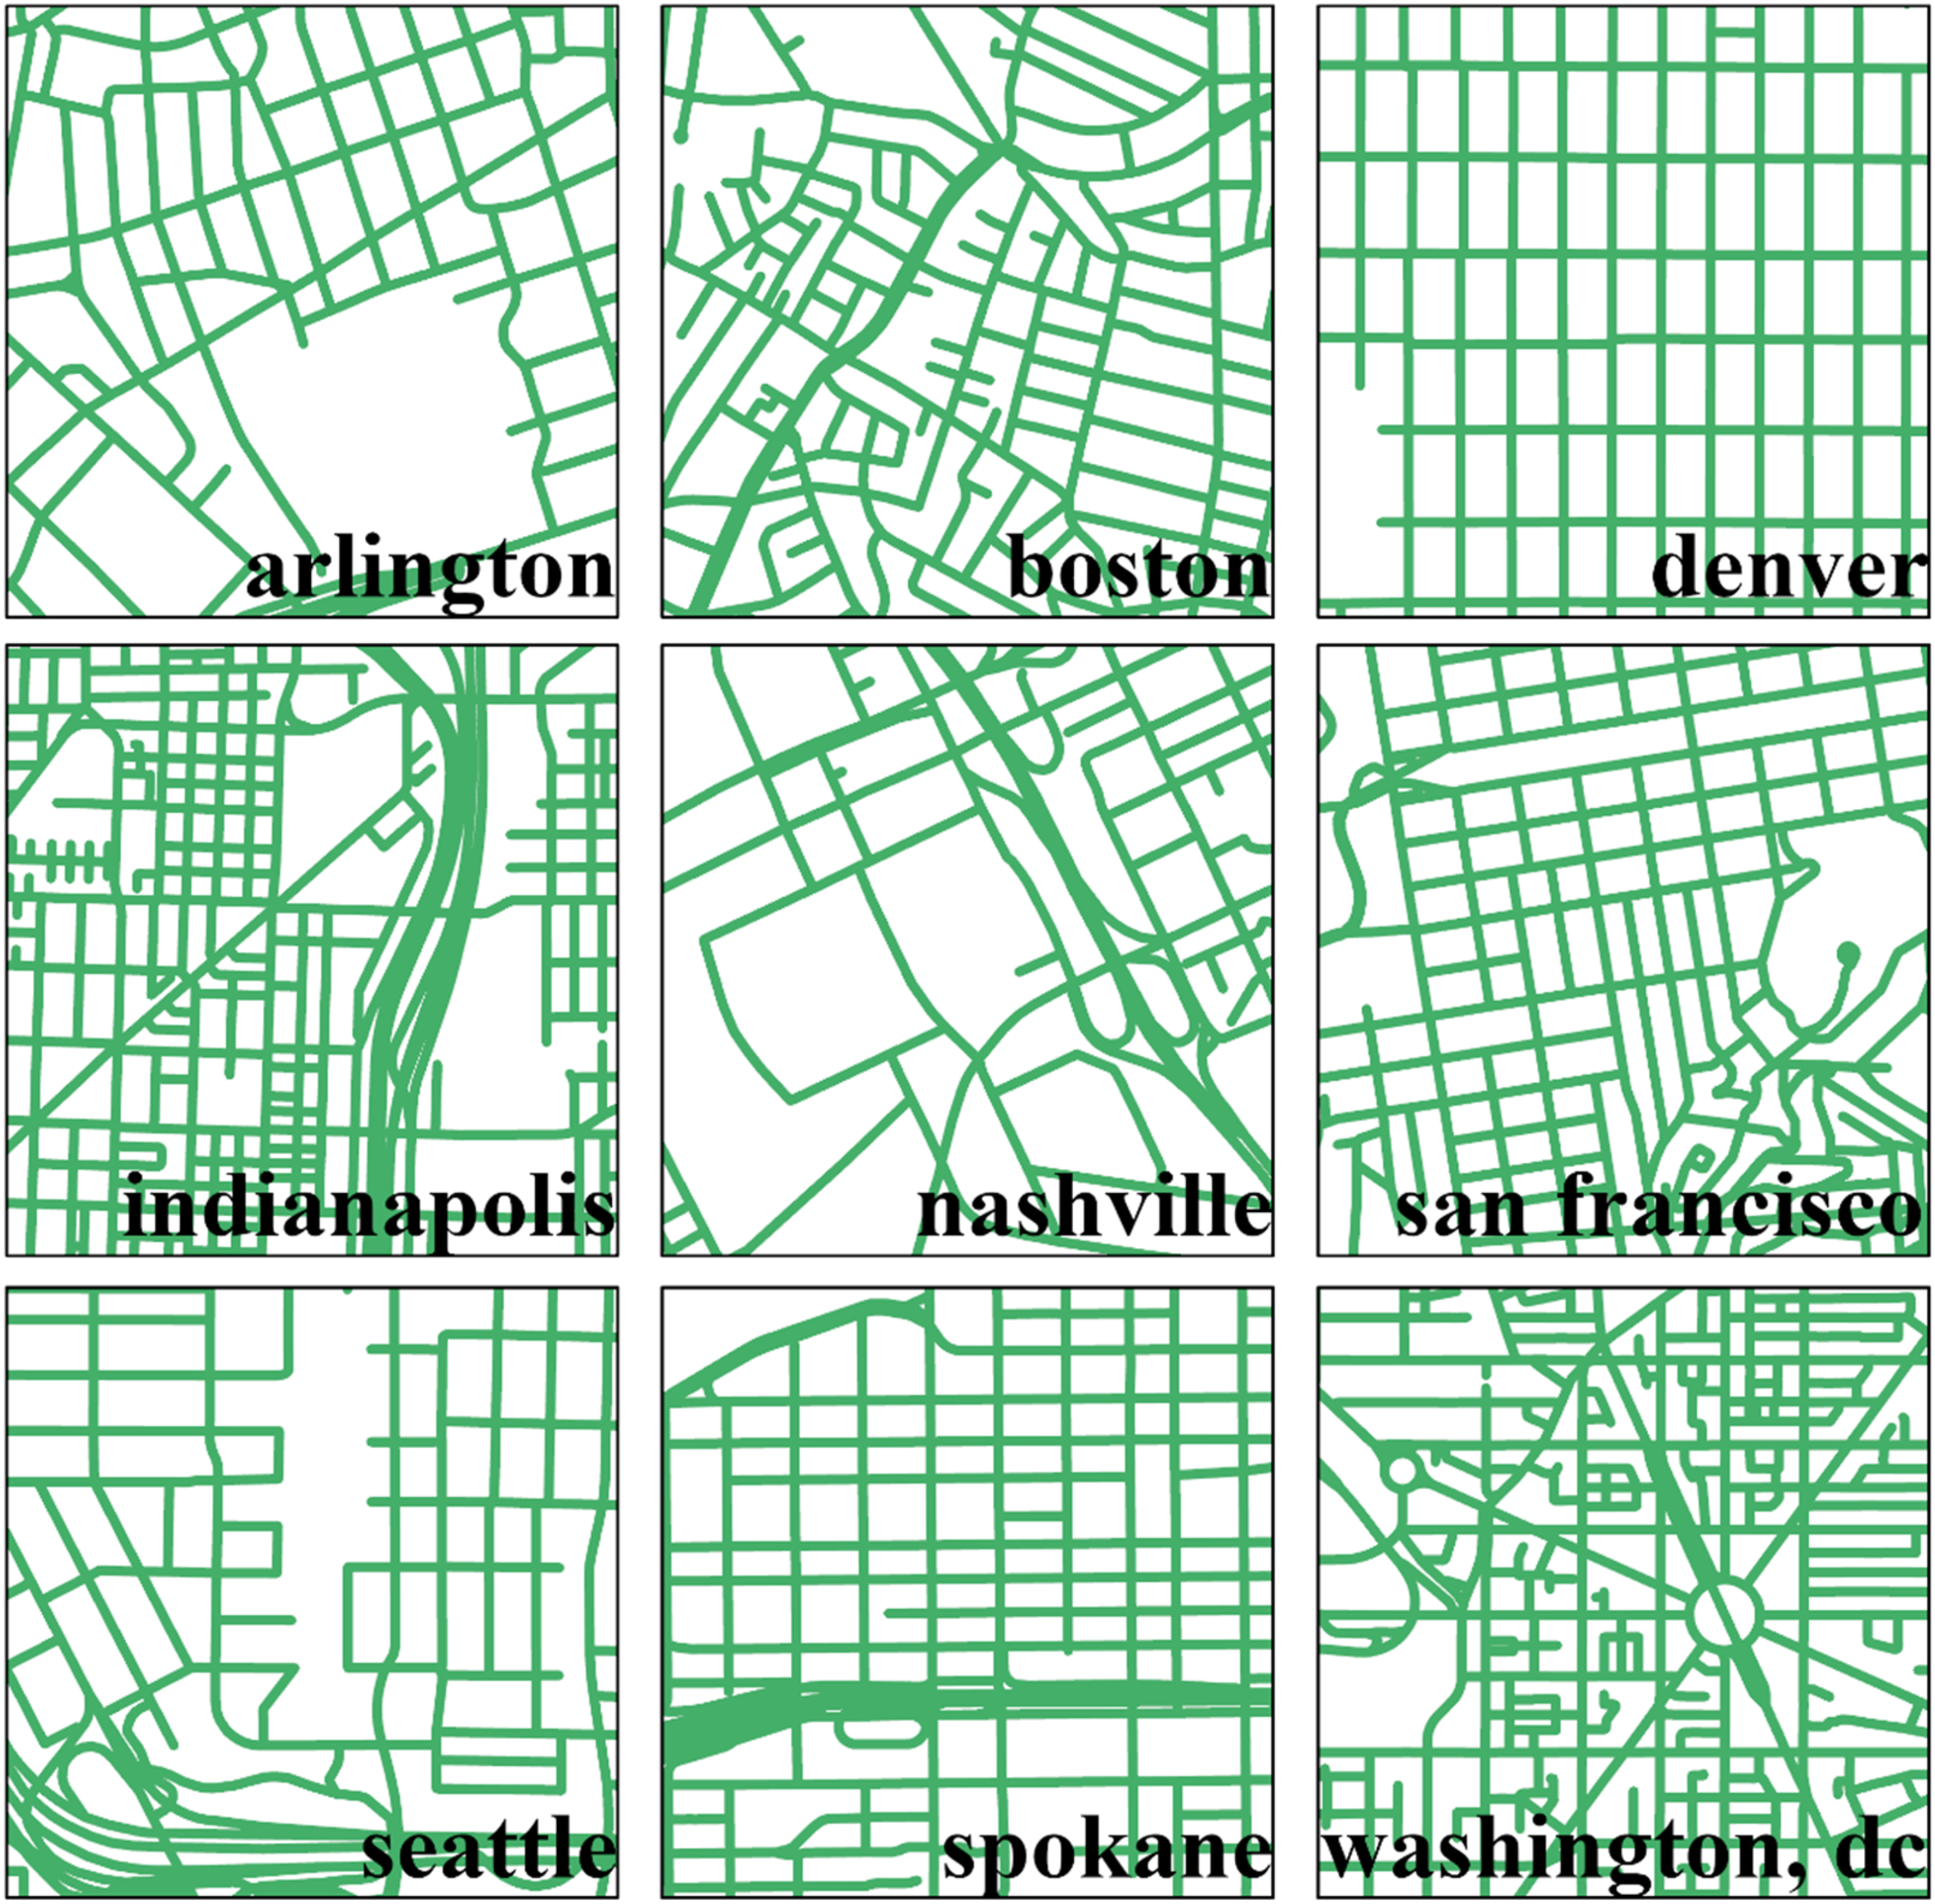
Street design by city.

Denver ground truth. Each of the four quadrants (a, b, c, d) shows the hexagon data area with colors representing the kinds of point prediction that occurred at that location (I aggregated similar predictions back to a polygon from a point). The base of the map is an aerial satellite image. The images labeled 1–5 are from Google Street View at that location.

Arlington ground truth. This is one intersection with five ramp locations (hexagons) and Google Street View imagery showing more the view on the ground. Letters a–e connect the imagery to the hexagon locations.

Seattle ground truth. This visual is set up like Figure 7.
Classifying curb ramps
Performance metrics
Across all cities, the random forest model performed much better than the PointCNN in terms of accuracy—88% compared to 56% (see Table 4). The precision on the random forest model was slightly better than the recall because the number of false-positive classifications was slightly smaller than the number of false negatives (89.8% compared to 89.4%). The recall on the PointCNN model classifications is much better than precision (71.9% compared to 59.9%), meaning there were more false-positive than false-negative values.
Classification accuracy.

The PointCNN included information about LiDAR intensity, scan angle, and return number, but there is no way of calculating the importance of each variable. Importance metrics in random forests are generated by calculating each time the variable is responsible for a split or decision in each decision tree. In the random forest, distance to street intersection and distance to street (two closely related variables) were the most important variables (see Table 5). Street intersection was responsible for a split 47% of the time and distance to street 17% of the time. Elevation was the next most important variable (9.6%), followed by distance to landmark (7.1%), and then the aerial image bands.
Variable importance, random forest.

Contextual benchmarking
Triangulation (algorithmic context)
Across all the models, there were eight different combinations of possible results (including the initial ramp label used for training from the municipal open data). Just over half of the points (50.1%) were classified correctly by both models (12.9% all 0 and 37.2% all 1; see Table 6). A truly correct classification of a curb ramp was more common than a true negative. Only 6.1% were classified incorrectly by both models (1.8% all false negative and 4.3% all false positive). The PointCNN model falsely classified almost a quarter of the points as ramp (23.4%) and falsely classified 14.4% as non-ramp—these were points that the random forest model correctly classified. The random forest model classified 5.8% of the points incorrectly when the PointCNN classified them correctly (1.6% FP and 4.2% FN).
Classification results across all models.

Spatial context
The classification accuracy varied widely across cities and models (see Table 7). The average accuracy for the random forest model was 88% across all cities. Arlington (91%), Denver (96%), San Francisco (90%), Seattle (94%), and Spokane (92%) performed better than average. Boston (87%), Indianapolis (74%), Nashville (85%), and Washington DC (85%) performed worse than average. The classification accuracy of the PointCNN model was higher than average in Boston (62%), Denver (67%), Nashville (58%), Spokane (75%), and Washington DC (60%). It was lowest in Arlington (41%), followed by Indianapolis (53%), San Francisco (45%), and Seattle (45%). Since the data are balanced between ramp and non-ramp classes, a model could predict every point as either ramp or non-ramp and achieve better accuracy than Arlington, San Francisco, and Seattle. In summary, Denver and Spokane performed better than average across both models, and Indianapolis performed worse.
Accuracy across models and cities.

Spatial and algorithmic context
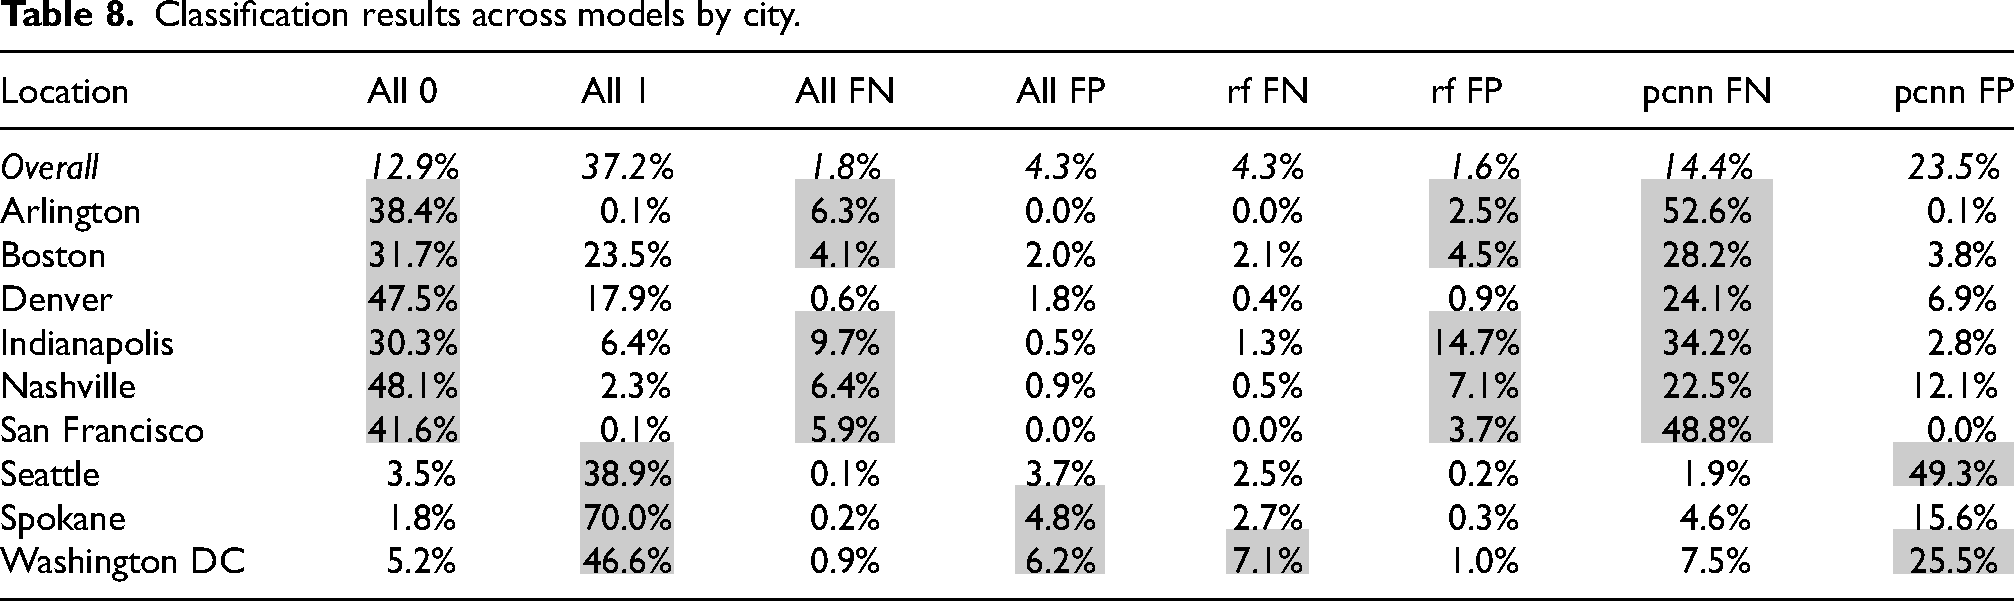
In the same way that accuracy varied by city, the agreement between algorithms also varied across cities (see Table 8). Arlington (38%), Boston (32%), Denver (48%), Indianapolis (30%), Nashville (48%), and San Francisco (42%) had above-average agreement between models on non-ramp classifications (all 0). The remaining cities—Seattle (39%), Spokane (70%), and Washington DC (47%)—had above-average model agreement on positive ramp classification (all 1). All models falsely classified ramp locations as non-ramp (all false negative or FN) more than average in Arlington (6%), Boston (4%), Indianapolis (10%), Nashville (6%), and San Francisco (6%). In Spokane (5%) and Washington DC (6%), a slightly higher proportion of points were falsely labeled as ramps across models (all false positive or FP). The random forest model performed worse than average by falsely labeling ramp points as ramps (rf FN) in Washington DC (7%). On average, 2% of the points were falsely classified as ramps by only the random forest model—this was higher in Arlington (3%), Boston (5%), Indianapolis (15%), Nashville (7%), and San Francisco (4%). The performance of the PointCNN in false-negative and false-positive classifications was widely varying across cities. The rate of false-negative classifications was higher in Arlington (53%), Boston (28%), Denver (24%), Indianapolis (34%), Nashville (23%), and San Francisco (49%). The number of false-positive classifications by the PointCNN was nearly double average in Seattle (49%) and slightly higher than average in Washington DC (26%).
Classification results across models by city.
Discussion
The results of this study confirm that machine learning algorithms are generally good at learning classifications. The random forest model was more accurate than the deep learning PointCNN model at curb ramp classification in this context. 8 The random forest classified ramp locations with 88% accuracy, and the PointCNN achieved only 56% accuracy. The PointCNN model's classifications were only slightly better than assigning every point as a ramp. This is a surprising result because PointCNN is a spatially aware machine learning model and tends to be better suited for spatial applications such as this. The results also show how machine learning algorithms exhibit bias or systematic error. In this case, the system underlying the error is not immediately apparent.
These models likely differed in performance in part because they had different information to learn from. The random forest model had information about streets and intersections, which proved to be important variables for random forest decisions or splits. Distance to street intersection accounted for 47% of the random forest decisions, and distance to street accounted for 17%.
Predictable design
The importance of street design in what the random forest learned about classifying curb ramps is also apparent by looking at maps of the cities that performed best compared to others. The classification accuracy in Denver was 96%—the city, or at least the portion of the city used for training and validation is almost perfectly gridded (see Figure 5). The random forest also performed better than average in Seattle, Spokane, Arlington, and San Francisco. These cities are less perfectly gridded than Denver but certainly more than Washington DC, Nashville, Boston, or Indianapolis.
While this result seems obvious—machine learning was better at prediction in municipalities with predictable or uniform design—the implications are important. If AI only works on cases that are similar, predictable, and dominant, this has serious social implications for human uniqueness, variability, and individuality. Disability scholars have long pointed to the harmful effects of categories like “normal” and “abnormal” (Goggin et al., 2017; Saltes, 2013; Shakespeare, 2007). AI further produces and reflects a normative vision of the world—where outliers are at best ignored and at worst disadvantaged.
Nuance
In Denver, the random forest produced 167 false-positive predictions and 62 false-negative predictions (2.7% and 1.0% of the city's validation points, respectively). Figure 6 shows a few of the outliers that were not correctly classified in the random forest model. In gray are areas where the random forest incorrectly classified points as ramp (a and c in Figure 6). In image a, it appears that the location is misaligned to where there is a ramp (see image a.1), and rather located at the path from someone's house (see image a.2). This path has most of the characteristics of a curb ramp but no gradual slope which makes it not functionally a curb ramp. It appears that the random forest classified the part that is like a ramp as a curb ramp and the edge where there is no transition as non-ramp (see green area of the hexagon in quadrant a). Functionally, a location that is almost a ramp in this way is missing the key functionality—transition from a higher to lower path. Location c points to a location where there is a ramp, but it appears to be misaligned in the data. Quadrant b in Figure 6 is a location with a ramp that was labeled by all models as non-ramp. This could be because it looks different than a typical ramp with the parallel dips running down the slope. Quadrant d is the most interesting for considering outliers. These locations were labeled falsely by all models as non-ramp. However, the area to the left is similar to quadrant a.2, in that it has all the characteristics of a ramp, but no transition to the street—it is just a path to the curb. Like a.2, this location should not be classified as a ramp because it is functionally not adequate. The hexagon area to the right in quadrant d is functionally a curb ramp but transitions very gradually and ends in a kind of gravel surface.
In Arlington, the behavior of the PointCNN model is the most surprising and appears to have influenced the above-average rate of agreement on non-ramp classifications and above-average all false-negative predictions. Figure 7 shows five locations where points were labeled falsely as non-ramps (green hexagons). Locations a, b, and e are all pedestrian curb ramps with red warning material. These ramps feed into a crosswalk and appear to have gradual elevation changes from sidewalk into the street. There is a very small portion of location e that was falsely labeled as non-ramp by the random forest (gray). In this case, the random forest was likely correct in the classification (recall that representing a ramp as a hexagon is not a perfect choice, but one made under the data and algorithm constraints). Locations d and c are slightly more difficult. Location d is a connector between streets and pedestrian pathways; however, it does not have an elevation change. The areas in purple mean that both models labeled the area as non-ramp. That the random forest labeled any points in that location as non-ramp is surprising; perhaps it picked up the warning material color or proximity to the street intersection. Location c appears to be misaligned; however, like location d, the points that the random forest model labeled as ramp (green) do not make a lot of sense visually unless the model was picking up the brightness of the crosswalk. These results are interesting because they suggest a disconnection between what a pedestrian curb ramp is by definition and function. Further, ramps a, b, e, and c all have similar design characteristics (red warning material, gradual slope change) so it is unclear why the random forest was correct about locations a, b, and e but mostly incorrect on c. This location is an outlier in some way that is not visually apparent.
In contrast to Arlington, in Seattle, the rate of false-positive classifications from the PointCNN model alone (pcnn FP) is much higher than average (49% of points). In Figure 8, the orange areas (a, c, and d) mostly had agreement between models in correctly identifying ramp locations. Those ramps are slightly weathered but have distinct transitions from flares to landing. Location e was falsely labeled as a ramp by the PointCNN, and location b was falsely labeled by both models (pink). These locations are not ramps, but narrow driveways that gradually change in elevation toward the street. Narrow driveways are a quite common feature in Seattle's design. These locations could functionally be used by people with disabilities as curb ramps but might be less safe because of the likelihood of cars entering and exiting. Recall, machine learning algorithms look for features that are most like each other. In this case, narrow driveways fit the “normal” characteristics of a curb ramp and are functionally like pedestrian curb ramps. At the same time, they could be more dangerous because their use will be shared with automobiles.
These results reveal the diversity of model error. It is more difficult to pinpoint the systematic nature of this error or bias. Machine learning is an excellent tool for classification and prediction. It can achieve accuracy and process large data far better than any human. These tools also make systematic errors which are likely to disproportionately affect categories of people, and there is a rich body of work on addressing bias (see, for example, Crawford 2017; Friedman and Nissenbaum 1996; Eubanks 2018). But another, equally pernicious kind of error cannot just be calculated out or benchmarked. This kind of error, the kind of error that led to the death of Elaine Herzberg and the stalled mobility of Haben Girma and Emily Ackerman, cannot be solved with computation nor code but requires the slow and messy human work of observation, description, and contextualization to unravel.
Conclusion
This case focused on classifying curb ramps, an infrastructural feature that is particularly important to the safe travel of people with disabilities and which has improved the lives of many others (e.g., people walking with children in strollers). This case illuminates much more. That is, not only the risk of people with disabilities to be alienated from urban life (Attoh, 2011; Lefebvre, 1992), but the risk posed to any person or event that is an outlier. We might even go further to say that in the smart city data (i.e., people and events) that violates algorithmic norms will either be tamed or otherwise face exclusion (Bowker and Star, 2000).
Notions of normality have long been tied to power and dominance at the exclusion of people with disabilities. Machine learning is simply faster and more efficient at categorizing and identifying normality. This means that anyone who falls outside of the norm—who is an outlier in statistical terms based on how and what environmental features they require for access—is likely to experience unforeseen harm. As scholar Jutta Treviranus recounted of her tinkering with autonomous vehicle models, “When I presented a capture of my friend to the learning models, they all chose to run her over…I was told that the learning models were immature models that were not yet smart enough to recognize people in wheelchairs…When I came back to test out the smarter models they ran her over with greater confidence” (Whittaker et al., 2019: 12). Behind the scenes, the model was likely trained to recognize wheelchair riders as pedestrians, but even then, it would learn a “normal” or average profile of a wheelchair rider. What then of the safety of a wheelchair rider with glow sticks on their wheels and a cat in their lap? These kinds of outliers and exceptions cannot be coded in.
There is a glut of work and reporting revealing bias in AI and proposing solutions, but bias itself is socially constructed, contextual, and varying. Who gets to decide what is fair and who benefits? Even if we were to agree on what bias is, under what conditions does it exist? And as these results highlight, what happens when the bias is bias toward a heterogeneous group such as people with disabilities? Importantly, these outliers represent lives at stake, not simply observations in a dataset. I propose that, to address this kind of error or bias, we need to look to qualitative methodologies. To rephrase, what AI needs is descriptions and interpretations in context. In this paper, I have made a first attempt at this kind of description through ground-truthing model error.
In the context of these results, I return to the questions, what kind of world do we want to live in? And who has the right to the city? Failing to think critically about these questions means that dominant narratives or imaginaries win the day. As Jasanoff and Kim write, “[w]hat we ‘see’ in familiar surroundings looks right, epistemically as well as normatively. So the socially conditioned eye can take for granted that all-male orchestras or all-black passengers on the backseats of buses, or even scenes of filth and abject poverty simply represent the rightful order of things” (2015: 14). As Turnbull writes, “[i]n the long run, social and cultural complexity cannot be winnowed away; it's all there is” (2003: 227). Valuing outliers is not the domain of AI, but I argue that we can still mobilize the power of machine learning if we also work to value exception and outliers through qualitative approaches. What I am suggesting here is inclusive design for the smart city (Treviranus, 2018, 2021).
Inclusive design for the smart city would shake up our imaginary about what technology can do and what we would like it to. It would ask different more specific questions based on the needs and desires of the outer rim—where are the curb ramps? Where are the quiet places? What do the unhoused need? Imagine traffic algorithms that prioritized the needs of everyone except cars or facial recognition software that just failed on white faces with goatees? Imagine policing algorithms that disproportionately arrested and locked up people wearing expensive ties? I am not advocating for those futures but rather thought experiments that move the horizon of what is possible to the outer rim and the acceptable harms to those with power. This is a different kind of imaginary about what technology can do and what we would like it to do. This work is hard and slow. It requires open eyes, reflexivity, and wading through messes of big data, but to fail to try to contextualize and understand AI is to fail to take responsibility for shaping the world we live in.
Footnotes
Declaration of conflicting interests
The author declared no potential conflicts of interest with respect to the research, authorship, and/or publication of this article.
Funding
The author disclosed receipt of the following financial support for the research, authorship, and/or publication of this article: This work was supported by the National Institute for Transportation and Communities (grant number NITC 16 Dissertation Fellowships 2020, #1374).