
Abstract
Poor air quality is a pressing global challenge contributing to adverse health impacts around the world. In the past decade, there has been a rapid proliferation of air quality information delivered via sensors, apps, websites or other media channels in near real-time and at increasingly localized geographic scales. This paper explores the growing emphasis on self-monitoring and digital platforms to supply informational interventions for reducing pollution exposures and improving health outcomes at the individual level. It presents a technological case study that characterizes emerging air quality information communication mechanisms, or ‘AQ channels’, while drawing upon examples throughout the literature. The questions are posed: which air quality channels are ‘freely’ available to individuals in London, UK, and when and where are they accessed? Digital trace data and metadata associated with 54 air quality channels are synthesized narratively and graphically. Results reveal air quality channels derive air pollution estimates using common data sources, display disparate messaging, adopt variable geographic scales for reporting ‘readings’ and maintain psychosocial barriers to access and adoption of exposure-reducing behaviours. The results also point to a clear association between the publication of a high-profile news article about air pollution and increased air quality channel access. These findings illuminate a need for greater transparency around how air quality channels generate personalized air pollution exposure estimates and tailor messaging. The paper concludes by calling for air quality channel developers to exercise co-creative methods that can support sustainable, democratic data and knowledge production around air quality, while critically approaching disproportionate patterns of both pollution and information exposure.
Keywords
Introduction
This paper characterizes the landscape and features of a new paradigm of digitally enabled information designed to present air quality (AQ) conditions in real time at local or individual levels. It introduces the term: air quality information channels, or ‘AQ channel’ as a label that encompasses proliferating Internet-enabled AQ information sources. AQ channels can blend personal information like geolocation, age and presence of pre-existing health conditions, alongside real-time AQ estimates, to provide tailored recommendations for reducing exposure to pollution (di Bella et al., 2018). Air pollution causes the equivalent of 28,000–36,000 deaths in the UK each year, with the burden disproportionately falling on more vulnerable groups throughout the population (PHE, 2018). Research reinforces that AQ channels may reduce burdens of adverse health outcomes via informational interventions which can contribute to the widespread adoption of exposure-reducing behaviours (ERBs) during high pollution events (D’Antoni et al., 2017; Kelly et al., 2012; Neidell & Kinney, 2010; Rappold et al., 2014). As AQ channels and other individual-level digital health interventions become increasingly prevalent, it is important to examine how patterns of access and information delivery can alleviate this burden, for which portions of the population, and whether air pollution exposure inequality is maintained or possibly exacerbated (Gabrys et al., 2016; Neff & Nafus, 2016). This prompts the questions: which AQ channels are freely available to individuals, and when and where are they accessed?
This paper presents a literature review chronicling the development of the AQ channel innovation and a technology review of a sample of channels available to individuals in London, UK. London was selected based on its standing as a major international city with high population density, consistent evidence of disproportionate air pollution exposures, major health and social inequality and availability of additional socio-demographic datasets for analysis of patterns of access to AQ channels (Fecht et al., 2015; Rivas et al., 2017). A lack of linked demographic datasets associated with specific AQ channel use limits this paper from generating granular insights into who in a population engages with AQ channels and what motivates such engagement. Instead, it explores the uptake of AQ channels through the ‘diffusion of innovations’ theoretical framework proposed by Rogers, while adopting digital trace data as a unit for quantifying the broad uptake of AQ channels in London, UK. Diffusion is understood here as ‘the process by which an innovation is communicated through certain channels over time among the members of a social system’ (Rogers, 1995). This study focuses on AQ channels – a hybrid of AQ information or data and the communication mechanisms by which it diffuses through a population. Existing literature is referenced to show how AQ channels emerged, their characteristics, and how they have ‘diffused’ throughout population groups.
Digital trace data and metadata are units of analysis ‘produced as a part of social life’ throughout interactions with digital technologies (Marres, 2017; Ruppert et al., 2015). They were derived through the technology review process, which included web and app store searches to identify AQ channels accessible to individuals in London at no additional cost (beyond device ownership) and manually harvesting metadata, as well as acquiring additional, more spatially and temporally granular user analytics data from certain AQ channel providers. Questions surrounding what it means for a channel to be truly ‘free’ or ‘open access’, alongside whether ‘digital inequality’ may be exacerbating existing health and environmental inequalities rather than democratizing protective action against air pollution, are examined in greater detail throughout this paper (Cruz, 2020; Hargittai, 2010). The following sections outline why studying AQ channels is important for understating air pollution inequality, as a function of both access to information and associated downstream exposure-reducing practices.
Background
Origins of AQ channels: Pollution monitoring, modelling and data generation
AQ channels are technological descendants of historic air pollution monitoring, modelling and communication mechanisms. Over the 20th century, technologies were standardized to collect policy-relevant data so that governments could build knowledge about air pollution concentrations. This occurred in response to pressures from government authorities for simple, low cost ‘robust and reliable’ methods to deliver ‘uniform measurements that could be widely reproduced’ (Mosley, 2009). A ‘metrological regime’ was devised, informing the design and production of monitoring instruments for rendering air pollution politically visible and governable (Barry, 2002). The digital revolution drove advances in monitoring practices resulting in increased frequency at which air pollution data was collected and communicated by local authorities to central government. 1 This marked a transition whereby access to air pollution information was extended beyond government actors and made directly available to the public 2 (Bickerstaff & Walker, 2001 and Gould, 1995).
Air pollution modelling also expanded access to AQ information during the 20th and 21st centuries. Multinational and multi-institutional enterprises 3 that have been in place since the 1970s draw on a variety of land-based and satellite datasets to deliver publicly available data on concentrations for different pollutants at the mesoscale (1–12km2) and at hourly intervals (Simpson et al., 2012). More recently, a method known as ‘nowcasting’ has gained traction. It uses historical data trends for pollution concentrations and weather patterns, among other data sources, to generate statistical, predictive models or ‘nowcast’ AQ conditions in ‘real-time’ (Browning & Collier, 1989). One example of nowcasting is Imperial College London Environmental Research Group's (ERG) employment of the CMAQ-Urban model to oversee hourly AQ conditions across London at a geographic resolution of 20m2, alongside regulatory data gathered across the London Air Quality Network (LAQN). Another trend facilitating access to air pollution information are application programming interfaces (APIs). APIs enable data to be piped into other applications, ranging from publicly available AQ channels, vehicle displays and mobile apps developed by companies or large-scale urban planning initiatives (Breezometer, 2021).
Modelling and sensing practices have advanced over the past two decades alongside growing computational capacity, miniaturization and machine learning, further expanding opportunities for information access (Snyder et al., 2013). In this study, a ‘sensor’ is a lower-cost technological instrument that measures multiple pollutants simultaneously (∼£50–7000) compared with more expensive regulatory monitors that generate data for specific pollutants at latitude–longitude point locations (Morawska et al., 2018). Commercially available sensors produce air pollution data of variable quality due to a host of factors, including sophistication of instrumentation; quality of temperature and humidity sensors, and measurement averaging times (average number of readings per second, per minute); which pollutants they measure, spatial resolution, lack of adjustment for meteorological conditions and many additional features (Woodall et al., 2017). California's South Coast Air Quality Monitoring District (SCAQMD) in the United States compiles systematic field and laboratory assessments of commercially available sensors’ accuracy, precision and bias. Assessments are publicly available via Air Quality Sensor Performance Evaluation (AQ-SPEC) web platform (SCAQMD, 2021). The commercialization of air sensors, and how this affects access to AQ information, warrants further investigation.
Regulatory pollution limits vary across countries and underpin what constitutes as legally actionable evidence of air pollution, reinforcing notions of AQ being synonymous with the specified pollutants, monitoring methods and acceptable concentration thresholds (COMEAP, 2010; Garnett, 2016). Evolving mobile sensing technology continues to disrupt the exposure monitoring and health effects evaluation space, pointing to how data generation practices render pollution a barometric ‘technology’ for evidencing acceptable environmental states and guiding parameters for change (Gabrys, 2020). Furthermore, the World Health Organization (WHO) recently released stricter air pollution exposure guidelines for nitrogen dioxide (NO2), particulate matter (PM), sulphur dioxide (SO2) and ozone (O3) and NO2 (WHO, 2021). This elevates questions about the types of air pollution information and messaging individuals can access via ‘open’ AQ channels, how individuals are encouraged to respond to this information, and whether access is uniform across populations.
Contemporary AQ channel characteristics: Messaging and access
Messaging
This section presents the limited literature surrounding message construction and how it can inform patterns of access to AQ channels and adoption of ERBs. Existing literature focuses on channels tailored for research purposes, as opposed to commercial AQ channels. Examples include an adaptation of Imperial ERG's CityAir app, U.S. EPA's Smoke Sense app, AirForU app by the University of California Los Angeles and the University of Tasmania's AirRater app. Samples of individuals in these studies demonstrated certain biases, with approximately half of participants possessing pre-existing health conditions, and individuals with University degree level education or above, as well as White individuals, being overrepresented in the Smoke Sense and CityAir studies (D'Antoni et al., 2019, Johnston et al., 2018; Rappold et al., 2019).
Literature identifying characteristics of messaging across non-research AQ channels is limited. The ‘Air Quality Index’ (AQI) is a common format for delivering targeted messages encouraging ERBs (D’Antoni et al., 2017). An AQI is an informational tool for providing health messaging according to specific pollution thresholds (Ruggieri & Plaia, 2012). AQIs are calculated according to the highest registered concentration of key pollutants over a set geographic area and vary by reporting organization or state institution, as do threshold levels or colour-coded ‘bands’ (Figure 1) (Woodall et al., 2017). ERBs also vary across AQIs, with the most common examples including the U.S. EPA's AQI, the UK's Daily AQI (DAQI) and the European Union's Common AQI (CAQI).

Format of air quality index (AQI) delivered by the UK Defra and format delivered by the U.S. EPA.
Language across DAQI messaging identifies ‘at-risk’ individuals as adults or children with heart or lung problems. This ‘at-risk’ classification doesn’t incorporate mounting evidence of socio-demographic and spatiotemporal factors contributing to increased vulnerability including place of residence, work or school; characteristics of commute; socio-economic status, race and ethnicity; pregnancy and age (Aether, 2017; Kim & Kwan, 2021; Koman et al., 2018). The tendency towards standardization at the expense of incorporating situated context throughout AQ messaging has been addressed across Science, Technology and Society (STS) and critical social theory research (Gabrys et al., 2016; Haraway, 1988), while challenging whether predominantly scientific, sterile representations of AQ are most effective at making air pollution visible or actionable from a personal, non-technical standpoint (Barry, 2002; Whatmore, 2006). Furthermore, it raises questions about how this affects access to and engagement with AQ channels, and whether certain population groups are alienated.
The focus of AQ channel experiments on ‘at-risk’ individuals prompts consideration of the relationship between definition of risk, risk perception and AQ channel uptake. Evidence points to ‘risk perception’ being a function of local, situated knowledge, involving daily experiences, sensations and social-cultural factors (Bickerstaff & Walker, 2001; Brody et al., 2008; D’Antoni et al., 2019; Elliott et al., 1999). D’Antoni's study, Smoke Sense and AirForU confirmed increased levels of engagement with both ERBs and the AQ channel by individuals with pre-existing conditions, particularly after experiencing intrinsic, physical symptoms (Delmas & Kohli, 2019; Johnston et al., 2018; Rappold et al., 2019). Extrinsic factors, such as notifications or messages, and environmental incidents like high pollution wildfire events have also been shown to increase AQ channel access (Johnston et al., 2018; Rappold et al., 2019). This helps focus attention on how AQ channel messaging conceptualizes risk, and how the interplay of intrinsic and extrinsic factors informs who accesses AQ channels.
Each AQ channel reviewed delivered pre-crafted messages, mirroring existing models of AQI information delivery. The AQI is designed according to the ‘deficit model’, that is, the notion that providing more, ‘factual’ information, will eliminate scepticism or translate into the adoption of certain pro-environmental behaviours (Hart & Nisbet, 2012). This model is commonplace across environmental science and health communication endeavours. It is critiqued, particularly within the context of climate change, for misrepresenting the complex nature of knowledge production and behaviour change (Moser & Dilling, 2009). The theory of co-production reinforces how knowledge is a product of interactions across society, science and technology (Jasanoff, 2004; Whatmore, 2006). Reviewing AQ channels supports understandings of how individuals interact with these infrastructures alongside other situated, embodied experiences, and how this informs the co-production of information and knowledge about AQ.
Participatory approaches such as ‘citizen science’ that involve non-technical or ‘lay’ individuals through experimental practice have been proposed to further democratize knowledge, information and data-generation surrounding environmental challenges (Lave, 2015). Examples of endeavours across London demonstrating participatory elements include the Citizen Sense ‘Dust Box’, the SmartCitizen sensing kit, and the second phase of the Breathe London project. These examples, along with several others identifying as participatory, ‘citizen science’ or ‘do-it-yourself’ (DIY) projects, involve the design and deployment personal sensors to co-create air pollution data (Pritchard et al., 2018). Participation and knowledge co-creation occurs in varying degrees, and certain projects may only involve non-technical participants at specific, convenient stages of the research process to maintain control over how results are produced and communicated (Lezaun & Soneryd, 2007). While some of the participatory sensing projects reviewed here also deliver a publicly accessible AQ channel, not all of them provide widespread, real or near real-time access to air pollution data, therefore falling outside of the scope of this study. This study proposes a framework focusing on patterns of access to AQ information, how this affects diverse participation and co-production of knowledge about air pollution, and ultimately how this can translate into ERBs.
Access
This section explores mechanisms contributing to AQ channel access, paying close attention to the notion of ‘digital or informational inequality’. Spaces where individuals interact with AQ channels include websites, smartphone apps, public digital ‘billboard’ displays, television, newspapers and radio broadcasts, varying by city and country. For example, in addition to digitally available sources, the U.S. EPA's AQ channel is shared via local weather channels, radio and newspapers (D’Antoni et al., 2017). The UK DAQI is communicated on television or radio when there is an ‘exceptional’ pollution event. When pollution concentrations exceed the moderate DAQI range, certain cities including London will broadcast readings and health messaging across Transport for London (TfL) digital displays located at bus and ‘Tube’ stops (COMEAP, 2010). Broadly speaking, AQ channels are delivered by government authorities, academic groups or commercial enterprises selling personal pollution sensors. Increasingly, air pollution information is communicated via social media platforms. Aside from Twitter, communication of AQ information via social media, as well as ‘smart home’ devices such as Amazon's ‘Alexa’ or ‘Nest’, are beyond the scope of this study.
The most recent UK Office of National Statistics (ONS) survey on Internet and computer use (2014) showed that 94% of London residents have access to the Internet at home and 74% have Internet-connected mobile devices (London Datastore, 2021). A 2019 Global Action Plan (GAP) survey found that when asked where individuals would like to find information about air pollution, ‘the internet’ was ranked highest, followed by TV and radio adverts (n = 262) (Global Action Plan, 2021). The following paragraphs review factors contributing to unequal access to, and subsequent uptake of Internet-based innovations, along with how studying AQ channels can supply important insights into processes of digitally mediated exposure inequality.
Notions of digital inequality, or the ‘digital divide’ are intertwined with systemic socio-demographic inequalities. Three levels have been identified across the literature: discrepancies in ‘access to and quality of Internet’; digital literacy or skills; and different manners of engaging with digital technologies, including privacy concerns (Bol et al., 2018; Dimaggio & Hargittai, 2001; Hargittai, 2010; Scheerder et al., 2017; van Deursen & Helsper, 2015; van Deursen & van Dijk, 2014; Van Dijk & Hacker, 2003). In research focussing on the Internet-based encyclopaedia, Wikipedia, Shaw and Hargiatti approach online participation in terms of a ‘pipeline’ by modelling awareness and behaviour conducive to becoming involved in the production and proliferation of information (Figure 2) (Shaw & Hargittai, 2018).
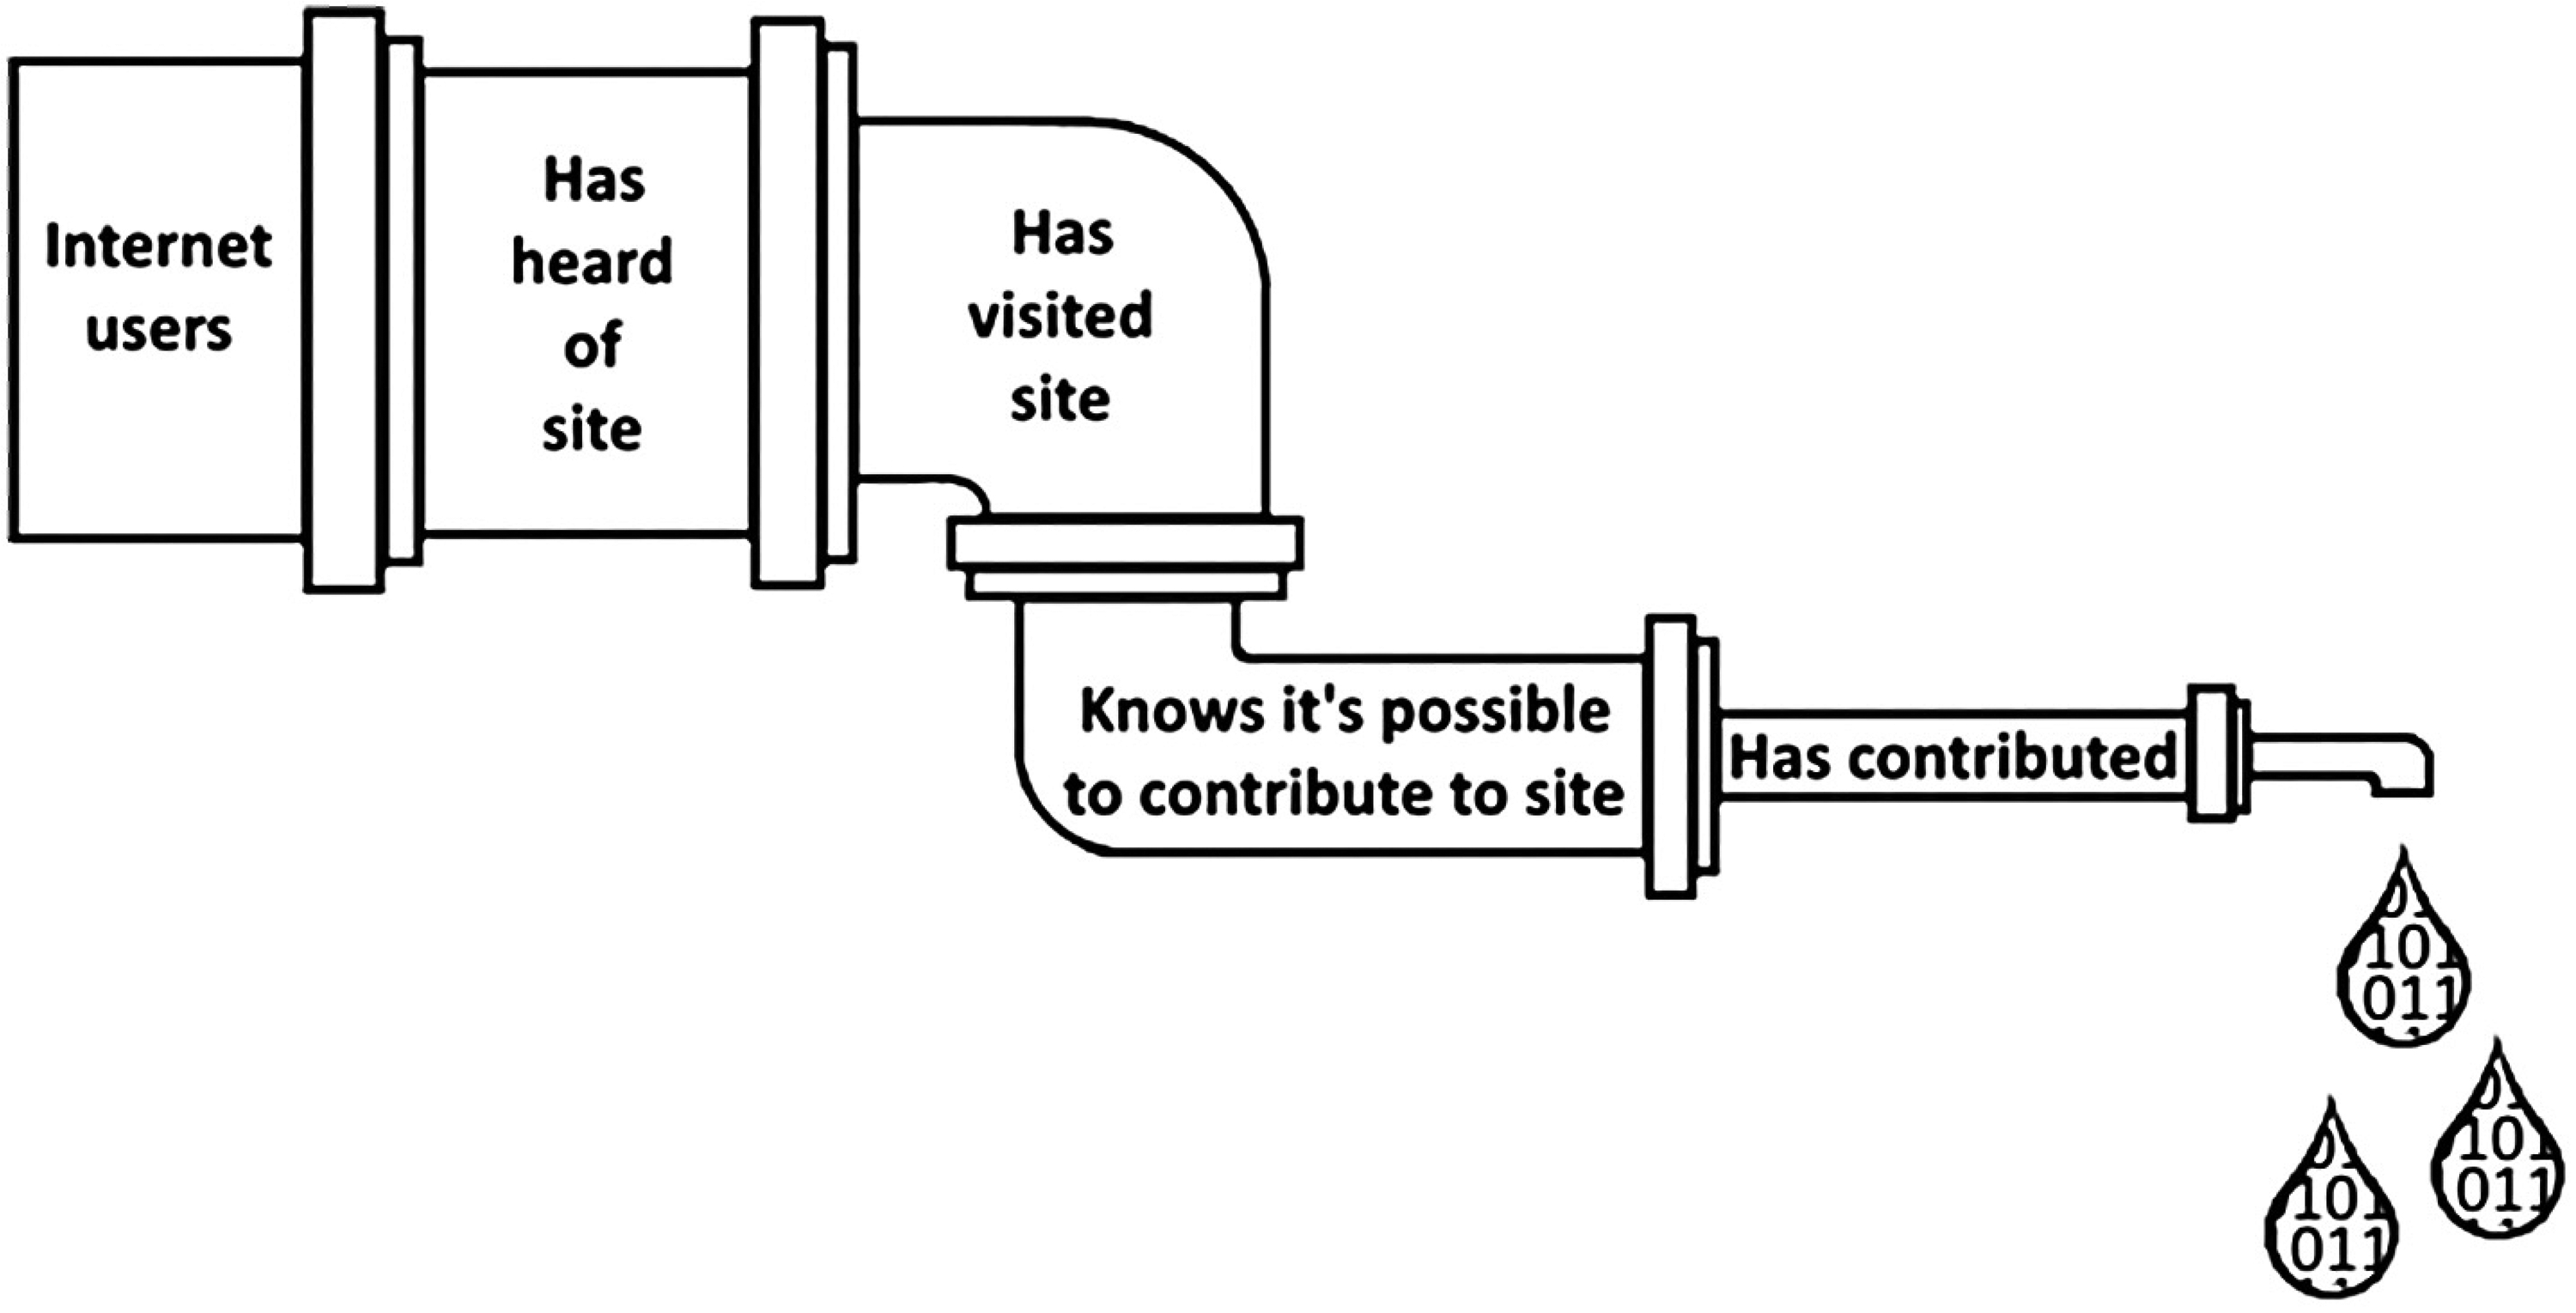
‘Pipeline of online participation’ (Shaw and Hargittai, 2018).
Like Wikipedia, most freely available AQ channels require Internet access and a level of participation or engagement for individuals to arrive at that final stage of ‘implementation’ or ‘confirmation’ described in diffusion of innovations theory. Rogers defines a model for the ‘innovation-decision process’ that traces individuals through the process of learning about an innovation and whether they ultimately implement and reinforce ideas or practices put forth by said innovation in their lives (Rogers, 1995: 169). Acknowledging digital and information inequalities are likely to exist, it is necessary to consider how AQ channels may ‘shape or magnify biases in judgement or processes of societal discrimination occurring in the form of ERBs being selectively adopted by groups in a population (Neff et al., 2017:90).
Alongside proliferating Internet-connected technologies, there has been a deluge of big ‘digital trace’ data (Marres, 2017). Digital trace data is being repurposed across the fields of communication studies, demography and computational social sciences to further research on previously unobservable processes and associated socio-demographic patterns (Alburez-Gutierrez et al., 2019). This form of ‘transactional’ data has yet to be considered as an approach towards empirical research aimed at understanding who interacts with AQ channels, what motivates such interactions, and whether exposures can be reduced. The different ways individuals can interact with AQ channel infrastructure has yet to be characterized in the literature, reinforcing a gap in understanding around whether access and engagement are continuous and consistent over time, or intermittent, and how this might contribute to ERBs.
While AQ channel trace data presents a promising opportunity to examine artefacts of patterns of interaction with AQ information, specific ethical and interpretive issues warrant careful methodological consideration (Amoore, 2011; Kitchin, 2014; Neff et al., 2017). These ethical issues are encapsulated in Bowker's statement: ‘Raw data is both an oxymoron and a bad idea; to the contrary, data should be cooked with care’ (Bowker, 2005: 184). Roger's concept of ‘selective exposure’ is taken up in this study, reinforcing how digital trace data associated with AQ channel uptake can be biased towards patterns and characteristics of ‘early adopters’ of the innovation (Rogers, 1995). Careful attention is also paid to maintaining the anonymity of channel users, adhering to stipulations of data usage, and critically interpreting user analytics data and metadata as the study examines how technological specifications, messaging characteristics and modes of access contribute to AQ channel uptake patterns across London.
Methods
Overview
To address the first research question, this paper presents a technology review and structured content analysis (SCA) to identify and characterize existing AQ channels ‘freely’ available to individuals in London. To answer the second research question and elucidate patterns of where and when channels are accessed in London, user analytics ‘digital trace’ data are examined from three AQ channel examples associated with the Mayor of London's office, including London Air, AirTEXT and the Breathe London pilot. In the context of this study, with attention to diffusion of innovation theoretical principles, user analytics data serves as a unit to help examine the uptake of the AQ channel innovation. This represents a preliminary investigation of whether there are discernible patterns of access to AQ channels at the population level. The goal is to establish an empirical foundation for further research into what motivates or hinders patterns of access and engagement with AQ channels across different socio-demographic groups, while acknowledging certain groups may be more or less likely to reap potential health benefits associated with specific patterns of access.
Systematic technology review
As demonstrated in the literature review, research discussing AQ channels is sparse due to the novelty of the innovation. This, in addition to a lack of clearly reported, publicly available information on AQ channels patterns of access along with device availability, drove a technology review leveraging online research methods (ORMs). ORMs included constructing search terms to conduct systematic web searches using the Google search engine, as well as across the Apple App and Android Google Play stores. Traditional bibliographic database searches were inappropriate given the novelty of this innovation. The search protocol is described in Appendix 1 to support ‘reproducibility and transparency’ (Briscoe, 2015).
Data selection
The dataset was generated through a combination of web and app store searches in February 2021 according to a clear set of inclusion criteria. Searches included the terms ‘air quality’ or ‘air pollution,’ ‘forecast’ or ‘nowcast,’ and ‘London UK.’ For a complete list of search term permutations, see Appendix 1. Browser IP addresses were manually set to a London location. Results from the search were extrapolated from the first three pages of Google searches for each search term. All AQ apps resulting from the searches were initially retained. The resulting list was refined according to specific criteria to best reflect prominent AQ channels available to individuals in London. These criteria were selected in response to this paper's core research questions, while also aligning with characteristics of AQ channels demonstrating evidence of reducing exposure to air pollution (see Johnston et al., 2018, D’Antoni et al., 2019 and Hano et al., 2020).
To be included in the final dataset, channels had to be accessible without additional charge, aside from Internet device ownership, in alignment with this work's commitment to understand uptake barriers associated with this informational innovation. Channels must provide pollution ‘readings’ at a minimum daily frequency to remain within the scope of the near ‘real-time’ feature of the innovation. Furthermore, channels must possess a user interface displaying an AQ reading in line with the descriptions outlined in the literature review. To maintain focus on access patterns of individuals in London and conduct additional demographic analyses with the available data, channels had to supply ambient readings at the local authority level or below. Metadata was gathered to aid the refining process. Each metadata field was chosen to support insights into the novelty, popularity, messaging characteristics and technological approach for generating pollution estimates adopted across each AQ channel (Figure 3).

Air quality (AQ) channel metadata collection criteria.
The resulting list catalogued AQ channels in the order of highest to lowest access or downloads according to the user analytics data obtained from the channel provider or via Google Play store metadata. The range was between ≥100,000,000 and 1. Channels in the upper third portion, as well as channels specifically catering to London, were retained. Channels for which the search was unable to return a figure indicative of volume of access or downloads were retained only if they specified a connection with the city of London. AQ channels in the final dataset were examined in detail and manually mined for metadata to populate each of the fields listed in Figure 3 with numerical or categorical data where possible. For the three channels involved in the in-depth analysis, additional metadata was gathered to help respond to key research questions on patterns of where and when individuals in access AQ channels. This supported the development of principle summary measures including time series graphs and linear regression modelling.
For the in-depth analysis of patterns of access expressed across three sample AQ channels, AirTEXT provided anonymized datasets on subscribers to the service, and London Air and the Breathe London pilot exported data in CSV file format from the Google Analytics platform from 1 July 2019 to 1 December 2020. This date range represents the entire period during which the Breathe London pilot was operational and the decision was made to examine access to the London Air web platform during the analogous date range for comparability. AirTEXT data represents the entire time the channel was operational. Data were selected based on their availability, status as official AQ channels provided in partnership with the London Mayor's office, and the fine-grained temporal resolution at which the data is recorded.
Methods of analysis
A SCA was conducted to examine characteristics expressed across the final AQ channel dataset. SCA supports the distillation of key technological features to help group examples of an innovation into categories (Elo & Kyngäs, 2008). Results from the manual metadata mining exercise were recorded in labelled columns associated with each specific AQ channel. Metadata was used to generate summary statistics for the year of channel launch, total downloads, mechanism for generating pollution ‘reading’, and ‘messaging’ features for the entire dataset.
Boroughs and outer postcode areas showing highest and lowest access across the AirTEXT channel was examined further. Additional datasets including 2018 London population estimates, 2019 Index of multiple deprivation and most recent annual mean air pollution estimates from 2016 were obtained via the London Datastore. These data, along with user analytics datasets, were combined with shapefiles obtained from the ShareGeo open repository to generate insight into patterns of access alongside demographic factors (e.g. PM2.5, PM10 and NO2) at the borough level using ggplot2 and cowplot in R 1.3.959. A linear model was generated using AirTEXT subscriber data to examine the relationship with mean annual NO2 pollution levels at the outer postcode level. It included coefficients for usual resident population, average income, index of multiple deprivation and the interaction between mean annual NO2 concentration and usual resident population, averaged across the outer postcode level. The 'bmtest' package was used to conduct a Breusch-Pagan test to check for heteroskedasticity.
Results
The systematic technology review resulted in a dataset containing 54 AQ channels (Table 1), refined from a total of 274 (Figure 4). This section presents details about the resulting channels in terms of respective launch dates, platforms of information delivery (website, app, text message, etc.), technical means for generating air pollution estimates or ‘readings’, messaging and accessibility characteristics and volume and patterns of access. The final section on volume and patterns of access focuses on the three AQ channels for which user analytics datasets were obtained. These results help build a picture of openly available, real-time AQ information, along with groups most likely to access with such information and experience ERBs.

PRISMA flow diagram of air quality (AQ) channel identification, screening and inclusion.
Descriptive characteristics of resulting air quality (AQ) channels (n = 54).

API: application programming interface; AQI: air quality index; NO2: nitrogen dioxide; O3: ozone; PM: particulate matter; SO2: sulphur dioxide.
AQ channel platform specifications
The resulting 54 AQ channels were launched between 1995 and 2020. The year presented here indicates when the first platform was launched, or when AQ information was first added to an existing service or platform (Figure 5).

Launch years for 54 resulting air quality (AQ) channels.
A subset of AQ channels supplies their information across multiple platforms, for example, via websites, mobile applications (apps) or APIs. Apps were the most common AQ channel platform, followed by web applications and openly accessible or subscription-based APIs. The lowest number of AQ channels shared their readings through Twitter, followed by voice, email and text messaging. Some of the channels include some platforms that don’t offer AQ information. These platforms were not registered in the dataset (Figure 6).

Dominant platforms and technologies communicating air quality (AQ) information.
Sources of air pollution estimates are shown in Figure 7.

Venn diagram illustrating multiple sources of air quality (AQ) ‘reading’ across AQ channels.
Overall, nowcasted models were the most common method for deriving air pollution estimates (56% of channels). This was followed by a total of 52% channels relying on regulatory monitoring data to deliver air pollution estimates. Of the 35 AQ channels deriving pollution estimates from regulatory monitors or non-regulatory sensors, the majority present pollution estimates derived from AURN or LAQN monitoring stations (80%), followed by PurpleAir sensors (11%), then other personal, commercially available sensors. Three channels display pollution estimates gathered from multiple sensors or monitors, while the rest present estimates from only one type of sensor or monitor, or a combination of one sensor or monitor alongside nowcasted pollution estimates. Several channels enabled individuals to connect or ‘pair’ their personally owned AQ sensor with that channel platform, thus recording and displaying data registered by the sensing device. Most channels connect and display data exclusively for their or their partner's proprietary sensor. AirMatters and Airleif, were exceptions, allowing users to ‘pair’ or sync sensors and display data from various sensor providers including PurpleAir, Luftdaten and Kaiterra.
Pollution modelling and forecasting
Eleven of the 31 nowcast channels rely on proprietary models, specifically those developed by Breezeometer, Plume Labs, IQ Air, WLAB and ClimaCell. While proprietary models may implement government or other common modelling techniques, it was not clear which underlying models were implemented. Seven of the nowcasted channels employ the CMAQ-urban model run by Imperial ERG. Of the remaining 13, 5 derive estimates from the CMAQ model implemented by Ricardo E&E for UK Air (Defra), 6 drawing on ECMWF model outputs from CAMS and EMEP (3 using CAMS explicitly), 1 using the ADMS-urban model and 1 on the AQUM model also implemented by Ricardo E&E (Figure 8).
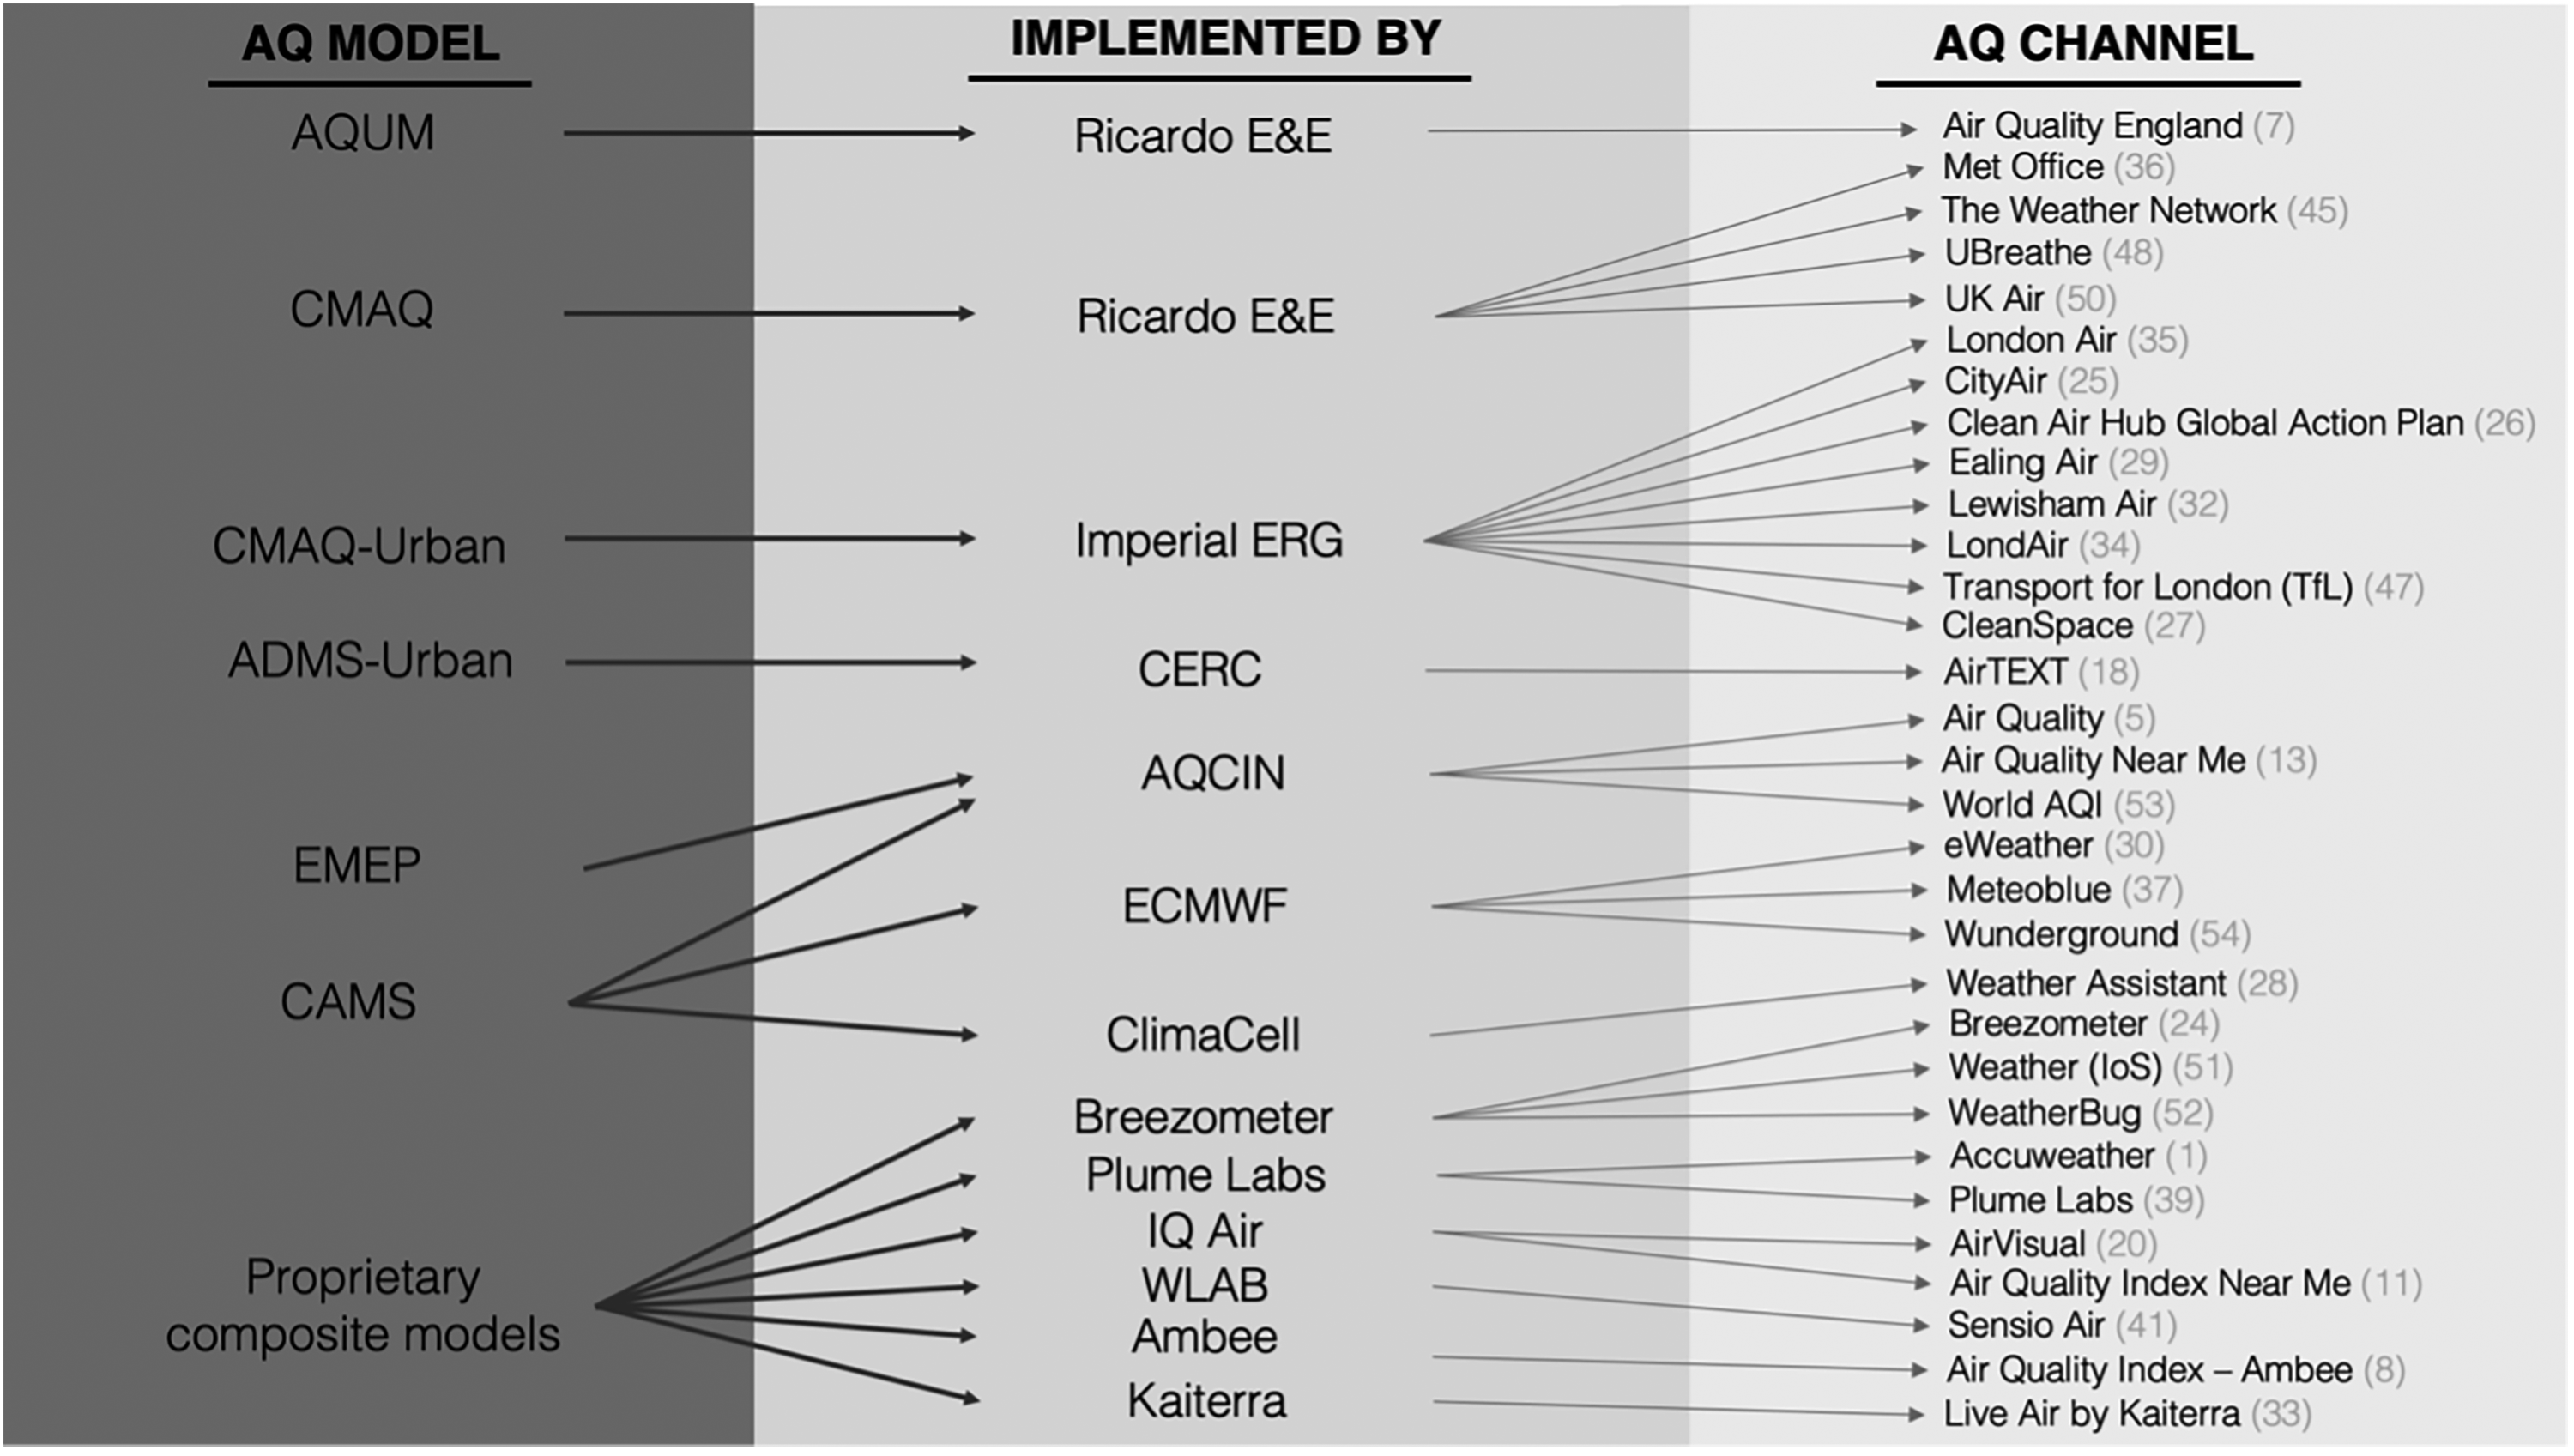
Models generating air pollution estimates across 31 air quality (AQ) channels.
Spatial and temporal resolution of AQ channel pollution estimates
The 33 AQ channels reporting readings derived from monitors and sensors correspond to measurements obtained and averaged over 1–60 min at latitude–longitude point locations. The 29 channels drawing on nowcasted modelling techniques generate estimates of air pollution concentrations projected onto a geospatial grid at varying timescales. The geographic resolution of air pollution nowcast models range from 12km2 to 5m2 (Table 1). Information on geographic projection resolutions for the IQAir, ClimaCell and Sensio Air nowcasting models wasn’t publicly available.
All but four of the 54 channels report air pollution estimates on an hourly basis. While gathering metadata, ‘Air pollution around you’ and eWeather HDF appeared to have AQ reading delays of 3 + hours. AirTEXT delivers a daily text, email or voice message when pollution concentrations enter the DAQI moderate range. One channel relying on smartphone camera equipment to estimate PM10 concentrations delivered its reading immediately. It was unclear the frequency at which pollution estimates were updated for two of the channels (Sensio Air and PurpleAir), however, metadata collection estimates suggested at least daily, thus meeting the study's inclusion criteria. 28 AQ channels provide a forecast of air pollution, ranging from 1 day to 1 week into the future.
Messaging characteristics
Forty nine of the 54 channels present an air pollution ‘reading’ alongside an AQI (Table 2). Twenty eight of the 54 channels provided messaging targeted at specific groups either through the AQ channel interface or AQI description. The most common distinction was between ‘general population’ and ‘at-risk’ individuals, however, only 10 channels defined ‘at risk’. Some of these channels distinguish pregnant women, babies and athletes. Channels developed by Imperial ERG contain messaging specifically geared towards different categories of commuters, such as pedestrians, cyclists and drivers, while also providing advice on how to reduce personal contributions to air pollution. The only channels offering email, voice or text message options are managed by government departments or their subcontractors.
Messaging features of air quality (AQ) channels4.

API: application programming interface; AQI: air quality index.
Access patterns across AQ channel case examples
User analytics data from the London Air website, AirTEXT and Breathe London pilot study generated further insights into patterns of when and where individuals access AQ channels across London. Location of AirTEXT subscribers since the channel's inception in 2007 is presented below in the form of a univariate map and bar graphs, which identify the boroughs showing the highest and lowest levels of access (Figure 9). Colour gradients show the volume of access as a function of the maximum number of visits to AirTEXT. Subscriber metadata indicates 86% have a pre-existing condition, while the greatest number of subscribers were born in the decade of 1970 (see online Supplemental material). A linear regression model estimated with robust robust standard errors indicated that coefficents for mean annual NO2 concentrations in 2016 and usual resident population, both at the outer postcode level, were significantly associated with higher number of subscriptions to the AirTEXT channel (online Supplemental material).
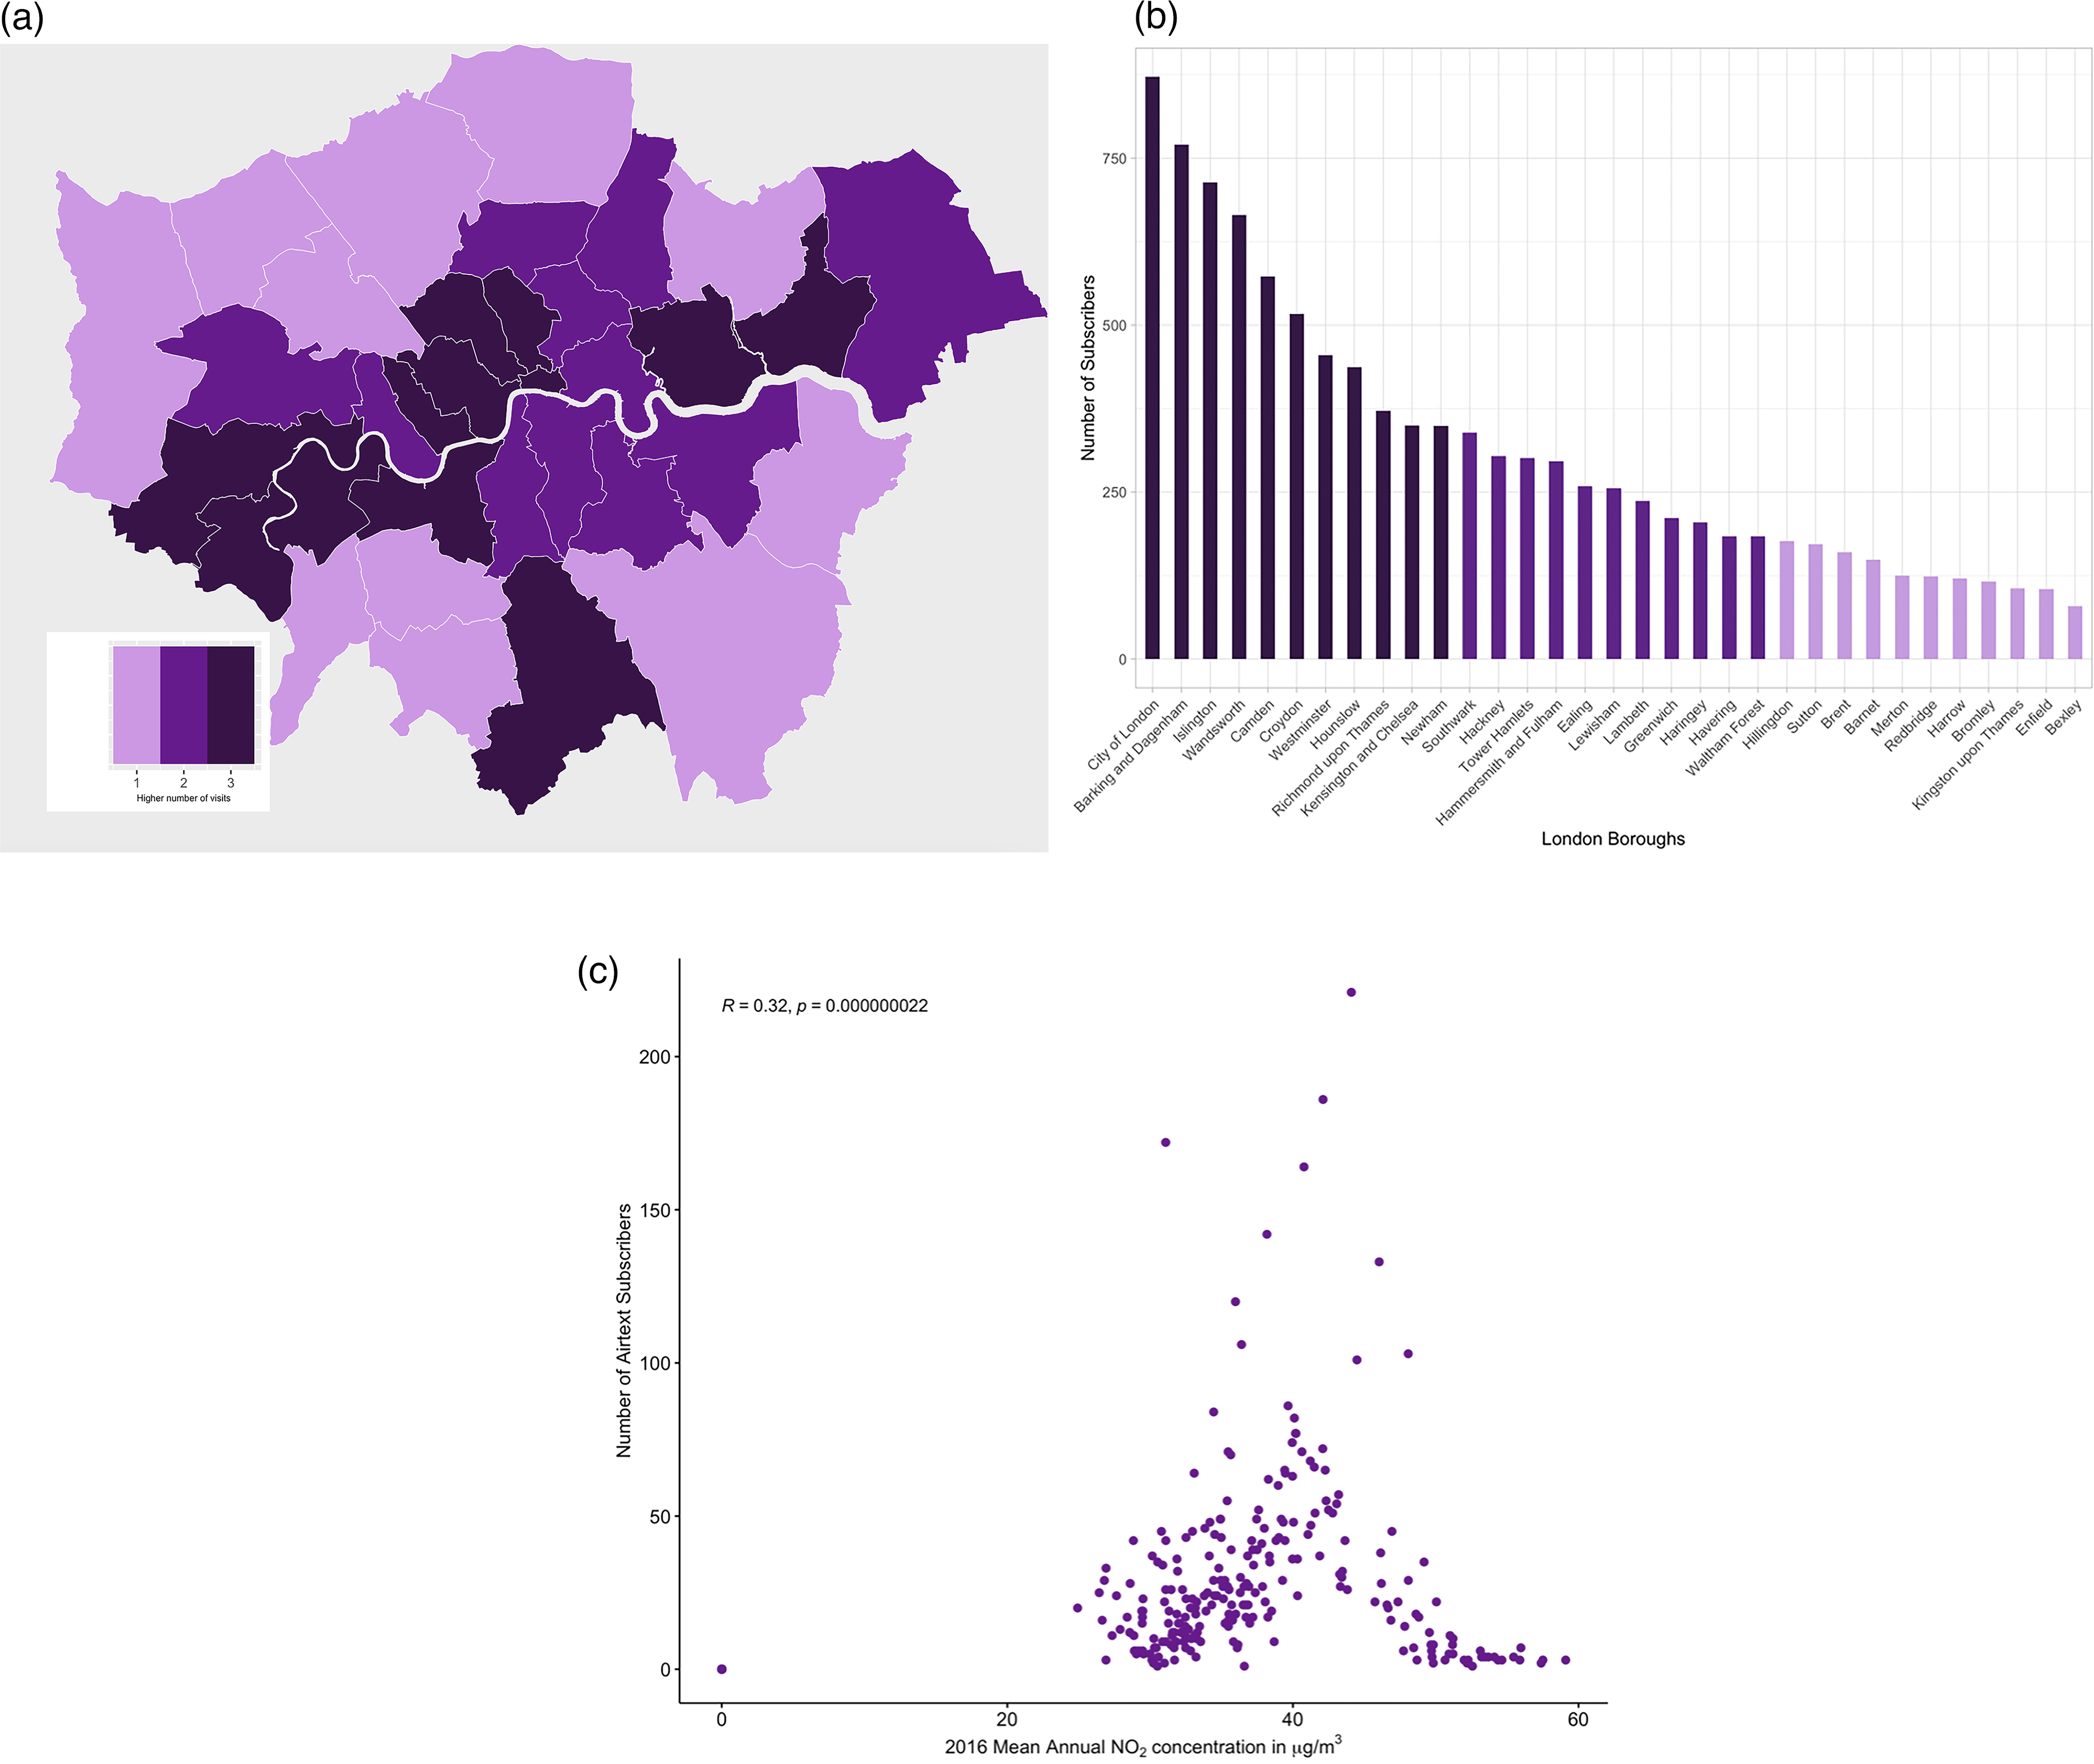
(a) Map of individuals subscribed to AirTEXT at borough level (2007–2020). (b) Bar plot of individuals subscribed to AirTEXT at borough level (2007–2020). (c) Pearson correlation plot showing AirTEXT subscribers and 2016 annual mean nitrogen dioxide (NO2) concentrations in μg/m3 at the London outer postcode level.
User analytics data from the London Air website, Breathe London and AirTEXT were examined for temporal patterns of access. Access to London Air increased between 9:00 and 16:00, peaking at 10:00 (Figure 10(b)). Breathe London access increased from 8:00 to 16:00, peaking at 14:00 (Figure 11(b)). London Air's mean daily access was 669 visits during the sampling period. Weekday mean daily access was higher at 725 visits. Access exceeded 2000 visits on 3 days: 18 and 19 September 2019 and 9 April 2020. Mean daily access to the Breathe London pilot was 136 visits, with higher weekday access at 155 visits. The 3 days with the highest access to the Breathe London pilot platform were 24 July 2019, 19 and 20 October 2020.

(a) Number of unique users visiting London Air from 1 July 2019 to 1 December 2020. (b) Timing of visits on weekdays to London Air.

(a) Number of unique users visiting Breathe London pilot from 1 July 2019 to 1 December 2020. (b). Timing of visits on weekdays to Breathe London pilot.
Discussion
Results from the systematic technology review process reveal patterns of how air pollution estimates are derived and communicated across the 54 AQ channels ‘freely’ available to individuals in London. These channels represent a subset of AQ information communication systems, the limitations of which are discussed in the following section. The three channels where digital trace user analytics data was available were explored in greater depth, focusing on access across the London population. This section discusses the results of the technology review while considering the evolution of the AQ channel paradigm, along with messaging and technological barriers to uptake associated with the innovation. Additionally, it explores the potential for participatory, co-creative methods to address inequality in AQ channel access and throughout AQ knowledge production processes in general.
Limitations
This research is limited to the city of London. AQ channels use has grown in Asia, particularly China and India, where a greater number of individuals are exposed to dangerous concentrations of air pollution (Sun et al., 2017). Further research in these regions is warranted and should involve close partnerships with local institutions. Research design should be harmonized with sociocultural patterns and contexts present in those parts of the world. Additionally, more detailed, socio-demographically linked user analytics data is necessary to uncover whether patterns relating to education, caretaking or personal health bias can be observed at the population level.
Inclusion criteria limited the final list from featuring all AQ channels one could consult in London. One excluded channel was the GLA's coordination of AQ alerts displayed at bus shelters and London Underground stops. This delivery of AQ information and ERB recommendations reaches a diverse portion of the London population. Additional research into what motivates engagement with AQ information and adoption of ERBs in such cases is warranted.
AQ channel diffusion
In response to the first research question regarding what AQ channels are freely available to individuals across London, the results include channels that don’t require additional payment and have demonstrated uptake across the city. The diffusion of innovations theory approaches innovation development as a step-by-step process. Results from this study reinforce how digital innovations aren’t static entities and that the innovation-diffusion process is one of constant iteration and creation. By reviewing the resulting dataset, this section highlights how AQ channels, and the information they perpetuate, are outcomes of co-productive encounters across science, technology and society (Jasanoff, 2004).
The origination of AQ channels in the dataset matches the timeline and trajectory described in the literature review, commencing in 1995 with UK-Air (formerly AEAT). Older AQ channels captured in the dataset (UK Air, AirTEXT, World AQI and London Air) are all government issued apart from World AQI, which also draws directly on government-generated pollution estimates. This aligns with traditional approaches to air pollution data and information standardization, which was disrupted by digital and computational developments throughout the 2000s, resulting in government institutions no longer serving as the exclusive communicators of AQ information. The dataset also demonstrates how AQ channels rely on common data sources for estimating air pollution concentrations. 21 of the 31 channels relying on nowcasted estimates can be reduced to outputs from five models operated by the UK or the European Union. These data generation practices leverage popularized ‘open access’ mechanisms like APIs leading to the syphoning of government-generated pollution data across a growing number of independently operated, commercial AQ channels. While at the foundation, these channels can be linked to common pollution data sources, the subsequent layering of algorithms and proprietary specifications shifts the appearance of the data underpinning the messages they deliver. In the case of channels relying on monitor or nowcast-derived pollution estimates, the user interface may be different, but the ‘insides’ retain standardized elements.
From 2013 onwards, we see multiple AQ channels associated with personal AQ sensors or other commercial products such as masks or air filtration devices. This suggests the commodification of the pollution problem, where pollution exposure is framed as a challenge that can be mitigated by a consumer purchase (Graham, 2015). Another commercial trend is the provision of highly localized, forecasted and nowcasted air pollution estimates via paid subscriptions to APIs (Breezometer, 2021). Similarly, despite not charging a fee, many AQ channels request privileged access to the mobile device system's camera and location services, or to browser cookies, suggesting that data is being gathered, arguably as a form of payment. It is important to consider how narratives of fear and ‘empowerment’ are operationalized across AQ channels to establish a market of concerned individuals that will purchase personal sensors, masks, air filters or accept passive logging of personal data (Crespin and Ferron, 2016). The consequences of marketing AQ channels as ‘open-access’ or ‘empowering’ services, and the role of this driving channel uptake warrants further investigation.
The diffusion of innovations framework considers the definition of ‘problems’ or ‘needs’ as precursors to the creation of an innovation. In the case of AQ channels, and the complex sociopolitical, environmental and health inequity landscape in which they operate, critical attention towards which groups are defining the said problem or need is warranted. The resulting dataset demonstrates a standard series of reported pollutants, common data sources and commercial objectives that underpin the definition of air pollution. Acknowledging that understandings of the air pollution ‘problem’, and AQ channels themselves, are co-produced through interactions with sensing, data handling and display infrastructures, a compelling argument can be made for trialling participatory or co-design methods. Ingenuity surrounding when and how experiences of affected individuals are iterated into an AQ channel could help maximize the equity, relevance and actionability of emergent, co-produced knowledge about air pollution.
Patterns of uptake expressed across the AirTEXT dataset reinforce that uptake of AQ channels is unlikely to be uniform across the population of London (Figure 9). It is also likely individuals adopt ERBs or practices at different rates. The lack of socio-demographically linked data precludes observation of such detailed patterns, and whether they might mirror patterns observed across the controlled experiments presented in the literature review. Furthermore, the availability of commercial products designed to mitigate exposure introduces another layer of inequity regarding patterns of air pollution exposure across a population (Sun et al., 2017). Greater awareness regarding the co-produced nature of knowledge about air pollution, transparency around profit motivations of certain AQ channel ventures, and the inequities such systems perpetuate highlights a need for more democratic approaches to air pollution knowledge building. Trialling theoretically rooted co-design or participatory approaches could help reduce the exploitation of environmental and health risks for financial gains.
Barriers to AQ channel uptake
Messaging barriers
This section discusses how AQ channel messaging results and mechanisms for information delivery contribute to ‘where’ and ‘when’ AQ channels are accessed across London. The U.S. EPA has cited concerns over disparate reporting of AQ conditions, emphasizing it as a function of the instrumentation used to estimate air pollution at the location in question (Woodall et al., 2017). Study results reinforce that AQ ‘readings’ are either tied to the specific location of a monitor or sensor or, in the case of nowcast-derived pollution estimates, associated with a broad or variable geographic area. If individuals are seeking AQ information associated with their exact physical location, most AQ channels are incapable of providing it. Only portable AQ sensors, with questionable accuracy, held by individual users can indicate personal exposure. Furthermore, typical ‘hourly’ reporting standards point to significant temporal gaps in communicating air pollution concentrations. Technical limitations of pollution estimation aren’t communicated transparently by AQ channels and only in some cases embedded in footnotes or ‘Terms and conditions’.
ERB messaging across the dataset is largely standardized to AQI rhetoric. Such messaging perpetuates the unidirectional deficit model, whereby a disconnected entity is the privileged knowledge authority as opposed to the situated, affected individual (Haraway, 1988). This raises questions about whether AQ channels augment or stifle intrinsic knowledge from sensations and ‘lived experience’ of pollution that already exists in the body. It aligns with discussions surrounding the relationship between technology and the human body, and whether such data-driven interactions render phenomena like air pollution more ‘real’ (Whatmore, 2006). While the theory of diffusion of innovations describes communication and knowledge building as a ‘two-way process convergence’, it fails to interrogate the role of sensory cues and the phenomenological dimension of ‘sensemaking’ emerging throughout encounters with innovations (Rogers, 1995: 5 and Fiore-Gartland and Neff, 2015). The results reinforce the potential for future AQ channel iterations to test participatory, sensory-experimental approaches to knowledge building and exchange, as opposed to unidirectional information exchanges.
All but one of the 54 channels presented ‘readings’ alongside AQI messaging which contains embedded ERBs, while many channels included additional messaging targeting specific groups. This messaging is predominantly geared towards groups labelled as ‘sensitive’ or ‘at-risk,’ with specific mention of adults and children with respiratory or cardiovascular conditions, older adults, pregnant women and babies. While some channels present targeted, actionable messages for these groups according to the registered pollution estimate, the majority don’t specify what constitutes a ‘sensitive’ or ‘at-risk’ group or individual. This presents a potential barrier for the uptake of AQ channels and ERBs, further exacerbated by differences in language or sociocultural norms. It is also worth noting that none of the channels included ERBs associated with specific indoor-based activities that might contribute to exposures. This signals an opportunity to establish design features or messaging that supports self-identifying as ‘at-risk’ in multiple languages, thus responding to evidence from the literature that common risk messaging omits certain socio-demographic groups known to be at risk. Such an approach would also operationalize findings from the literature that greater ‘concern’ is associated with increased ERB uptake, while taking care to supply widely actionable recommendations for reducing pollution exposures.
Messaging across the AQ channels reviewed consistently presented numerical air pollution estimates or ‘readings.’ Numerical, sterile representations of environmental phenomena can have a ‘depoliticizing’ or dissociative effect by emphasizing highly scientific, reductionist understandings of air pollution (Barry, 2002). Additionally, pathologizing AQ shrouds the fundamental human experience of breathing in fear, while scientific and medicalized language may have the effect of alienating non-specialists (Crespin and Ferron, 2016). This demands scrutiny of the motives of channel providers and raises critical questions about whether goals to ‘empower’ individuals to breathe clean air align with the subconscious creation of a pathological problem for which a commercial solution is then conveniently supplied.
Structural barriers to AQ Channel access
While information and mechanisms for delivery often self-describe as being inclusive by virtue of being ‘open-access’, they are still subject to the effects of digital and informational inequality. Certain social and demographic groups are more likely to engage with and potentially benefit from this genre of information (Shaw & Hargittai, 2018). Access patterns vary by AQ channel mode of information delivery, as demonstrated by the three case examples. Results from AirTEXT demonstrate that patterns of access are driven by pre-existing health conditions, while the linear model reinforced the significant association of population density and mean annual NO2 concentrations with the number of subscriptions at the outer postcode level. Additional research is warranted as to whether the AirTEXT patterns observed will also appear across other AQ channels.
Digital trace data from the two case examples showing temporal access trends, London Air and Breathe London, point to common time windows during which these AQ channels are accessed. Access to London Air increases at 9:00 a.m. and Breathe London at 8:00 a.m., for which it can be assumed individuals check these AQ channels before their morning commute. Access levels remain high for both channels through 16:00 align with individuals checking the channel before their return commute. Both channels also show a peak around 14:00, which may indicate parents checking before collecting children at school (Figures 10 and 11). These findings suggest that AQ channel innovation stimulates an awareness that may drive ERB uptake. Days when access spiked for London Air and Breathe London don’t appear to correlate with high pollution events. However, on one of the days demonstrating high access across both Breathe London and London Air (21 October 2020), the Guardian released two articles about air pollution. No direct links to either AQ channel were provided in the articles suggesting that individuals took it upon themselves to seek out AQ information. A more detailed examination of the dates when access spiked across these and other AQ channels could support greater understandings of the effects of journalism, media and messaging on uptake of AQ channels, alongside which groups are most likely to engage with this genre of information.
The trend towards decentralized, locally generated knowledge, along with AQ data production and exchange through AQ channels contrasts with the impetus of the original UK Clean Air Act and its respective, centralized monitoring and ‘evidencing’ protocols that still dominate AQ governance today. Key questions raised by the diffusion of AQ channels include: who in a population is most likely to engage with these AQ channel information sources and which individuals have the psychosocial or economic capacity to shift behaviours and lifestyles? It is therefore essential to ask where AQ channels fall within the broader scope of AQ governance, whether the onus is being placed on individuals to safeguard against the health impacts of air pollution, how AQ channel uptake may be further socio-demographically stratifying knowledge production surrounding AQ and patterns of exposure reduction, and how co-creative methods could help mitigate such challenges.
Conclusion
This study systematically identified and characterized channels delivering an emerging genre of information about localized AQ in real or near real-time across London, UK. By establishing clear criteria for inclusion according to features identified across the literature, a list of 54 AQ channels was generated. Upon examination, the channels demonstrated clear overlap in air pollution estimates and models used to present a ‘reading.’ The marketing of personal sensors and other pollution-abating commercial products was apparent across multiple channels, while simultaneously emphasizing messages of personal responsibility and self- identification of risk surrounding exposure reduction, narratives of ‘empowerment’ and alignment with the WHO Sustainable Development Goals. These varied and occasionally contradictory framings across AQ channels warrant critical attention from groups who are developing the channels, as well as those who are consulting them, signalling an opportunity for participatory and co-design methods to approach such discrepancies. Furthermore, critiques of whether AQ channels can be truly ‘free’– whether it be a function of Internet access, device costs, digital skills or giving up personal data – must be extended and amplified.
A lack of critical engagement from both users and the academic community surrounding AQ channels and the information they proliferate, in addition to a lack of transparency on the part of channel developers, maintains conditions that neglect fundamental insights surrounding what constitutes sustainable, democratic AQ knowledge production. This includes the continued employment of the information deficit model, the narrow focus of messaging around pathologizing of the subject of AQ, opaque framings of risk and reporting of inaccurate or imprecise AQ conditions, often associated with disparate geographic resolution of pollution estimates or failure to adjust for meteorological conditions.
The diffusion of innovations theory established a useful research design framework for tracing patterns of uptake using user analytics and metadata, yet fell short when confronted with results indicating that the AQ channel innovation evolves continuously as opposed to a step-by-step process. The theory also struggled to address how AQ channels and associated data become enmeshed throughout social life. Future AQ channel developments should exercise participatory methods that actively involve individuals in producing knowledge, as opposed to the passive logging of data. This can be accomplished by employing co-design methods when developing sensing and data management infrastructures, or trialling more interactive, iterative user interfaces. Channels can therefore not only engage individuals more effectively, but also consciously identify as ‘living’ projects that incorporate many diverse and important experiences of air pollution that exist across a population.
Advancing knowledge of what drives increased access to AQ channels, including further investigation of the effects of news media on channel uptake, can also illuminate whether different drivers are more likely to motivate certain groups in a population. Specifically, the question of whether uptake of ERBs exacerbates existing exposure inequalities if such behaviours are not uniform across the population will require user analytics data that is demographically linked. Ideally, such data would be anonymized by AQ channel providers and shared for non-commercial, academic research purposes with the goal of developing more equitable channels for AQ information communication. Rigorous empirical research can support future understandings of the association between AQ channel uptake, varieties of ERBs, the contexts underpinning their adoption, how they might modify exposure patterns and health outcomes ranging from individual to the population level, along with potential trade-offs or unintended consequences of the innovation. There is also more to be learned about whether AQ channels and ERBs had any effect on early COVID-19 case rates, particularly in urban areas. Air pollution is a pervasive challenge that is deeply interconnected with the social, institutional and commercial facets of everyday life. The potential for AQ channel development to shift towards a trajectory that critically approaches disproportionate patterns of exposure in a co-creative capacity remains to be seen.
Supplemental Material
sj-xlsx-1-bds-10.1177_20539517221101346 - Supplemental material for ‘Real-time’ air quality channels: A technology review of emerging environmental alert systems
Supplemental material, sj-xlsx-1-bds-10.1177_20539517221101346 for ‘Real-time’ air quality channels: A technology review of emerging environmental alert systems by Kayla Schulte in Big Data & Society
Supplemental Material
sj-xlsx-2-bds-10.1177_20539517221101346 - Supplemental material for ‘Real-time’ air quality channels: A technology review of emerging environmental alert systems
Supplemental material, sj-xlsx-2-bds-10.1177_20539517221101346 for ‘Real-time’ air quality channels: A technology review of emerging environmental alert systems by Kayla Schulte in Big Data & Society
Supplemental Material
sj-xlsx-3-bds-10.1177_20539517221101346 - Supplemental material for ‘Real-time’ air quality channels: A technology review of emerging environmental alert systems
Supplemental material, sj-xlsx-3-bds-10.1177_20539517221101346 for ‘Real-time’ air quality channels: A technology review of emerging environmental alert systems by Kayla Schulte in Big Data & Society
Supplemental Material
sj-docx-4-bds-10.1177_20539517221101346 - Supplemental material for ‘Real-time’ air quality channels: A technology review of emerging environmental alert systems
Supplemental material, sj-docx-4-bds-10.1177_20539517221101346 for ‘Real-time’ air quality channels: A technology review of emerging environmental alert systems by Kayla Schulte in Big Data & Society
Supplemental Material
sj-docx-5-bds-10.1177_20539517221101346 - Supplemental material for ‘Real-time’ air quality channels: A technology review of emerging environmental alert systems
Supplemental material, sj-docx-5-bds-10.1177_20539517221101346 for ‘Real-time’ air quality channels: A technology review of emerging environmental alert systems by Kayla Schulte in Big Data & Society
Supplemental Material
sj-pdf-6-bds-10.1177_20539517221101346 - Supplemental material for ‘Real-time’ air quality channels: A technology review of emerging environmental alert systems
Supplemental material, sj-pdf-6-bds-10.1177_20539517221101346 for ‘Real-time’ air quality channels: A technology review of emerging environmental alert systems by Kayla Schulte in Big Data & Society
Supplemental Material
sj-docx-7-bds-10.1177_20539517221101346 - Supplemental material for ‘Real-time’ air quality channels: A technology review of emerging environmental alert systems
Supplemental material, sj-docx-7-bds-10.1177_20539517221101346 for ‘Real-time’ air quality channels: A technology review of emerging environmental alert systems by Kayla Schulte in Big Data & Society
Footnotes
Acknowledgements
The author would like to thank Melinda Mills, Ridhi Kashyap, Jennifer Dowd, Gina Neff, Karl Dudman, Christina Bagdikian, Dan Costa, Suzanne Bartington, Brian Stacey, Andrew Grieve, Felicia Douglas, CERC, EDF and the anonymous reviewers for their valuable feedback.
Declaration of conflicting interests
The author declared the following potential conflicts of interest with respect to the research, authorship, and/or publication of this article: I am working as a research assistant on the second iteration of the Breathe London project. I did not work on the first phase of the project for which data was obtained and analysed in this study.
Funding
The author disclosed receipt of the following financial support for the research, authorship, and/or publication of this article: This work was conducted as a part of doctoral scholarship research funded by the Leverhulme Trust.
Supplemental material
Notes
Appendix
References
Supplementary Material
Please find the following supplemental material available below.
For Open Access articles published under a Creative Commons License, all supplemental material carries the same license as the article it is associated with.
For non-Open Access articles published, all supplemental material carries a non-exclusive license, and permission requests for re-use of supplemental material or any part of supplemental material shall be sent directly to the copyright owner as specified in the copyright notice associated with the article.