
Abstract
Social media commentary, satellite imagery and GPS data are a part of ‘alternative data’, that is, data that originate outside of the standard repertoire of market data but are considered useful for predicting stock prices, detecting different risk exposures and discovering new price movement indicators. With the availability of sophisticated machine-learning analytics tools, alternative data are gaining traction within the investment management and algorithmic trading industries. Drawing on interviews with people working in investment management and algorithmic trading firms utilizing alternative data, as well as firms providing and sourcing such data, we emphasize social media-based sentiment analytics as one manifestation of how alternative data are deployed for stock price prediction purposes. This demonstrates both how sentiment analytics are developed and subsequently utilized by investment management firms. We argue that ‘alternative data’ are an open-ended placeholder for every data source potentially relevant for investment management purposes and harnessing these disparate data sources requires certain standardization efforts by different market participants. Besides showing how market participants understand and use alternative data, we demonstrate that alternative data often undergo processes of (a) prospecting (i.e. rendering such data amenable to processing with the aid of analytics tools) and (b) assetization (i.e. the transformation of data into tradable assets). We further contend that the widespread embracement of alternative data in investment management and trading encourages a financialization process at the data level which raises new governance issues.
Keywords
Introduction
The owner of a small consultancy that matches data vendors and investment managers shared this view on machine learning's use in financial investments in November 2018: I think machine learning is a tool. It is a great tool in some circumstances and not such a great one in others. For example, if you are parsing news data, and you are interested in adjusting a lot of news data to create some sentiment out of it, you have no choice, you must use NLP [natural language processing]. That is a great use. If you have satellite data and you want to count cars in a Walmart parking lot, machine learning is great. It is amazing. Where it becomes a bit more problematic is when people say, ‘we will use machine learning on a dataset, create an investment model, and we are going to revolutionize the world’. It is essentially a matter of taking a bunch of factors or pre-factors—you know, simple analytics—throwing a large bunch of them at a neural network or a boosted tree or whatever methodology you want to use, and then saying, ‘here is my model!’ […] I do not think it works like that. You must understand the data, understand what the data can do, and how you want the data to do something. (CEO of an alternative data quantitative research firm)
With the scope of available data sources increasing significantly due to investment industry demands, this informant's intermediary role between data providers and purchasers helps lower the transaction costs associated with finding the dataset suitable for a specific investment firm's strategy. While explaining what his job entailed, he gave the hypothetical example of a firm extracting credit card transaction data from a sample of costumers in, for example, the US or the UK with the ambition of selling them to hedge funds. In that scenario, this informant's job would be ‘to help define good and easy ways for a potential client to extract a signal from this mess of a dataset’. This kind of matching exercise requires a broad knowledge of the analytics techniques deployed in the investment management industry as well as an understanding of data, what they can do and what information the purchaser needs. This article focuses on alternative data – a broad-ranging and continually expanding bundle of disparate non-standard financial data sources such as social media, satellite imagery, GPS and sensor data (Denev and Amen, 2020; Ekster and Kolm, 2021) – rather than the tools and techniques leveraged in related data analysis. However, it is not possible to fully grasp what alternative data are and how they are used in financial investment management and securities trading without also considering the analytics tools. It is the constellation of data and analytics techniques that determines specific uses and, therefore, the possibilities for extracting valuable information from various data sources. Hence, data practices (Alaimo and Kallinikos, 2021) and practices of model use (Svetlova, 2018) are necessarily entangled.
Against this backdrop, this article aims to examine how investment managers and traders make use of alternative data, that is, data which originate outside of the standard repertoire of market data, but which are believed to be useful for predicting stock prices, managing risk and anticipating market movements. Alternative data have become increasingly popular for investment purposes in recent years. While some recent studies have examined banks’ use of alternative data for credit scoring (Aitken, 2017; Bernards, 2019), little scholarly attention – from the fields of economic sociology and, more specifically, social studies of finance – has focused on alternative data in investment management and trading. The exception is environmental, societal and governance (ESG) data, which is probably the most widely used alternative data subset in investment management and a phenomenon (i.e. sustainable investing) that is being vividly scrutinized by social scientists, including in in-depth ethnographic studies (see, e.g. Dahlman et al., 2021; Eccles et al., 2020; Leins, 2020). Besides exploring what alternative data are and how market practitioners use them, we discuss the implications of the continuous expansion of potentially relevant data sources for the finance industry.
Our central argument is that while the orientation toward alternative data is broadening the possibilities for investment management and trading firms, it also requires significant efforts to order disordered and disparate data sources such that they can be used systematically. This ordering process entails some degree of standardization (Preda, 2009) or abstraction (Bernards, 2019) that renders alternative data sources usable in a financial market context. We argue that two practices are central to the extraction and ordering of alternative data: (a) prospecting, that is, ‘the work of rendering data […] amenable to engagement with data scientific method’ (Slota et al., 2020: 1) and (b) assetization, understood as ‘the contingent transformation of a resource (e.g. data) into capitalized property’ (Birch et al., 2021: 2; see also, Birch, 2017; Birch and Muniesa, 2020; Langley, 2021). Whereas prospecting widens the understanding of what is relevant and usable data in the finance world, assetization turns data sources that previously were of little interest to investment and trading firms into valuable tradable assets.
Recent scholarly work has primarily studied the assetization of data relating to how big tech firms such as Apple, Amazon, Facebook, Google and Microsoft exploit big data, when they assetize personal data in advertisement-driven surveillance capitalism (Zuboff, 2019), or when they turn user metrics into assets that might be positively valued by investors (Birch et al., 2021). Where Zuboff's analysis, in particular, is surprisingly silent on financial markets and the role they play in data capitalism, we demonstrate that the turn to alternative data, and thus its prospecting and assetization, amounts to the financialization (Krippner, 2005) of otherwise non-financial data within the circuit of finance (Aitken, 2017; Bernards, 2019; Tan, 2020). This entails an important change in the relevant actor composition when it comes to understanding the connection between data and capitalism. Although the use of alternative data involves technological tools – in particular, machine learning techniques – the central actors are not big tech firms but rather a diverse array of investment management firms, proprietary trading firms and data analytics firms as well as securities exchanges. In many ways, their efforts run parallel to those of big tech firms; sometimes, they may piggyback on the data generated through big tech-platforms (e.g. tweets); other times, they themselves search for alternative data sources.
The article is organized as follows. After this introduction, we present the theoretical framing which revolves around the idea that prospecting and assetization are a means of standardization. We discuss how this pertains to alternative data. Then we outline our methods and data. In the four sections that follow, we examine and discuss (a) what alternative data are and how they are used; (b) the possibilities and challenges associated with a specific form of alternative data use, namely social media sentiment analytics; (c) how alternative data help investors and traders bolster existing investment and trading strategies with additional layers of information or create new ones from insights extracted from alternative datasets; and (d) the issues associated with broadening the range of data sources considered relevant to the investment management and trading industries, in particular the data-governance challenge of anchoring disparate alternative data sources. We end with a brief conclusion.
Standardizing non-standard data
Theoretically, we draw on, combine and extend work on standardization – conceived here as the dual process of prospecting and assetization – and financialization. Historically, standards have been key vehicles for the rationalization of modern financial markets. In the late 19th century, the Chicago Board of Trade introduced a grading system for various kinds of crops, which meant that the commodities were transformed into ‘homogeneous abstractions’ such as ‘spring wheat from winter wheat, No. 1 wheat from No. 2 wheat, and so on’ (Cronon, 1991: 132; see also, MacKenzie, 2006). This standardization enabled systematized trading in futures contracts which fundamentally reshaped commodities trading. Similarly, the introduction of uniform price quotations via financial communication infrastructures like telegraph wires and stock tickers, established during the same period, helped standardize price dissemination (Pinzur, 2021; Preda, 2009). In the case of the ticker, it was the technology itself that standardized the dissemination of price information from the exchanges. In contrast, standards for data in today's financial markets are created to accommodate the plurality of strategies, technologies and analytics techniques deployed by actors in the investment management and trading fields.
With alternative data, standardization does not imply conformity to a single system or technology (i.e. homogeneous abstractions). Rather, standardization implies packaging the myriad data sources in ways that suit the strategies and technological affordances of those interested in using them for investment or trading purposes. This form of standardization or framing – that is, ‘the process through which technology creates calculable objects’ (Preda, 2009: 117) – acknowledges the qualitative and structural differences in alternative data sources. In other words, alternative data are characterized by heterogeneity, and it is the job of the analytics tools, such as natural language processing (NLP) machine-learning algorithms, to render them calculable. Moreover, analytics tools become boundary-setting mechanisms that draw distinctions between relevant and non-relevant data regarding processability. Preda (2009), following Michel Callon, refers to this technology-induced boundary-making as disentanglement. In the case of alternative data, disentanglement hinges on the suite of analytics techniques available for big-data processing. The boundary between relevant and non-relevant data is thus, both a matter of making data sources processable and matching specific alternative data sources with the technologies capable of extracting insights from them.
In data science, framing (alternative) data is referred to as prospecting, which entails rendering the ‘disordered as ordered’ and enabling seamless reuse of data resources ‘perhaps with altogether different questions in mind than what motivated their initial creation or development’ (Slota et al., 2020: 2). More specifically, Slota et al. (2020: 1) define prospecting as: [T]he work of rendering data, knowledge, expertise, and practices of worldly domains available or amenable to engagement with data scientific method and methodology, including mapping available data sources and tools, surveying about future resources. Prospecting precedes data analysis or visualization, and is constituted by the activities of discovering disordered or inaccessible data resources, thereafter to be ordered and rendered available for data scientific work.
Thus, prospecting does not hinge on one technology, as in the case of the ticker, but on the range of data-science methods available. In practice (and finance more specifically), this becomes a matter of the investment firm's investing approach (strategy) and the technology it mobilizes. Prospecting is a standardization effort that ensures data are processable given that the suitable analytics tools are in place, and it does so without compromising data heterogeneity. In his study of the ticker, Preda notes that trust in financial data was transferred from authoritative individuals to the price dissemination technology, which leads him to argue that ‘trustworthy data are data produced or recorded by an authoritative technology’ (Preda, 2009: 117). With alternative data and the analytics tools used to process them in the realm of finance, authoritative data are analysable data that prove valuable to individual firms’ investment and trading efforts. Data and technology authority is, thus, very much a local and context-dependent question.
Another way alternative data become usable, and indeed reusable, is through assetization. As Leonelli argues, data are no longer regarded as ‘stable objects’ but have now largely become ‘reusable goods’ (2019: 317) or ‘data commodities’, as Aaltonen et al. (2021) call them. We find ‘asset’ a more apt term to capture the economization and rendering tradable of data than ‘commodity’ or ‘good’. An asset is, as Birch and Muniesa note, something that ‘can be owned or controlled, traded and capitalized as a revenue stream’ (Birch and Muniesa, 2020: 2). Regarding alternative data, the point is exactly that ownership or control of data assets allow vendors to sell access to and thus the right to reuse and repurpose the data they possess. It is more akin to a subscription model than a one-off exchange of goods. What makes data less tangible and controllable assets than, for example, a piece of land is that data generally are easy to reuse, repurpose and repackage. Consequently, access to data assets can produce all kinds of data derivatives (Amoore, 2011) – visualizations, scores, etc. – when parsed using different analytics tools. These, in turn, can become sources of revenue at different stages of the data value chain. With the economic value of alternative data becoming increasingly apparent to financial market participants due to the continuous broadening of the techniques to extract, compile and exploit them, data are increasingly being perceived and treated as economic assets and are thereby subjected to assetization (Birch et al., 2021; Birch and Muniesa, 2020). Assetizing data transforms a data resource into tradable ‘capitalized property’ (Birch et al., 2021: 2). In the case of alternative data, assetization happens among vendors of such data resources, including securities exchanges and many firms devoted singly to data provision.
We argue that the widespread adaptation and assetization of alternative data as well as the continuous prospecting of new data resources push financialization on the data level. This happens not just to the economy (Krippner, 2005) but potentially to all data. This financialization through data appropriation and exploitation has been addressed in studies of credit-scoring regimes on the individual level (Aitken, 2017; Bernards, 2019). However, as we discuss below, on the level of calculative practices at the (inter-)firm level (Besedovsky, 2018), the financialization of data raises questions about data and technology governance, rather than the financialization of the individual and of everyday life.
Methods and data
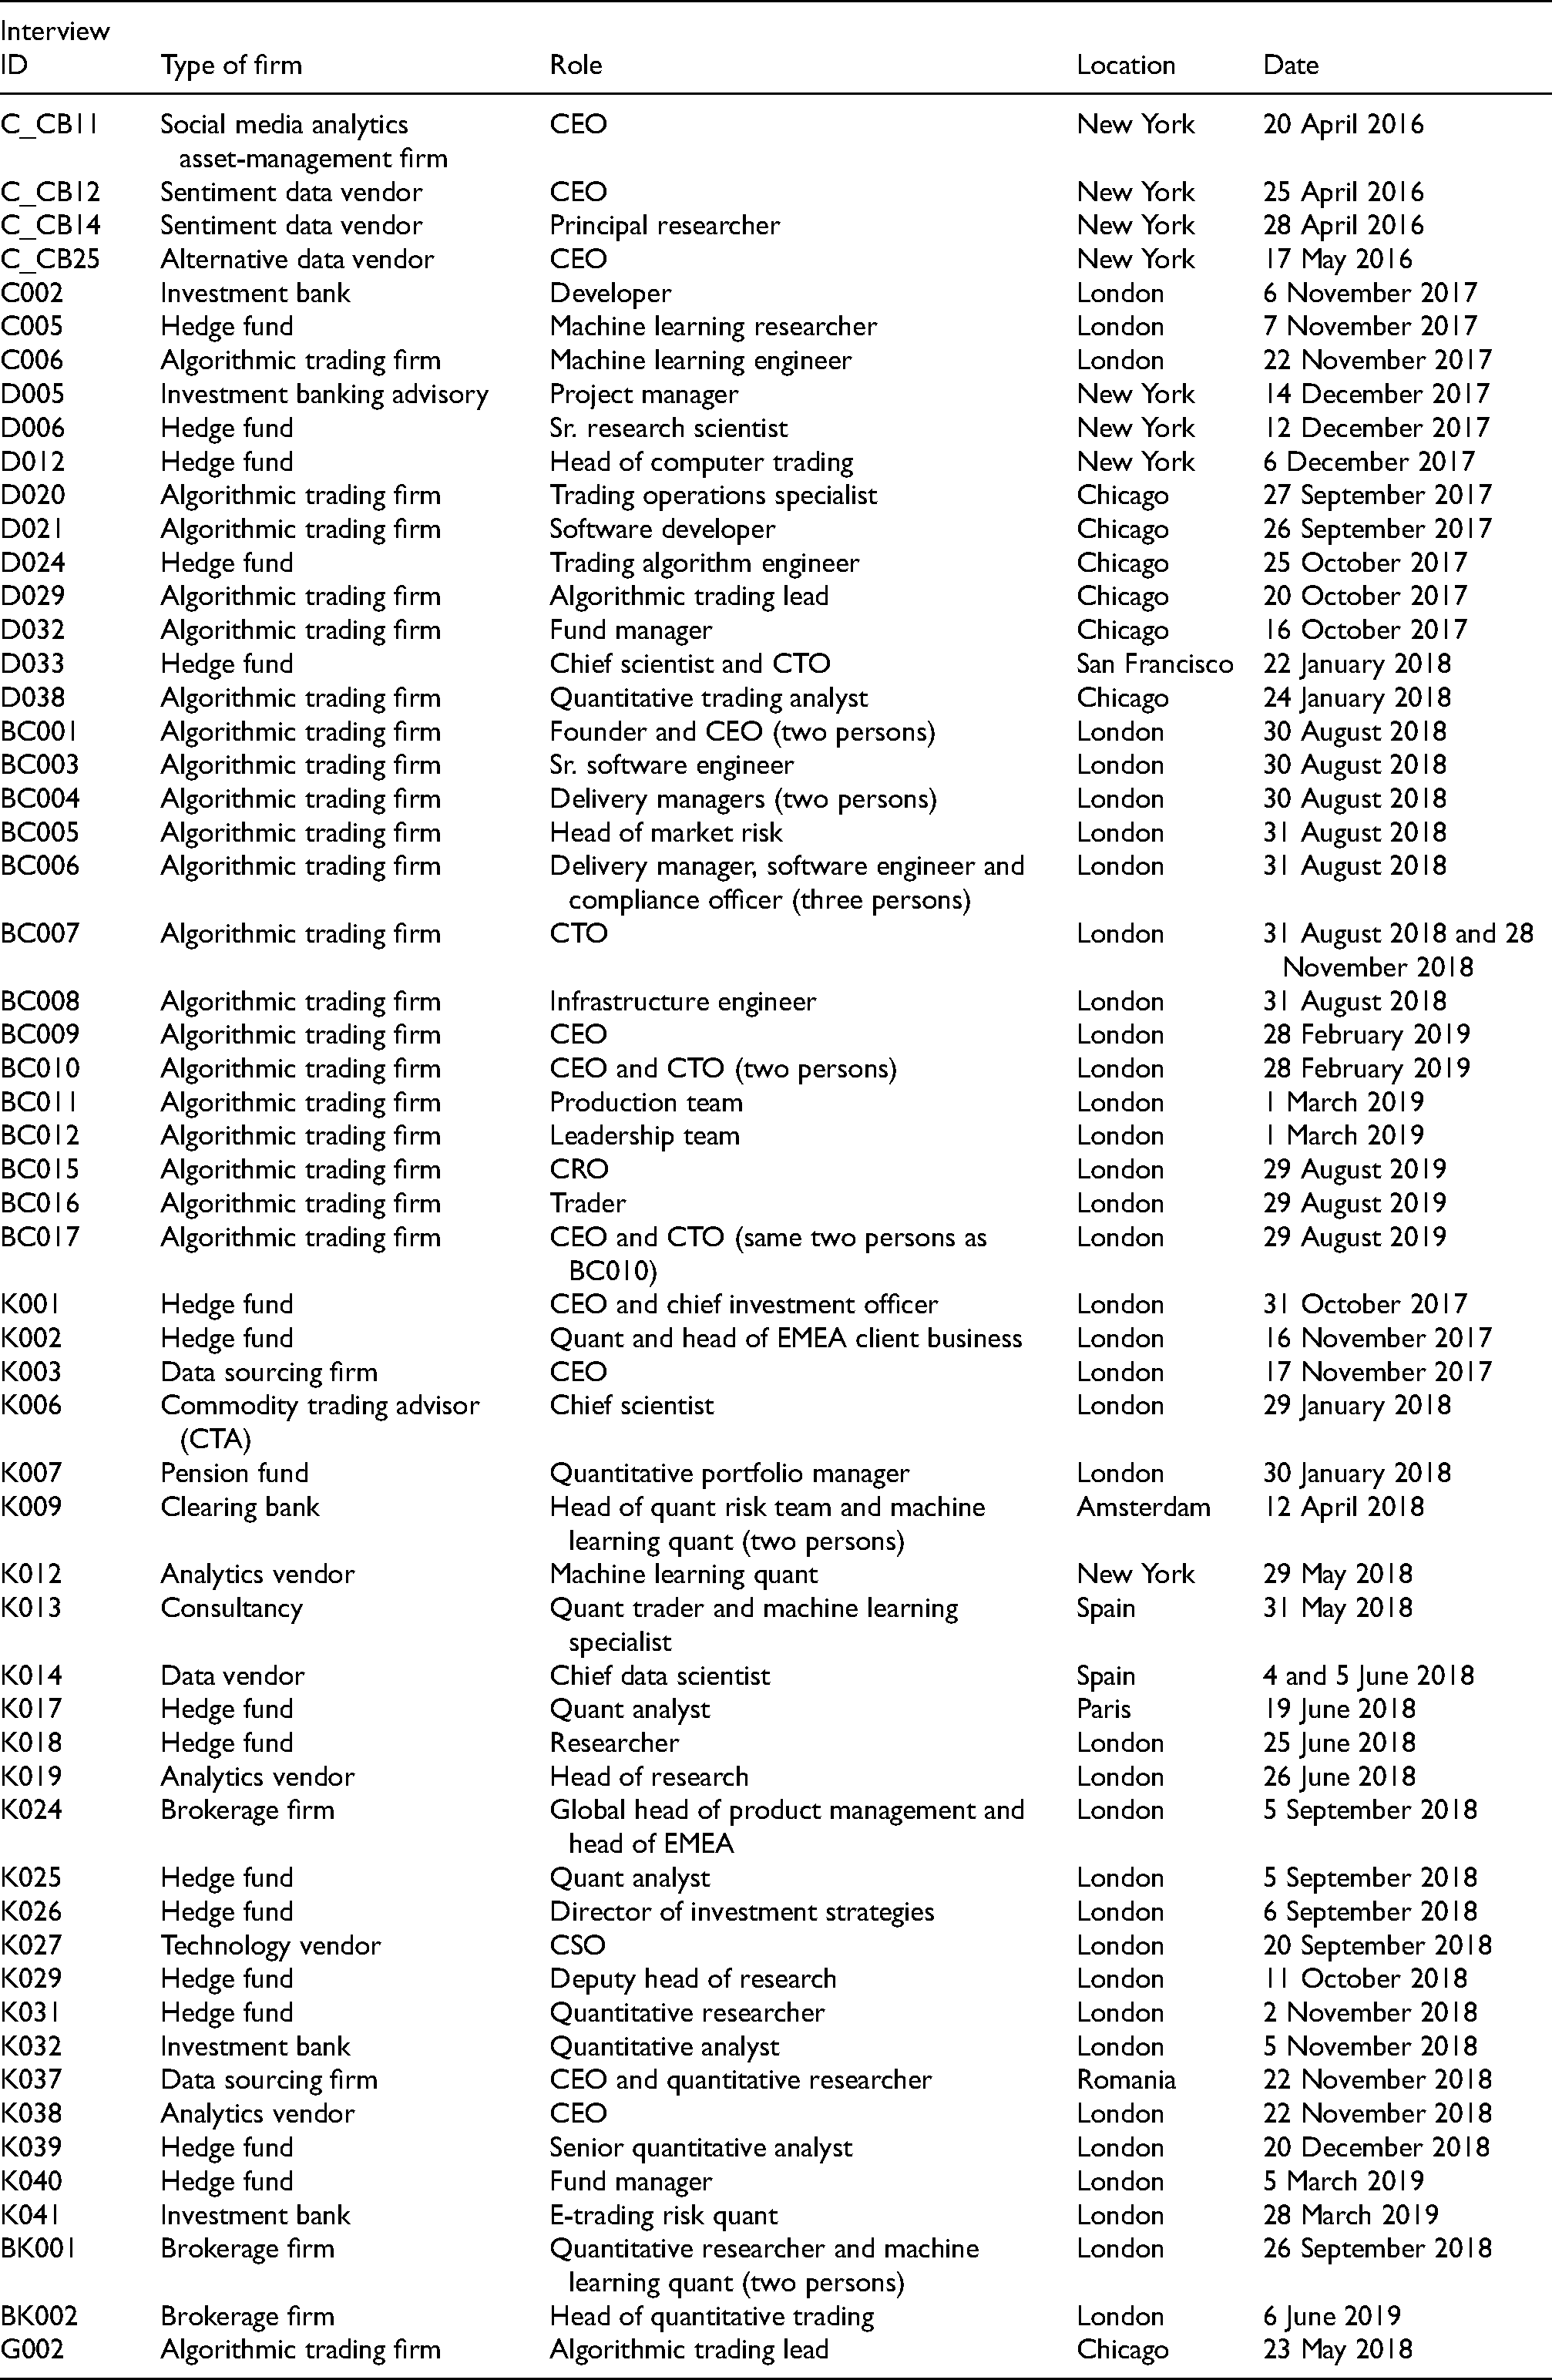
To study alternative data and their use in trading and investment management, we draw on a comprehensive body of interview data collected by colleagues (Pankaj Kumar, Ann-Christina Lange, Bo Hee Min, Nicholas Skar-Gislinge and Daniel Souleles) and ourselves during two research projects examining automated, algorithm-driven financial markets. The interviews were conducted between 2014 and 2020 with a total of 213 people working in a wide range of firms and institutions in or around algorithmic trading and quantitative investment management (see Table 1), including firms specializing in providing alternative data and data analytics for hedge funds and other suiters. In terms of geography, most interviews were conducted in the global financial hubs of London, New York and Chicago, as well as in the hubs for more niche market actors such as Amsterdam (high-frequency trading) and the Bay Area in California (e.g. tech-centric hedge funds). From the 213 interviews, we created a subsample of 58 interviews with people providing and sourcing alternative data or using them for investment management and trading purposes as well as people leveraging machine-learning techniques required to render alternative data into a valuable resource (see Table 2).
Interviews.

List of interviews in machine learning–alternative data subsample.
We used an open coding approach when analysing our interview transcripts. Our codes included ‘alternative data’, ‘alt data’, ‘sentiment (data)’, ‘news data’, ‘big data’ and ‘social media’. We identified, extracted and then analysed passages from the interviews in which alternative data were discussed. Moreover, we distinguish between those talking about alternative data but who do not use them, and those who deal with such data, whether as data providers, analytics vendors or firms using alternative data in their everyday trading and investment practices. This distinction is necessary when distinguishing between the ways in which alternative data are perceived by people in the financial industry and the ways they are used in practice. The latter category helps us see through the hype about alternative data and promising sales pitches from data and analytics vendors as well as the scepticism of more old-fashioned professionals who do not suffer fads lightly, to the practical level, where such data are fed to models active in the markets. While the commotion around alternative data should not be dismissed as irrelevant hype because it does, to some extent, reflect a general attitude towards such new phenomenon, for us to analyse the concrete practices of alternative data users, we needed to engage with such users and, partially, with this hype.
One limitation of conducting interviews in a secretive world such as the financial industry is that market participants tend to be willing to talk about their work – including the data and techniques they use – in general terms but are less inclined to divulge detailed specifications about the models and the exact data types they use and from where they are derived. For example, it is only in rare cases that informants reveal their data type (e.g. transaction data), methodology or technology (e.g. reinforcement learning algorithms), and the application context (e.g. order routing). The reason for the reluctance to reveal all elements in this data–method/technology–context/problem nexus is that this is where firms’ strategic edge resides. We try to compensate for this methodological limitation by comparing, contrasting and complementing our interview data with supplementary textual data. Thus, in addition to our interview data, we examined academic studies – mainly financial economics and empirical finance – that experiment with stock price prediction and other topics from the analysis of sentiment data to financial newspapers’ coverage of the field, as well as information from alternative data providers’ websites and sales materials.
What are alternative data?
As high-frequency trading is now responsible for more than half of the trading volume in several markets (MacKenzie, 2021a), market data in the form of data from electronic order-books, which list pending orders to buy or sell securities (MacKenzie, 2018; Pardo-Guerra, 2019), have attracted much scholarly and practical attention in recent years, with research detailing how trading firms pay high fees to access these data at the highest possible speed as well as how they place considerable efforts toward cleaning and triangulating the market data they receive from different vendors (e.g. NYSE, 2021; Seyfert, 2016). Interestingly, however, the rise of alternative data has given quantitative, algorithmic hedge funds and other data- and technology-driven investment firms the possibility of exploring a plethora of new data sources in search of an edge in the markets. Investment strategies based on alternative data have, especially compared to high-frequency trading, a long-time horizon. However, events such as the 2013 ‘Hack Crash’ suggest that some high-speed algorithms can incorporate alternative data (Karppi and Crawford, 2016). In this event, the Associated Press's Twitter account was hacked, posting the message ‘Breaking: Two Explosions in the White House and Barack Obama is injured’. Within a few seconds, the Dow Jones Industrial Average saw a significant drop, but it soon became clear that the tweet's content was fake, and markets recovered within a few minutes (Karppi and Crawford, 2016). Although the recovery took place at a time scale where humans could be active, the crash suggests that fully automated high-speed trading algorithms were designed to monitor and react to tweets.
While the most technically advanced and data-centric quantitative hedge funds have been trawling for signals in many different types of data for several years, it is only during the last couple of decades that the scope of what is considered financially relevant data sources has expanded significantly. One of the main reasons for this growing interest and willingness to spend money and time exploring alternative data is that it has become technologically possible and economically sound to leverage such data (Monk et al., 2019). The increase in computing power and server capacity combined with the much lower cost of hardware, software and data storage has made it feasible for investment management firms to embark on new data-processing endeavours. Additionally, in recent years, the availability of data has greatly increased, and the number of data scientists wielding complex machine-learning techniques to parse these incongruent datasets has grown (Arnott et al., 2019).
But what, more precisely, are alternative data? Most often, alternative data are negatively defined. A recent article in the Financial Times defined alternative data as comprising ‘niche information beyond standard market indicators or statistical releases’ (Fletcher, 2020). While this is a common way to define alternative data, it is neither a strong nor informative definition. In one of the few books devoted exclusively to alternative data, Denev and Amen (2020: 6) argue that, for a dataset to be labelled ‘alternative data’, it needs to have at least one of the following five characteristics: (a) it is less commonly used in markets; (b) it tends to be more costly to collect and purchase; (c) it usually comes from outside the financial markets; (d) it has a shorter history; and (e) it tends to be more challenging to use than standard market data.
Examples of alternative data sources include ‘satellite imagery, social media, ship movements and the Internet-of-Things (IoT)’ (Denev and Amen, 2020: 5). For example, the satellite imagery of retail store parking lots may be used to forecast the store's earnings. Similarly, sensor data on crops may be used to forecast the yield of a harvest. Furthermore, ‘automated identification system’ data can be used to monitor vessel traffic, and this might be used to forecast the demand for crude oil and, hence, its price movements (Denev and Amen, 2020), just as GPS data on the shipping of cargo by air, land or sea may be used to monitor supply chains.
The six-day blocking of the Suez Canal by the 300-meter-long container ship, the Ever Given, in March 2021 was a somewhat bizarre reminder of the physical nature of global trade and the vulnerabilities of supply chains. Surely, the Ever Given's clogging of the Suez was an extreme event and not something any person or model could have foreseen, but it nonetheless sheds light on the potential value of closely monitoring trade routes and cargo shipping. Online platforms like Marine Traffic and Shipfix provide granular data on the shipping industry, including the tracking of ships, cargo types and relationship metrics. While such data are obviously valuable to distributors, sellers and manufacturers, commodity traders can also try to extract signals from them in attempts to predict or at least bolster their predictions of movements in the prices of commodities. This is, indeed, the idea behind using alternative data: collate data from a source that is neither company earnings reports nor electronic order books (or similar) but which may, nonetheless, add important information about how the price dynamics of particular companies or commodities may evolve in the future.
Though the characteristics listed by Denev and Amen (2020) help narrow the scope of the alternative data category, the ensuing delineation remains quite broad and unspecific. Moreover, their list suggests that alternative data is an essentially dynamic category – dynamic in the sense that data sources stop being alternative once they become popular in the industry. Rado Lipuš, the CEO and founder of a London-based alternative data sourcing firm Neudata, and one of our informants, said that even though alternative data had only been widely available for a few years – this was late 2017 – the field is expanding rapidly due to firms investing a lot of money into it. As a logical consequence of this development, alternative data will eventually ‘stop being alternative and become mainstream’, as he put it.
Elaborating on this process of alternative data sources eventually becoming part of the standard corpus of finance data, Lipuš used ESG data as an example. He pointed out that due to ESG data's widespread uptake, ‘one could argue that they are not that alternative anymore’. However, while they might have become commonplace in the investment management world, Lipuš stressed that the ESG moniker still comprises a disparate and non-standardized jumble of data sources for financial firms, data vendors and intermediaries like Neudata to disentangle and use. ‘We know of around 40 smaller providers of really interesting insights on ESG topics’, and on the other side of the equation, ‘many asset allocators are interested in fund managers who invest ethically by taking ESG factors into consideration’. 1 Making the variegated data sources amenable to investment analysis thus requires a context-specific disentanglement process through which data are sourced and ordered with a view to the analytical affordances of the investment management firm purchasing them. Another way in which the alternative data category is dynamic is that new sources are continuously subsumed under the ‘alternative’ label, which happens when someone deems them relevant for investment management purposes by subjecting them to analytic scrutiny, that is, through prospecting. That air pollution levels and airline traffic can be used as proxies for economic activity has, for example, become evident during the COVID-19 pandemic (Georgiadis et al., 2020) but might not have been useful indicators before.
It is also at the heart of alternative data that they concern the repackaging and repurposing of data. Repurposing, which simply means using a data source for an alternate purpose than was originally intended (Colombo et al., 2017; Thylstrup, 2019), should, indeed, be added to Denev and Amen's list of alternative data characteristics. Notably, such repurposing is not new in the financial services industry. In his study of the use of alternative data in credit scoring, Aitken (2017) shows how banks make use of disparate (alternative) sources of data that normally would not immediately be considered relevant to the measurement of an individual's creditworthiness. The banks create ‘calculative infrastructures’ connecting wide arrays of data sources that then are repurposed for credit scoring (Aitken, 2017).
What is new is that the repurposing and reuse of data (see, e.g. Pasquetto et al., 2017) have entered the circuit of trading practices and this is partly due the assetization process. One illustration of this is that securities exchanges are increasingly looking into alternative data as an income generator. Where securities exchanges were previously non-profit member-based organizations (Lee, 1998), they have increasingly transformed into for-profit listed companies whose revenue streams include aspects that go far beyond what exchanges used to be concerned with. For example, data provision is now an increasingly important part of their business model (Petry, 2021). This includes selling fast data feeds of order-book updates to high-speed market participants. However, it also increasingly includes venturing into alternative data, which means recognizing that trading and investment firms not only rely on the data generated internally at the respective securities exchanges (as reflected in the order book data), but also on repurposed alternative data. To illustrate, in January 2021, the London Stock Exchange Group (LSEG, 2021) closed a deal to acquire Refinitiv, a data provider that, in addition to traditional fundamental data, offers access to alternative data, such as sentiment data, the tracking of vessels, crop health and oil refinery outages.
Looking at the products and services provided by prominent data and analytics vendors such as Refinitiv, Quandl and RavenPack, two things stand out: first, the sheer scope of datasets on offer and, second, their entanglement with the technologies required to turn them into valuable insights. Refinitiv, for instance, provides approximately 220 datasets – not all alternative (about one-fourth are pricing and market datasets) – which they divide into 15 categories including news, risk intelligence, company data and regulatory data. Besides being pre-categorized, all of its datasets specify the data format, the delivery mechanism (API, Excel, etc.), and the frequency at which the data are provided (Refinitiv, 2021a). A similar framing of datasets is found in Nasdaq's alternative data catalog – Nasdaq acquired the data vendor Quandl in 2018 (Nasdaq, 2018) – in which categories like asset class fit and investment style are also specified (Nasdaq, 2019).
In the sales material of individual datasets, the framing information is further granularized, revealing the technology used in data processing and suggesting how to extract information from it. Take Refinitiv's sentiment dataset MarketPsych Analytics – the fruition of a partnership between Refinitiv and the behavioural analytics firm MarketPsych – which is generated using a ‘machine learning NLP system’ that ‘turns unstructured text from thousands of curated news and social media sources into structured scores’ (Refinitiv, 2021b). The patented NLP system functions as a standardizer by processing texts from over 4000 disparate news sources from Reuters to Reddit and transforming them into calculable scores, which are again divided into categories such as the number of references, positive and negative tones, and emotional indicators like optimism, fear and uncertainty (Refinitiv, 2021b). RavenPack, another popular alternative data and analytics vendor, puts similar emphasis on the technologies that turn an unstructured mess of data into actionable insights for investment managers to use in the investment process. Besides provisioning alternative datasets, they offer a data–technology assemblage comprising textual data plus proprietary NLP technology as a package for purchasers to plug into their investment systems (RavenPack, 2021).
However, as Denev and Amen (2020) note, using alternative data for investment purposes is neither risk-free nor without challenges. Issues include compliance with different data-protection regulatory regimes such as the GDPR in the European Union – which may raise independent AI ethical issues – but also aspects that are known from any other type of data analysis, such as missing data points, how to treat outliers, as well as how to turn unstructured into structured data. Many alternative data are unstructured. As for the structured–unstructured data distinction, a chief data scientist from a leading alternative data vendor described ‘the latter being virtually everything that cannot be plotted into the rows and columns of an Excel sheet’ such as image or audio data. One general issue with transforming unstructured into structured data concerns mislabelling risks. This is particularly problematic in ESG if something is labelled ‘sustainable’ but is the opposite. Data quality is another basic issue. For example, image processing and detection algorithms will not perform well if the resolution of satellite imagery is low, but data-quality issues also manifest in cases where alternative data are manipulated (we discuss an example below). Another issue associated with alternative data processing, which several informants raised as a concern, relates to the risk of machine-learning algorithms fitting on noise rather than data signals. The overfitting problem is thus, not an alternative data problem as such, but it is a major concern among those leveraging machine-learning algorithms – such as NLPs and deep neural networks – to process large amounts of alternative data (Hansen, 2020; see also, Hansen and Borch, 2021). As a result of these various issues, data governance is of primary importance to this field.
In the following section, we discuss a prominent form of alternative data that, due to the increased sophistication of NLP machine-learning techniques, have now reached maturity in the investment space – sentiment analysis based on Twitter and similar social media data. Although there are also data quality issues with this type of data – for example, in relation to possible manipulative schemes – many see it as a promising resource which, compared with other alternative data, is both accessible and relatively immediately analysable.
Social media sentiment analysis
The notion that social media content can be analysed as an expression of public sentiment and exploited for stock-market prediction purposes gained particular traction around 2010. Scholars such as Johan Bollen and Huina Mao suggested that social media data (Twitter data specifically) constitute a rich reservoir for sentiment-tracking analysis which can predict stock prices (Bollen et al., 2011; Mao et al., 2011), lending credence to the assumption that ‘the public mood and sentiment [as measured on Twitter] can drive stock market values as much as [normal] news’ (Bollen et al., 2011: 1). This research sparked a considerable number of studies, with some scholars identifying similar prediction abilities (Broadstock and Zhang, 2019; Siganos et al., 2014), others being more cautious (Kim and Kim, 2014; You et al., 2017), and still others proposing better methodologies in terms of the lexicons used for sentiment analyses (Oliveira et al., 2016).
During the early 2010s, several firms were established that would specialize in utilizing the connection between social media sentiments and capital markets. One of these firms, an asset-management firm specializing in social media analytics, is based firmly at the junction of behavioural finance and social media. Its central assumption is that sentiment data on social media capture ‘information that will provoke people to take action’, as the CEO put it.
This behaviour-generating dimension is indeed what makes social media data attractive, according to this informant. Distinguishing between leading and lagging indicators of price movements, the CEO argued that high-frequency traders might find that order-book data lead short-term price movements in markets. For example, if orders to buy a particular security suddenly pile up in the order book, this might suggest an imminent price increase, and high-frequency traders may, therefore, consider the accumulation of buy orders as a signal to buy the security quickly before others and sell it again if the price, indeed, rises, pocketing the difference (MacKenzie, 2018). In contrast, for many other market participants, who do not have access to costly high-speed technologies with which to respond to equally costly high-speed exchange data feeds on a sub-second timescale, order-book data are not necessarily useful as predictive indicators. Conventional fundamental indicators may also be of little use, the CEO argued, as they lag behind what has already happened. Looking at company earnings, for example, amounts to assessing past sales. By contrast, he said: We think that this media-based information, news and social media, really any kind of media, is capturing information that's likely to trigger behavior. [Compared with order-book price data] I would argue in that context that the news is even more of a leading indicator.
Then, how are social media news and commentary analysed? One informant we interviewed worked for a firm that collates tweets about approximately 4000 US stocks, which adds up to around 500 hundred million tweets daily. According to the firm's principal researcher, they are ‘looking for comments that are expressed on Twitter about how people view the stock, how people are trading the stock, and just their general commentary about the company’. This emphasis signals an important difference to how, for example, high-frequency trading firms would address data. According to the principal researcher, ‘We’re not measuring transaction activity [as registered in the order book], we’re measuring comment activity’, which might, subsequently, be tied to stock price changes in the order book, using this relationship to discern predictive sentiment indicators.
Of the more than 500 million daily tweets this firm has access to, its NLP algorithms filter out approximately 90% to reduce the noise from duplicates and spam re-tweets. It then computes an average sentiment for every remaining tweet capturing any positive, neutral and negative statements as well as variants of each and aggregates this to establish a sentiment score for each stock as described above. When analysing each tweet's content, the firm considers various shades of positive, neutral and negative statements, using a sentiment dictionary that includes approximately 20,000 uni-grams (single words) and 400 bi-grams (two-word phrases). For example, You can make various measures of positive statements—not just like good or bad. The example that we use a lot is like we’ll see tweets that say, ‘Apple gapped up $5 on the open. They’re having a good day’. It's a positive statement. We’ll see other tweets that would say things like, ‘Apple broke through a resistance level right after the open. It's going to run to this level. I bought 500 shares’. That, in a trading context, is a more positive measure of market statement than the first example, and we capture that type of granularity. Where the first one is moderately positive, the second one is very positive from a financial trading standpoint. (Principal researcher)
Against this background, the firm's NLP algorithms then calculate changes in sentiments for each stock: So, the absolute level of sentiment is not as important as the ability to detect changes from levels. It's similar to option pricing in a way […]. From a Black-Scholes framework, you can extract measures of how portfolios of derivatives will behave over time when things change in the market. All models are wrong, but some are useful! Black-Scholes is an example of that, and a basic method of sentiment analytics applied to text can yield a similar type of behavior. And so, what we do is, over a period of 24 h, we observe tweets for individual companies and stocks, and we collect those. This has been going on continuously since January 2012, and then we look at the aggregate sentiment from all the tweets that are collected on that interval. We’re doing it at one-minute intervals each day, and every minute we look 24 h back and aggregate to get a raw sentiment score. Then we take a normalization of that raw sentiment score over a 20-day lookback period at that time in order to bring everything into a Z-score normalized scale. We do that to allow us to compare companies that have large volumes of tweets to companies that have perhaps less volume of tweets—the classic example, and it's true, is that Apple, Facebook, and those type of stocks, […] they have large numbers of tweets every day. […] People aren't talking about tractors as much as they are talking about iPhones. (Principal researcher)
One of the challenges of using social media data as a predictor of the prices of securities concerns manipulative behaviours. For conventional market data, this type of problem might materialize in so-called ‘spoofing’, where a market participant (or their algorithm) submits a large number of fake orders to give the impression that the market is about to move in a particular direction and then exploits this (on spoofing, see, Borch, 2021; MacKenzie 2019; 2021b). For example, a spoofer may sit on a pile of stocks that they want to sell. By sending many buy orders to the market, the spoofer creates the impression that demand is rising which may lead others to increase their bids to buy. The spoofer would then sell at the new higher price and quickly cancel all the buy orders. With social media, manipulative tactics work slightly differently. Here, manipulation seeks to exploit the notion that social media content is leading price movements. A central manipulative scheme following this logic is known as ‘pump and dump’: by tweeting positively about a particular stock, others might be induced to buy it, which increases its price – in which case, the manipulator sells the stock. Such social media-based pump and dump tactics have been identified in the domain of penny stocks (worth less than $5) that are traded privately in a non-exchange mediated fashion (Murphy and Stafford, 2021), but our informants also noted their existence in relation to the exchange-traded stocks they specialize in. The principal researcher we mentioned earlier said that this is one of the reasons they filter tweets: ‘it's possible you could jam a stock, so you have to have a way to detect that, and we think that some of our metrics help do that’. Commenting on manipulative practices in the social media sphere, the CEO of the asset-management firm specializing in social media analytics said: Most of what we see are pump and dump schemes, but we see very, very sophisticated ones. […] We found that there are some groups of people or groups of robots, who post all of the same information at different times on different message boards. They use different usernames and what they do is they cultivate relationships with actual humans. They’ll post non-committal, benign messages like, ‘great call’ or ‘good job’, or ‘that's very interesting’, and what they do over time is that they send these random, but very generic messages to develop relationships with real humans and start following them. And so, after 12 months of developing a relationship, simultaneously, every one of them will promote the same stock, even though they never promoted a stock before. So, you see this very organized racket of very sophisticated pump and dump schemes in social media.
Even when such manipulative schemes are detected and filtered out, there is still the question of whether and to what extent social media sentiment analytics can, in fact, be exploited for investment purposes. In other words, how useful is this when it comes to predicting stock prices? As mentioned, the academic literature suggests that some predictability can be derived, providing opportunities for various kinds of investment strategies. Therefore, it is useful to turn to the investor side and consider how investment firms conceive of alternative data.
Extracting upstream fundamentals and repurposing sentiment data
Although some investment firms seem to base their business models primarily on alternative data, the social media sentiment analytics firms we interviewed rather saw alternative data as being a part of a larger reservoir of relevant data. In the words of the earlier-mentioned principal researcher, ‘I don't believe any hedge fund would trade solely on social media data – I would hope not! But it is a component of a broader strategy’. Reflecting on this, although alternative data is the talk of the town in the world of investment management, many practitioners have reservations about the actual utility of satellite imagery, social media data, geolocation tracking data and so on. As argued by the chief scientist of a commodity trading advisor, ‘the only people guaranteed to make money off of alternative data are the people selling it, and if you buy a dataset, there is no guarantee it is going to unlock a hidden new thing for you’. Despite being sceptical about the real value of alternative data use, this chief scientist stressed that he was not altogether dismissive of the use of nonstandard data sources. Contrarily, he believed that investment firms must explore alternative data sources in one way or another to keep track of developments in the industry and not fall behind the competition. Whether convinced about the potential of utilizing alternative data or not, investment firms arguably need to keep tabs on the development of the field, which also entails gaining familiarity with machine-learning techniques that can ease the processing of such data.
A quantitative analyst working as the head of client business at the London offices of a large US hedge fund said that ‘we want to build a technological infrastructure capable of harnessing all the world's data, and to be able to infer useful information from it’. Echoing the notion that alternative data may be leading rather than lagging indicators of companies’ performance, this firm would search for signals in data that would likely eventually end up in financial statements, balance sheets, and so on. They referred to these data sources as ‘upstream fundamentals’ and their reason for heading upstream, according to the quant, was ‘to capture the data before they reach the financial statements, etc.’ ‘Cash flow statements’, he explained, ‘come from sales data, so if we can capture the sales data early, it can inform us about cash flow statements [prior to their release]’. Hence, the firm basically attempted to harness and render usable data that will eventually constitute standard fundamental data, which allowed it to make informed investment decisions before the economic condition of a firm is laid out in its financial statement. In other words, the financial statement is a lagged indicator of the state of a given firm, and harnessing alternative ‘upstream fundamentals’ indicates what this state might look like prior to the release of the financial statement. This gives the hedge fund an opportunity to make bets before the release of fundamental data makes an impact on prices. Hence, it is a matter of tracking backward and patching together data signals that can shed light on the condition a firm or an industry is in before it dawns on other investors and perhaps even the firms and industries themselves.
Interestingly, our interviews also suggest that alternative data might be used in ways that diverge from how social-sentiment analytics providers tend to present them, in effect leading to a further repurposing of data. For example, a quant working for a large hedge fund said that they were trading on public sentiment deduced from analyses of social media: So, there are these so-called ‘bulletin boards’. They are popular in the US, in Japan, and starting to pop up in Europe as well. These are [online] spaces where retail people post comments on stocks like: ‘I am bullish about Google because of blah blah blah. Buy Google!’ Or someone writes: ‘I think the new iPhone is trash. Sell Apple!’ and so on. Yahoo [Finance] is one of them.
Capturing content on internet messages or bulletin boards is not a new approach to information gathering in the financial market context. Academic experiments on such data have been conducted for quite some years (Antweiler and Frank, 2004). However, in the case of the large hedge fund, the social media data were used for more than mere experimentation. The quant explained that the data from the bulletin boards could be used in pursuit of certain quantitative strategies: The idea is that they [retail investors commenting on online bulletin boards] are not smart. It does not really matter whether they say the stock is going up or down. What matters is how many people pay attention to a certain stock. If a lot of people pay attention, then you bet against them.
So, here, the idea is not to treat alternative data as valuable fundamental information as is the case when, for example, satellite imagery of parking lots is used as a predictive indicator of future earnings. Rather, the idea is that social media data express noise, that is, that the information circulating on social media platforms has an erroneous view of fundamentals and that this noise can be exploited. What come to the fore here is a re-run of an old-school contrarian approach to investing that relies on small retail investors being wrong on aggregate. In popular market parlance, it is called trading against the crowd (Hansen, 2015; Souleles and Hansen, 2019).
However, recent events such as the GameStop episode in early 2021 also suggest that, regardless of whether retail investors get the fundamentals right, they may constitute a powerful group to be reckoned with and that alternative data are a means of doing that. Where the online community on the SubReddit site WallStreetBets tried and to some extent succeeded in squeezing short-selling hedge funds, the latter soon realized that they could predict the retail investors’ next moves and hedge themselves against them by using NLP algorithms to scour online communities’ content and tease out their next targets (Ade-Ojo, 2021).
Prospecting challenges
The financial industry displays an amazing level of inventiveness, which is a crucial engine in its continuous expansion. Think about the ingenuity and sheer imagination needed to bundle low-grade mortgages together and sell them as prime asset-backed securities. The ability to layer, combine, assemble and repurpose existing financial products, practices and types of data is constantly being honed by investment bank quants, hedge fund researchers, and index and exchange-traded products engineers. Alternative data only widen the realm of possibility, although those at the forefront of financial innovation are no longer the product-structuring investment bank quants, but instead data scientists sifting all sorts of standard and alternative data through their learning machines (Hansen, 2020, 2021). This ‘datafication’ (see, e.g. Mellet and Beauvisage, 2020) sweeping the financial industry not only involves an increased emphasis on data, data storing, data analytics, data management and so on; it is also accompanied by the extraction of disparate data sources and then a process of repurposing and re-inscribing data as financial data. Hence, datafication goes hand in hand with a process of financialization on the data level, indicating finance's appropriation of an array of data sources that can be rendered potentially valuable for trading and investment and risk-management purposes. This financialization through data appropriation not only concerns finance's growing influence on the economy, it also blurs the dividing lines between the financial, economic and societal realms. (Research on alternative data use in credit scoring demonstrates this development on an individual level as part of the financialization of everyday life, see Aitken, 2017; Bernards, 2019.)
Being this potentially inexhaustible open-ended category, alternative data – when processed by sophisticated machine-learning techniques – not only widens the scope of financial analysis, but it also raises governance and regulatory questions about how to manage such vast and variegated datasets. As an informant working on financial data in an organization developing and promoting data standards and best practices pointed out, the increasing use of alternative data ought to prompt firms, data providers, and regulators to consider questions about the origin of datasets, privacy, reuse rights and so on. He found alternative data difficult to anchor and properly categorize, because they basically encompass ‘everything else’ beyond standard market data. The alternative data space is, he said, ‘the wild west, and we have no bloody idea how to equate these things [alternative data sources]’. This lack of anchoring makes alternative data use more vulnerable to challenges of data ownership, origin and privacy than standard data sources used in finance, which have been thoroughly enmeshed in the institutional and infrastructural frameworks constituting and underpinning modern financial markets.
As Dourish and Gómez Cruz (2018: 8) argue, ‘data makes sense only to the extent that we have frames to make sense of them’, and these frames or anchors are always contingent on local conditions, cultural settings, and the moments in time when the framing happens. Thus, anchoring is often a process of re-contextualization of de-contextualized data; a process that can be highly challenging when dealing with a broad denominator like alternative data (on the challenge of re-contextualizing big data within the field of biology, see Leonelli, 2014). The instrumentalist data-science notion of prospecting departs from this context-sensitive idea of anchoring in that the purpose of prospecting is to ‘operate across localities, resolving tensions between global and local, big and small, and between available resources and potential outputs’ (Slota et al., 2020: 5). Unlike anchoring, prospecting is, in principle, a context- or domain-agnostic process. From an alternative data governance perspective, the issue is, as one of our informants pointed out, that individual alternative data sources are difficult if not impossible to equate. They are, as the definition says, nonstandard and thus, hard to label, box, and anchor. While the prospecting work carried out by vendors and other data extractors and curators is a standardization effort in its own right, the objective of this work is to render disparate data sources amenable to analysis using data-science methods, and not necessarily to increase the possibility for oversight.
The way in which data vendors turn alternative data into manageable and potentially valuable datasets is, therefore, a dual process of prospecting and assetization. It is an ordering and parcelling of alternative data into subcategories – as done by securities exchanges and other alternative data vendors – whereby finance-relevance is ascribed to each individual data source. The prospecting work thus serves as ‘a precondition for value extraction’ (Slota et al., 2020), that is, as a necessary precursor of the transformation of alternative data into assets. A less instrumental form of prospecting happens when users of alternative data, in our case sentiment data, articulate data usefulness and the limits to their use, which is a kind of framing and disentanglement process akin to the anchoring via narration presented by Dourish and Gómez Cruz. Labelling sentiment data as a supplement to other more conventional data sources, as noted by several of our informants, is, in and by itself, a framing of the data source and the scope of its usefulness.
Conclusion
Nonstandard data sources have been on financial professionals’ radars, especially hedge fund quants, and subjected to experimentation by academics for quite some years. However, with the availability of big data, the reduction in cost of storing them, and the refinement of the technical tools to process them, the use of alternative data has become more common in investment management over the past decade. It is no longer mainly considered a mere fad, although the label ‘alternative data’ is still shrouded in hype, and an interesting area for quirky quants’ wild experiments. Instead, alternative data are becoming integral to investment processes in many firms, which resonates well with the general data turn in the industry, propelled by decades-long processes of computerization and automation as well as more recent widespread adoptions of artificial intelligence and machine learning (Borch, 2021; Hansen, 2020, 2021; Hansen and Borch, 2021).
In this article, we have explored the notion of ‘alternative data’ and the use of such data by market participants, focusing on its standardization by prospecting and assetization which lead to a new financialization of data. We define alternative data as an open-ended and dynamic placeholder comprising all potentially finance-relevant data sources imaginable that lie beyond the scope of so-called standard financial market data (including order-book data). Thus, it is a vast and continuously expanding category that requires ongoing efforts to order and render processable this disparate body of data sources. By regarding standardization processes as a means of ordering alternative data – specifically through prospecting and assetization – and examining how practitioners commit to ordering practices, we show how such data are used and rendered usable. Alternative data extraction practices, ordering and use are, as we demonstrate, thoroughly entangled with and dependent on firms’ technological affordances, the calculative techniques they leverage in investing and trading. Hence, alternative data utilization is inseparable from the machine-learning analytics tools and computing power available to firms.
Focusing mainly, though not exclusively, on one specific source of alternative data, namely sentiment data, we demonstrate how such data are extracted and repurposed for investment management, and, in this process, rendered sensible and usable by practitioners. An important aspect of the framing of alternative data – in our case, sentiment data – is to view them as complementary to standard data sources or as an additional layer of analyses on top of conventional approaches such as fundamental analysis. Moreover, the embrace of alternative data as valuable resources in investment management and trading firms’ quest for an edge in the markets, has turned alternative data and analytics provision into an independent business thriving on financial firms’ investments in alternative data as well as the general datafication of everything. This development is driving data financialization, which seems to be amplified by the economic prospects of transforming variegated chunks of data into tradable assets or extracting from them valuable market insights.
Footnotes
Acknowledgements
We thank Bo Hee Min for preparing Table 1 and Nanna Bonde Thylstrup, Louise Amoore, and Mikkel Flyverbom for the valuable comments on an earlier version of the article. We also thank our informants for taking the time to discuss their work with us as well as the reviewers and Big Data & Society-editor Matthew Zook for their suggestions and constructive criticism. Finally, we thank Georgina Kate for careful copyediting.
Declaration of conflicting interests
The author(s) declared no potential conflicts of interest with respect to the research, authorship and/or publication of this article.
Funding
The author(s) disclosed receipt of the following financial support for the research, authorship and/or publication of this article: This work was supported by the European Research Council (ERC) under the European Union’s Horizon 2020 Research and Innovation Program (Grant No. 725706) as well as the Independent Research Fund Denmark (Grant No. 9131-00115B).