
Abstract
This paper reports on a two-year, field-based study set in a charter management organization (CMO-LAX), a not-for-profit educational organization that operates 18 public schools exclusively in the Black and Latinx communities of South and East Los Angeles. At CMO-LAX, the nine-member Data Team pursues the organization's avowed mission of making public schools data-driven, primarily through the aggregation, analysis, and visualization of digital data derived from quotidian educational activities. This paper draws on the theory of racialized organizations to characterize aspects of data-driven management of public education as practiced by CMO-LAX. I explore two examples of how CMO-LAX shapes data to support racial projects: the reconstruction of the figure of chronic truants and the incorporation of this figure in a calculative regime of student accomplishment. Organizational uses of data support a strategy I call productive myopia, a way of pursuing racial projects via seemingly independent, objective quantifications. This strategy allows the organization to claim to mitigate racial projects and, simultaneously, to accommodate them. This paper concludes by arguing for approaches to research and practice that center racial projects, particularly when data-intensive tools and platforms are incorporated into the provision of public goods and services such as education.
This article is a part of special theme on Data, Power and Racial Formations. To see a full list of all articles in this special theme, please click here: https://journals.sagepub.com/page/bds/collections/dataandracialformations
Introduction
This paper reports on a two-year, field-based study set in a charter management organization (referred to as CMO-LAX
1
), a not-for-profit organization that operates roughly 20 public charter schools located exclusively in the Black and Latinx communities of South and East Los Angeles. At CMO-LAX, the nine members of the Data Team pursue the organization's mission to make public schooling data-driven, primarily through the aggregation, analysis, and visualization of digital data derived from quotidian educational activities. In a 2017 interview, Ella, Student Data Systems Analyst—longest serving member of the team and a Latina resident of one of the neighborhoods her organization serves—reflected on what it means for a public-serving organization to enact a data-driven ethos: The way I conceptualize it is of course you have the data, and the data then gets pushed to the teacher, to the student, to the parent and then that impacts the community, and that's how I see it and I think that's what keeps me at CMO-LAX…I think a lot of the times, I reflect back on my own experience of my parents and them not really going to my parent conferences, or not really understanding what I was doing, or not being able to help me with my homework. How do you translate that into data?
Ella's statement is instructive for a number of reasons. First, it demonstrates a sentiment frequently expressed by CMO-LAX's data professionals with respect to the organization's mission, how care applied to data work functions transitively, and how data “pushed” to students and parents “impacts the community” for the better. Ella's comment also ends with a provocative question about translation via data. She aspires to a kind of data work that could capture the complexity, contingency, and specificity of experience. Ella also links this effort to persistent shortcomings, particularly to resources that families should contribute to educational activities, a common pedagogical commitment of many schools that serve racialized and minoritized 2 communities (Dishon and Goodman, 2017). Conspicuously, in all of my interviews, data professionals at CMO-LAX frequently reiterated the need for more data to accomplish their organization's mission. As this paper will argue, translating the organization's mission into data called for certain commitments about individual responsibility and required moving consideration of racial dynamics out of view. Translating the world into data called for a strategy of productive myopia.
As Benjamin (2019) writes, the habitual, deliberate, and systematized avoidance of race in technical systems should not be reduced to error. Such avoidance is productive, “in the generic sense of producing things, not in the normative sense of necessarily beneficial” (105). The analysis that follows enacts Benjamin's analytical stage directions, foregrounding what data professionals at CMO-LAX so frequently avoided: the racial dynamics of data work applied to public education. This paper draws on Ray’s (2019) theory of racialized organizations to characterize the aspects of data-driven management of public education. I coin the term productive myopia to name an organizational strategy that trades on the allure of quantitative practices to pursue and legitimate racial projects. I explore two linked examples of how CMO-LAX shaped data to support racial projects: the reconstruction of the figure of chronic truants and the incorporation of this figure in a calculative regime of student accomplishment. The empirical work in this paper traces the transit of data through a few of its material and organizational iterations to show how—irrespective of the intellectual, professional, or ethical commitments of individual workers—CMO-LAX effectively built race into its data analyses, even as it pursued a stubbornly color-blind approach to data work. From an organizational perspective, CMO-LAX presented these procedures as narrow, technical transformations. Data analysis at CMO-LAX traded on notions of technological superiority with respect to other kinds of organizations, while it insisted on a rather constrained set of techniques focused on individual behavior. Whether the data work touted by this organization produced better education than any other organization was expressly beside the point: the strategy of productive myopia effectively removed any such question from organizational view. This strategy allowed the organization to claim to mitigate racialized outcomes in the “intensely segregated schools” it administered, and, simultaneously, to accommodate the racial project that creates, funds, and maintains such segregated schools (Orfield and Jarvie, 2020).
To flesh out the concept of productive myopia, the next sections draw together work in critical data studies, education, and sociology of race. Throughout, I show how concepts and tools from the sociology of race have been neglected in critical data studies, particularly in empirical works that explore the institutional, organizational, and computational settings where the impetus for public service to become data-driven meets professional practice inspired by the tech sector.
Datafication, critical data studies, and education
Datafication names the contemporary historical, commercial, and cultural character of technological change, the ascendancy of forms of “metric power” that increasingly shape and mediate sociality (Beer, 2016; Leurs and Shepherd, 2017; Sadowski, 2019). Through allusion to scientific work on data-intensive computation and simulation, early works on datafication tended to characterize the increasing ambit of such technologies as novel, transformative, and inevitable (Gray, 2009; Van Dijck, 2014). In response, social scientists and other kinds of researchers developed an approach increasingly known as critical data studies, an emerging body of research that seeks to “interrogate all forms of potentially depoliticized data science and to track the ways in which data are generated, curated, and how they permeate and exert power on all manner of forms of life” (Iliadis and Russo, 2016). Critical data studies resist the totalizing narratives of datafication, questioning the logic, scope, consequences, epistemologies, and ethics of data-intensive, networked computation (Boyd and Crawford, 2012; Kitchin, 2014; O’Neil, 2016). Central to this work is the commitment that data are never “raw” (Gitelman, 2013): data are created, maintained, and interpreted by the application of labor and expertise (Espeland, 1997; Passi and Jackson, 2017; Peters and Bulut, 2011); they embody powerful cultural logics in the manner of other symbolic systems of representation (Dourish and Gómez Cruz, 2018; Hall et al., 2013); and their meaning is highly contingent and situated, determined according to the values and priorities of interested parties (Borgman, 2015; Knobel and Bowker, 2011; Sadowski, 2019; Shilton, 2012).
Research in critical data studies has frequently warned of discrimination and bias (Barocas and Selbst, 2016; Hoffmann, 2019) and the risk of “automating inequality” in ways that surveil, police, and punish vulnerable groups (Eubanks, 2017). Researchers have attended to the way computational intermediaries redistribute authority in civic or pubic-serving organizations (Leurs and Shepherd, 2017; O’Neil, 2016). Civil and municipal leaders seek to automate and rationalize complex decisions about resources, ethics, and goals via “accelerated knowledge that enables organizations to be increasingly responsive, nimble, and reactive to market pressures” (Beer, 2017: 22). In such organizational settings, increased expectations to incorporate data-intensive computational technologies and bureaucratic inertia manifest in uneven, contradictory, or incoherent uses of data (Horgan and Dourish, 2018). These idiosyncratic workarounds shift discretion from established chains of authority to the interpretive judgments to data professionals, including data scientists, developers, programmers, technicians, and other IT workers (Zouridis et al., 2020). Data-intensive computing flourishes in minoritized communities: in provision of public services by government agencies, in bail decisions by the criminal justice system, in threat assessment by law enforcement, and, increasingly, in public education (Benjamin, 2016; Eubanks, 2017; Selwyn, 2016; Stop LAPD Spying Coaliton and Free Radicals, 2020; Williamson, 2016).
Critical data study approaches have been applied fruitfully to education, where they build on previous critiques of the overuse and ritualization of various aspects of quantification in the administration of schools (Ambrosio, 2013; Au, 2016; Ball, 2001; Elton, 2004). From a critical data study perspective, the impulse to become “data-driven” creates a self-reinforcing loop that positions data analysis as the solution for educational problems and presents education as a series of technical problems ready to be solved via computation (Perrotta and Williamson, 2016). That is to say, there is little evidence that schools become data-driven in response to demands from the communities they serve. Data work applied to learning represents a partial and incomplete reordering of education wherein “learners are positioned as prized products, from which valuable behaviors can be extracted and consumed by ever-improving algorithmic systems” (Knox et al., 2019: 5). In American public education, the pursuit of “quantitative objectivity” masks the continuous subordination of racialized groups (Gillborn et al., 2018: 158). Education research, practice, and policy in the US incorporates many quantitative practices that tacitly presume the “permanent inadequacy” of racialized and minoritized subjects (Butler, 1996: 199).
Particularly in so-called urban schools—a term of art from education research that refers to racially segregated, lower socio-economic status public schools—aspirational associations with the glossy and rich worlds of tech impel many forms of infrastructural investment meant to promote access to valorized technologies, to create educational or career pipelines for minoritized communities, or to more equitably distribute the perceived societal benefits of computing (Crooks, 2017; Dishon and Goodman, 2017; Lipman, 2011; Pearman and Swain, 2017). Despite the ways that public investment in data-intensive computation demands resources from already resource-constrained schools and can contribute to abusive surveillance practices, community organizers and other stakeholders have only rarely succeeded in subjecting the spread of data-intensive tools, platforms, and techniques in urban schools to public scrutiny (Browne, 2015; Crooks, 2019; King et al., 2016).
While the particulars of data-intensive computation applied to public life—in education and in many other civic domains—have clear implications for the management of racialized subjects by state and capital, the imbrication of race and computing has been pursued somewhat haltingly in critical data studies. Unlike other cognate subdisciplines that take an interest in the social consequences of computing technologies such as science studies (Benjamin, 2016, 2019; Nelson, 2016), media studies (Coleman, 2009; Nakamura, 2014; Nakamura and Chow-White, 2012), Internet studies (Daniels, 2013; McMillan Cottom, 2020; Noble, 2018; Noble and Tynes, 2015), social informatics (Brock, 2019), or human–computer interaction (Ogbonnaya-Ogburu et al., 2020), the emerging body of work in critical data studies has infrequently engaged with sociological tools for the study of race. In a study of predictive models developed to nudge university students to more optimal outcomes, Whitman (2020: 10) writes, “data, students, and behaviors are imprecisely matched and subject to institutional pressures and sociotechnical limitations,” such that many discriminatory outcomes are inappropriately linked to individual student behaviors. In this way, data, models, and code can be deployed specifically to prevent or obscure the description of racial dynamics, a tendency I describe later in this paper.
Theoretical framework: Racial projects and racialized organizations
Although critical data studies treat datafication as an emergent cultural, economic, and political turn, historians and scholars in science and technology studies have demonstrated the centrality of race and data to the constitution of public life in the US (Crooks and Currie, 2021); for example, Muhammad (2010) describes the 19th century origins of “racial data,” quantified description of Black abjection in the form of crime, health, marriage, and employment statistics, and characterizes these quantifications as foundational to both modern sociology and the contemporary state. The ongoing use of data by organizations and institutions operating in (and reproducing) a racially stratified civil sphere can be explained by the related concepts of racial project and racialized organizations.
While race is a term of pre-scientific origins that contemporary scholars of all kinds have used as a lens or object of study, racialization is a newer term, one frequently attributed to the sociological theory of racial formation (Ferguson, 2020; Martinez HoSang and LaBennett, 2020). Building from the historical explorations of political struggle, popular culture, and public policy in the US, Omi and Winant (2016) define racial formation as “the sociohistorical process by which racial categories are created, inhabited, transformed, and destroyed” (379). From this perspective, race is socially constructed (as opposed to naturally occurring) and politically contested (as opposed to biologically deterministic). This theory rebuts any potential biological warrant for racial categories, instead presenting such categorizations as historically produced for the benefit of some at the expense of others. Hegemonic racial formations precede and shape individual subjectivity and, like all systems of classification, confer powerful advantages upon their beneficiary classes (Bowker and Star, 1999). Racial categories then do not originate from any stable set of naturally occurring, in-group characteristics; rather, racial classifications “are intimately linked to politics and power that rely on coercion (i.e. violence, threats, and pressure) and consent for their existence” (Keaton, 2018). Racialization describes the work of how racial formations govern the experiences of individuals, groups, the state, and other collectivities.
Of critical significance to the analysis of the highly skilled interpretive work of data professionals that follows, racialization occurs simultaneously across multiple scales and modalities, wherever and whenever “human bodies and social structures are represented and organized” (Omi and Winant, 2016: 380). Racial formation theory prioritizes the concept of the racial project: A racial project is simultaneously an interpretation, representation, or explanation of racial dynamics, and an effort to reorganize and redistribute resources along particular racial lines. Racial projects connect what race means in a particular discursive practice and the ways in which both social structures and everyday experiences are racially organized, based upon that meaning (380, italics in original).
Racial projects—as well as the implicated racial categories they animate and enforce—are sites of struggle, where the interests of competing groups, systems of language, and modes of representation collide. The state is a privileged site of racial projects, the place where law, science, citizenship, media, and protest meet in complex conflicts with lasting social consequences for the allocation of vital resources (Ferguson, 2020).
Racial formation theory historicizes an ongoing redefinition of racial categorizations, 3 placing particular emphasis for the current state of racial formation on the post-civil rights era in the US. In the public response to the mass movements of the 1960s and a number of resultant cultural and political pressures, color-blind racism developed as a tactic for entrenched powers to continue to distribute capital according to racial hierarchies, especially as it concerns state investment and disinvestment. Color-blind racism “rationalizes the status of minorities as the product of market dynamics, naturally occurring phenomena, and their alleged cultural deficiencies” (Bonilla-Silva and Dietrich, 2011: 191). Color-blind racism thrives in the tech sector, including higher education in science, technology, engineering, and mathematics, where it “helps sustain an analogous set of beliefs about tech industry leaders’ own White racial innocence and blamelessness in a racially unequal society” (Daniels, 2015: 1383; McGee, 2020).
Recognizing the utility of racialization and racial projects to organizational studies, Ray (2019) coins the term “racialized organization” to characterize the central, constitutive role of racial projects in organizational life (31). At the center of Ray's argument is the way that organizations wittingly or unwittingly justify the appropriation of resources in terms of ideological schema that support the biological or cultural superiority of Whites (32). Ray places this distribution of resources at the center of organizational life itself and shows how “meso-level social structures…limit the personal agency and collective efficacy of subordinate racial groups while magnifying the agency of the dominant racial group” (36). Ray then develops four general tenets about racialized organizations: they shape the exercise of agency; they legitimate the unequal distribution of resources along racial lines; they treat Whiteness as a credential; and they frequently use the difference between formal rules and practices to accomplish the previous tenets. In their hiring practices, in their pursuit of their missions, and in their local customs, organizations pursue racial projects, especially as these organizations interact with the state (44). Identifying racial projects at the level of the organization brings into question how “racialized organizational processes of unequal surveillance and punishment, coercion and consent, shape the subjective sense of future possibility” (47). Beyond organizational studies and sociology, Ray's theory of racialized organizations has been cited in works on, among other topics, algorithmic fairness (Hanna et al., 2020), public health disparities (Garcia et al., 2021), and education (Lerma et al., 2020; Vargas and Villa-Palomino, 2019).
A theory of racialized organizations sets up a correspondence between critical data studies and racial formation: just as Ray located processes of racialization at the organizational level, I am arguing that data practices within organizations likewise contribute to such processes. Although a central concern of critical data studies has been to identify and potentially address forms of discrimination, such concern has not specifically attended to racial formations and racial projects. Racialization is at work in uses of computing technologies, certainly, but also in the impetus to become data-driven. In the next section, I deploy the term productive myopia to highlight the ways that data practices support racial projects and depend on racial formations. Productive myopia describes those practices that justify the distribution of resources and services according to racial hierarchies via an appeal to data, data visualization, and data-drivenness. It is a form of color-blind racism at the organizational level, one that benefits an organization itself (as opposed to the public or the community) by producing an insatiable demand for data.
Productive myopia can be thought of as certain industriousness with data that supports color-blind racism at the organizational level. In the 20th century, educators, reformers, and government official pursed policies inspired by Social Darwinism and other forms of race science that aimed to improve minoritized subjects via deracination, the forced shedding of culturally specific forms of speech, action, and dress in favor of supposedly neutral (i.e. White) customs (Martinez HoSang and LaBennett, 2020). At its core, productive myopia amounts to similar deracination of subjects via their representation as data.
Methods
This paper reports field work conducted between 2016 and 2018 at a not-for-profit charter management organization (CMO) in Los Angeles, California (Crooks, 2017). The organization dedicates significant resources to the maintenance of records related to current primary and middle school students (kindergarten through eighth grade) and at least 3000 graduates. A CMO governs a network of schools in place of a state-approved school district: CMOs typically receive public funds and perform centralized administrative functions for their schools, such as budgeting, reporting, staffing, and so on (Goodman, 2013; Mora and Christianakis, 2011). Charters are an especially popular form of public education reform in Los Angeles, home to 225 charter schools, more than any other district in the US (Blume, 2019). CMO-LAX serves minoritized, lower socioeconomic status (SES) communities exclusively: according to CMO-LAX's website, 99% of students identify as “Black and/or Latino.” Likewise, 91% of its students qualify for free or reduced lunch, a standard indicator of poverty in education research and policy. CMO-LAX's schools, like many charter schools in Southern California, are intensely racially segregated: to a great extent, White and Asian students attend one set of public schools, while Black and Latinx students attend another (Erickson, 2016; Frankenberg et al., 2019).
CMO-LAX promotes itself as a data-driven alternative to public schools, as an innovator. In a brochure, CMO-LAX writes, “By measuring what matters and using real-time data to assess student achievement, teachers can maximize the impact of instructional technology on student growth.” The same document promises that CMO-LAX will also contribute to the dissemination of best practices. This conspicuous invocation of putatively impartial and depoliticized “data-driven decision-making” functions as a sign of organizational quality, competence, and future-orientation, a selling point in a fraught marketplace of public, private, and quasi-public education that working-class communities of color in Southern California must navigate (Buras and Apple, 2005; Neff et al., 2017; Pearman and Swain, 2017). What is of interest in this paper is not the advisability or inadvisability of charter-based school administration or the veracity of the laudatory claims of marketing departments (Seaver, 2017), but the specific ways that data-drivenness manifests in public service and how it operates with respect to racial projects.
At the time of my study, eight full-time employees and one intern formed the Data Team; the group itself was formed of two sub-teams, each supervised by the Director of Data and Analytics. The Analytics Team dealt primarily with aggregating or analyzing data, typically working on tasks such as creating data pipelines or addressing organization-wide questions assigned to it by executives. The Student Information Team, on the other hand, worked more closely with schools and supervised the way that data were recorded in the organization's centralized student information system (SIS), a form of commercial, web-based database. Each member of the team submitted examples of their work and agreed to a follow-up interview to comment on the work they had submitted. In addition, I joined the team's monthly all-hands staff meetings over a period of one school year and attended professional conferences with team members. Several team members agreed to follow-up interviews over a period of six months. I also collected examples of code, writing, and data visualization produced by team members. One team member declined to participate in this research (Figure 1).

Breakdown of charter management organization (CMO-LAX) data team personnel. The number in parentheses notes the length of tenure in 2018.
CMO-LAX is a racialized organization according to Ray’s (2019) original articulation: although the organization serves Black and Latinx students, the organization's leadership (in terms of executive positions) is majority White; this structure recurs on the Data Team as well, where the high-paid and highest-ranking positions are not held by Black or Latinx workers. My interest here is not in the racial dynamics within the organization's employment hierarchy, but in how quantitative practices engage (or refuse to engage) racial projects. Data work, like other kinds of bureaucratic processes, is race work, not only due to the fact that virtually all of the subjects in CMO-LAX's database are people of color, but also by virtue of the interpretive and calculative mechanisms which preemptively translate racial projects into questions of computation. To demonstrate how productive myopia functions, I summarize two key moments of data's transit through CMO-LAX's organization: the construction of “real-time” chronic truants and the incorporation of that number into a series of calculations about “student success.”
Making real-time truants
Data work at CMO-LAX involved capturing data about students and their families, but only in those forms that satisfied preexisting normative commitments about data-drivenness and about the relationship between individual behavior and educational outcomes. Specifically, the “real-time data” that CMO-LAX's promotional materials touted became real only when converted to some format that could be hosted on a commercial platform and thereby abstracted from the racialized subjects it described. The Data Team's analysis and visualization looked for patterns in data that would shape organizational or pedagogical behavior, but it did so not by any special acuity or analysis, but by transforming traditional sources and types of data into newer formats.
In a 2017 interview, CMO-LAX’s Chief Student Information Officer, Nina, explained that what the organization really needed to fulfill its mandate to become data-driven was data about behavior. As the highest-ranking permanent staff member of the Student Information sub-team, Nina's work concerned standardizing procedures and data fields to record student-level information. California's public K-8 schools must report many forms of student-level data to regional, state, and national authorities: such reporting has been a feature of public education for decades and many efforts at establishing national education standards over the past 30 years dictate requirements for reporting (Egalite et al., 2017; Holbein and Ladd, 2017). She imagined a way of collecting needed data without the active intervention of her and her team: My goal would be to have the flow of student information happening very naturally and for all of that to be like a well-oiled machine, so that as many people as possible can focus on kids…I want collection to be part of the everyday process, where it's just super clean and smooth.
Nina indicated that the Data Team's work is extensive and demanding: where the value of such labor accumulated is not stated, but according to Nina's interview, these resource demands might possibly stand in the way of “focus on kids.”
At the time of the interview excerpted above, Nina had just completed a project focused on identifying chronically absent students. Researchers argue that the causes of chronic absenteeism 4 are complex, but include a combination of factors, including environmental, familial, and individual characteristics as well as school type (e.g. charter vs traditional (Lenhoff and Pogodzinski, 2018). However, chronic truants came to be and whatever reasons accounted for this status were not of interest to Nina's project. Getting data about chronic truants stored in the correct form on the correct platform was the focus. This task proved technically difficult and intellectually challenging because, as Nina explained it, finding out which students had missed enough school to be considered chronic truants “involved a lot of trial and error, and some guesswork.”
My initial results were not matching what I knew about student attendance rates at our school. Specifically, my report was reflecting chronic absentee rates that were lower than what I knew them to be. In order to get the correct figure, I had to take raw data (i.e. students’ attendance records per each date of enrollment), filter out anything other than “presents,” and pull in the number of days each student was enrolled over the course of the year. While this seems simple, attendance data is very nuanced in our student information system, so the process to get it right was slow and painstaking at times. Fortunately, our team has been able to create a dynamic dashboard in our data hub that reflects chronic absentee rates at any given day.
Nina's evaluation of the process she had (“slow and painstaking”) as opposed to the kind she wanted (“super clean and smooth”) corresponded to a distinction visible in the interface as a division between dashboards that summarized “enrollment” and those that related to “attrition/behavior” (see Figure 2). Expressly, Nina's work involved eliminating ambiguity in data, reformatting, recounting, and recalculating to eliminate undesirable nuance.
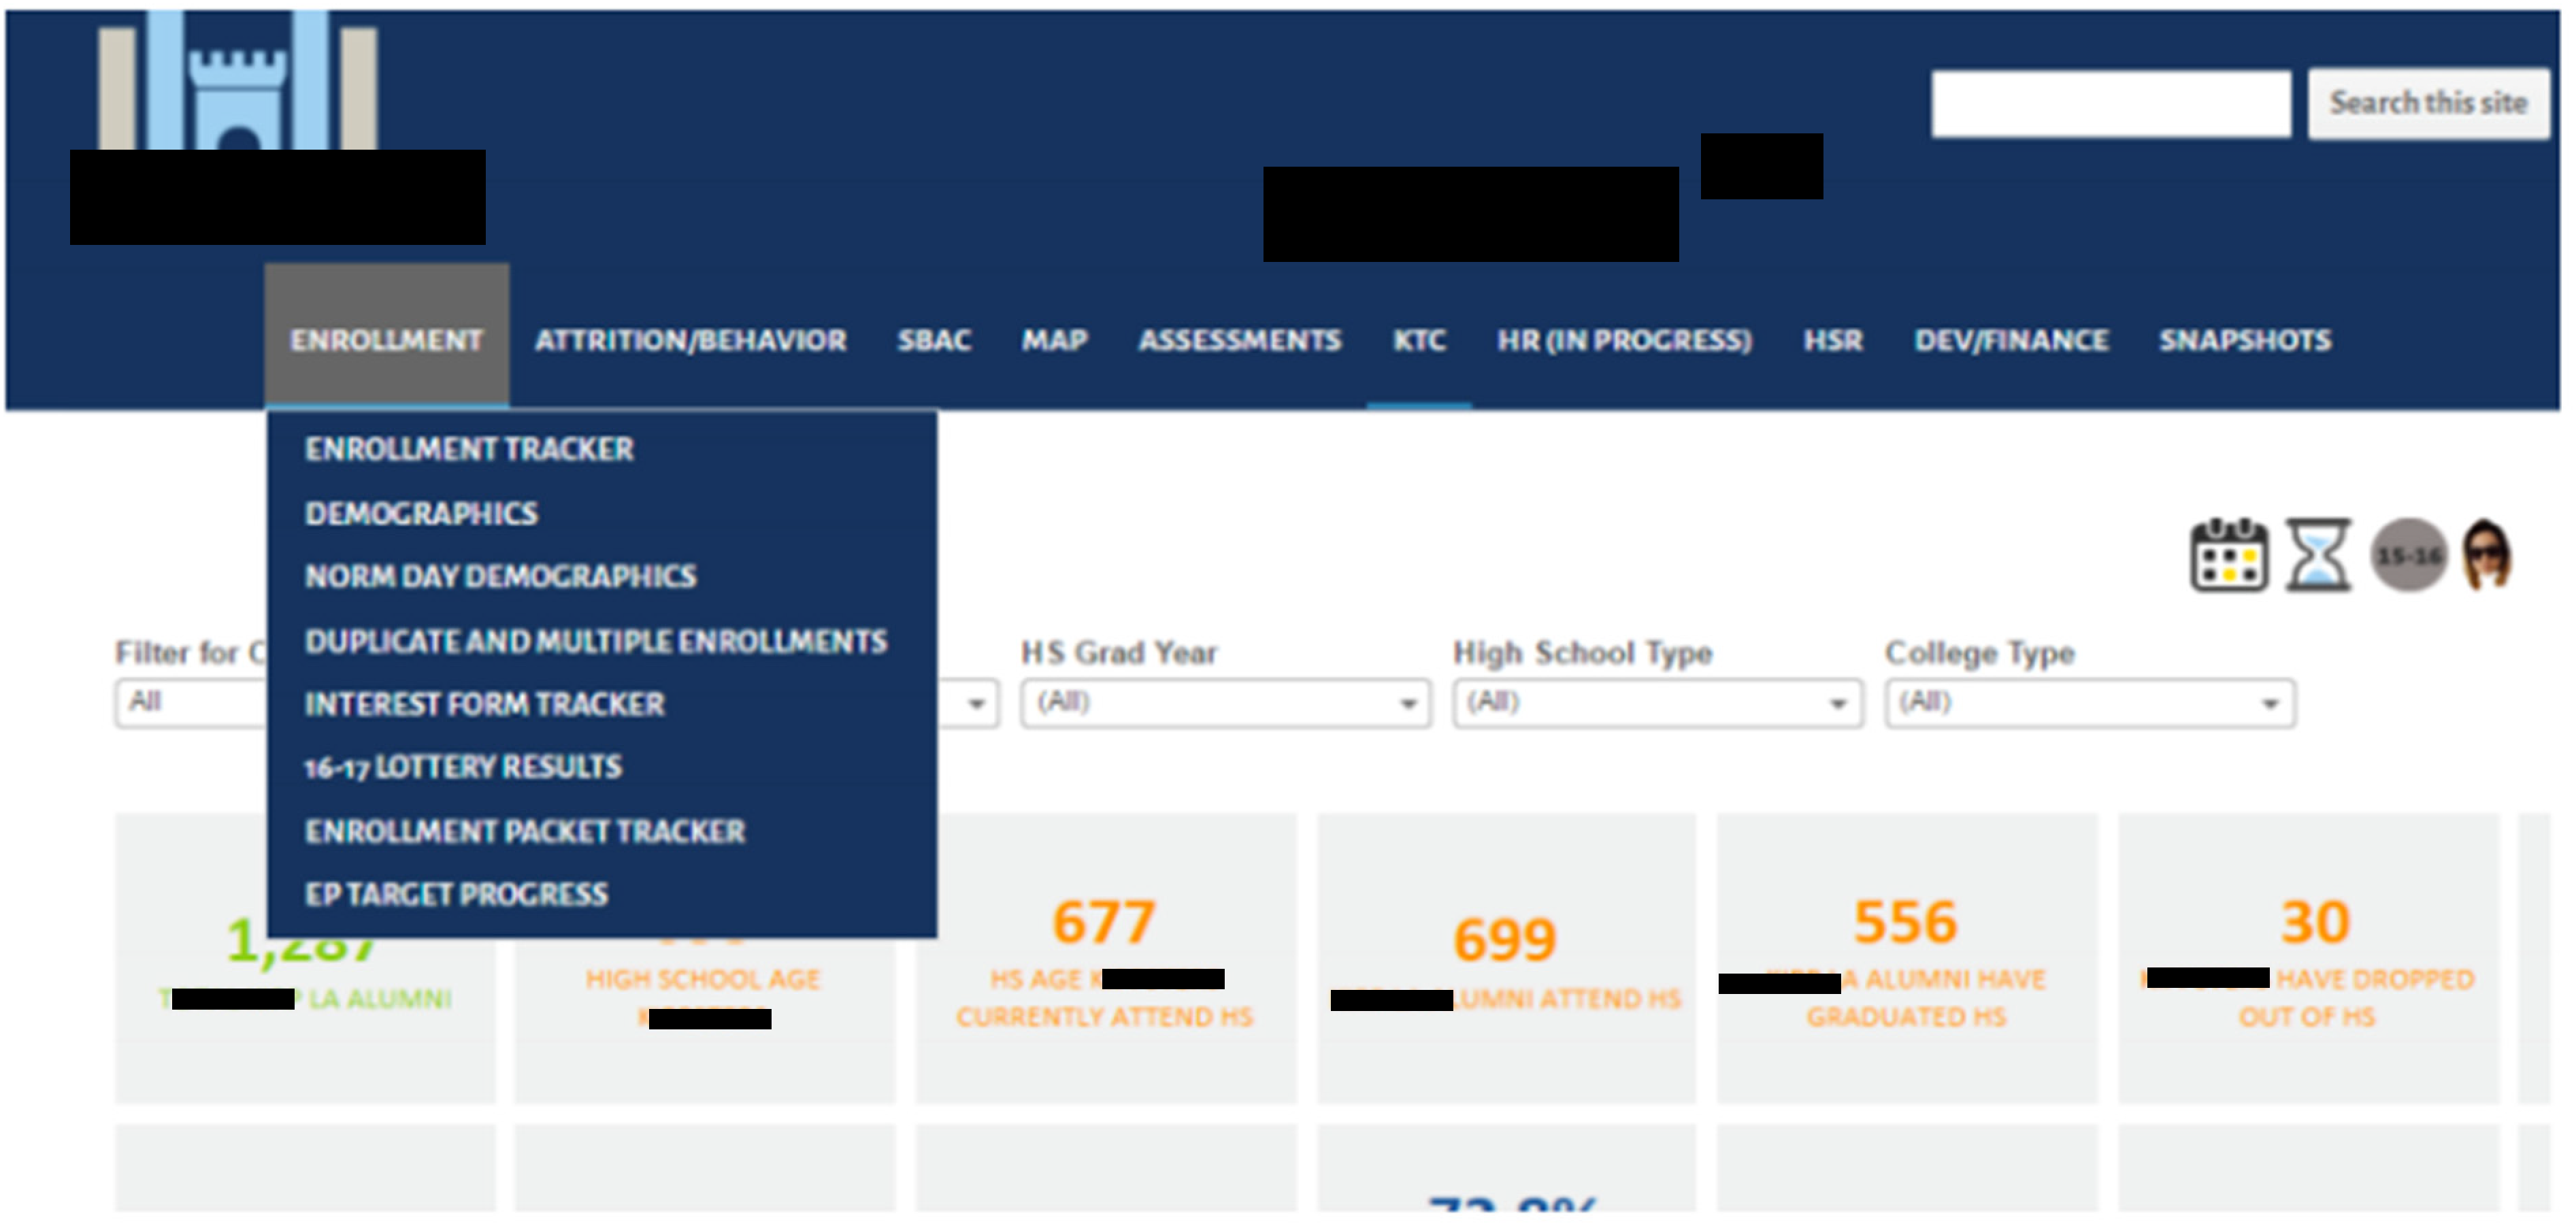
The data hub in 2018, a work in progress. At this time, it included over 120 dashboards for various audiences, none of which included students, parents, or the public.
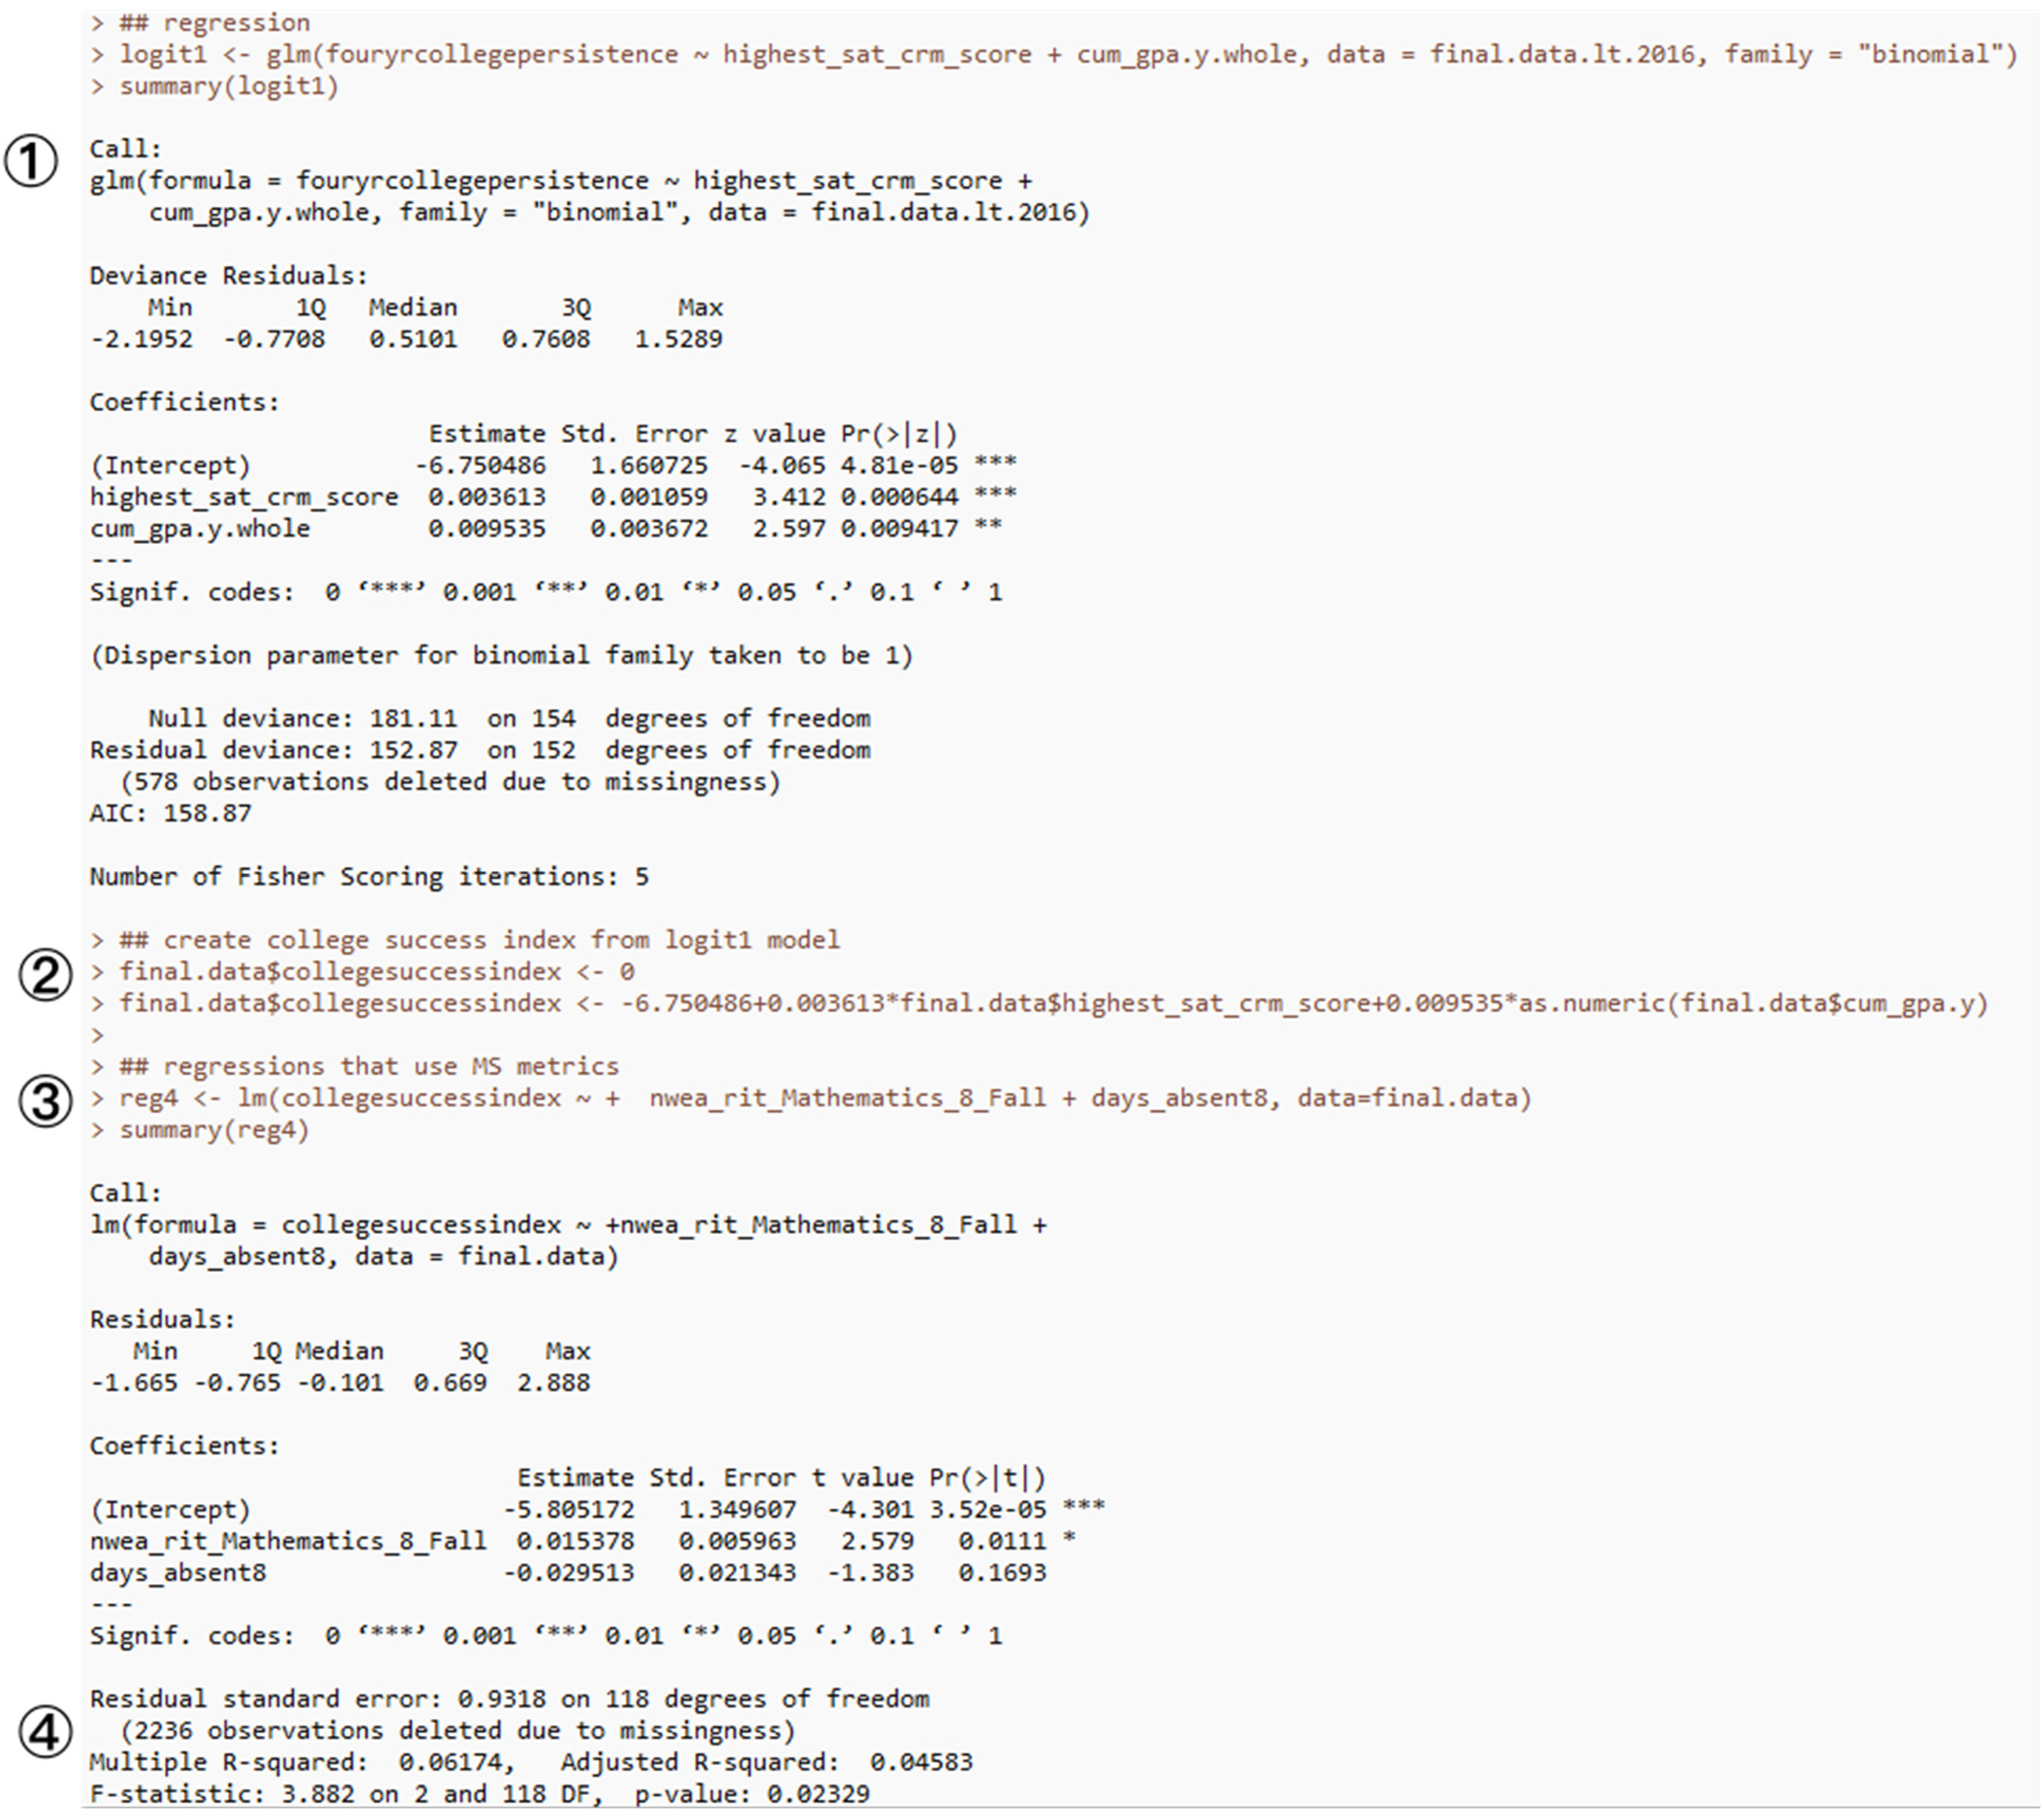
A program written in R with Gia's comments. The code tries to predict “college success” based on grades and test scores of junior high school students. Labels at left are used to refer to the specific sections of code.
Nina's supervisory position gave her professional responsibility for the ongoing collection of extensive demographic descriptions of all of CMO-LAX's current and former students, including age, race, address, place of birth, citizenship, grades, and attendance. Likewise, her database contained information about students’ families: the size, number, and marital status of household members, the education level of parents/guardians, annual family income and so forth. In short, Nina's take on the utility of different forms of data, repeated frequently in my interviews with other member of the organization, was that the data they had took the wrong shape, that it did not track the right things, and that it did not lend itself to explaining the kinds of things they wanted to know (Kelly, 2017). In the case of nearly all my work with CMO-LAX's data, one aspect was routinely shunted out of view: the race of the people described by the CMO's database, 98% of whom were Black or Latinx. In this way, data work at CMO-LAX devalued descriptions of race in their analyses (data that was “just demographic”), but attributed explanatory power exclusively to data that stood in for individual behavior. In short, data aggregation, analysis, and visualization produced and framed a completely deracinated explanation for the figure of the “chronic truants” that this work was creating, partly through “painstaking labor” and “guess work.”
Of note here is that Nina's difficulties did not concern whether or not schools had taken attendance and reported correctly: the issue concerned the ability of the Data Team to incorporate such banal and frequently analog modes of data collection into its “data-driven” apparatus. As Nina described it, she and local school administrators had a general sense of when and where absenteeism was a problem. Nina supervised how school administrators did their reporting, how the fields of CMO-LAX's SISs were configured, and how graduates and their families would be represented in the database (“raw data”). However, this “painstaking” work was merely preparation for something “dynamic.”
Later, Nina showed me the fruits of her months-long attempt to make reports of chronic absenteeism useful: a series of dashboards displayed in a data hub available to select members of the organization, including a series that incorporated reports of chronic absenteeism. Nina gave me a tour of this data hub, a set of 120 interactive data dashboards constructed by Nina's counterparts in the Analytics sub-team.
Whitman (2020) described the work of university-based data professionals tasked with collecting, aggregating, and analyzing data for the purposes of altering student behavior. Data professionals valued data that described behavior over demographic data, in effect begging the question of how certain forms of individual action might influence desired academic outcomes. At the same time, the author describes how those same data professionals understood many aspects of student success to be tied to race, wealth, sex, or gender, characteristics that did not suit the organization's emphasis on individual behavior. This dynamic repeated at CMO-LAX.
From an organizational perspective, CMO-LAX's productive myopia involved altering existing data collection regimes to accommodate newer tools and platforms common to private sector data science, especially the commercial visualization platform Tableau. Noteworthy here is the presumed audience of the dashboard: CMO-LAX's data hub was only partially viewable by classroom teachers and school principals. At the time of my study, the Data Team did not consider classroom teachers, parents, or other school-level stakeholders as an audience for data work. This work was used internally to provide managerial overview to the organization's leadership and externally and to promote the organization's use of data to other educational organizations. From the analytic of productive myopia, CMO-LAX's invocation of data-driven methods served to obscure the racial distribution of resources, including access to racially integrated public education by the subjects captured in its database.
“Real-time data,” the goal of CMO-LAX's data work and a point of pride in its marketing materials, reified certain representations (to the exclusion of others) and demanded extensive resources to shape and store data in ways more typical of private sector entities. In the next section, the representations made real by data work are incorporated into calculative regimes and used, ironically, as the basis to justify further data collection.
Visualizing college success
The next section concerns a transformation of the data collected by Nina and her direct reports. In what follows, data professionals attempt to incorporate modes of analysis and visualization common to private industry to encourage “college success,” or the eventual matriculation of their students at a four-year college or university. In doing so, these professionals will deploy a strategy of productive myopia—searching for some previously unknown pattern in data that might improve student performance and, simultaneously, ignoring well understood dynamics that constrain the educational opportunities of the minoritized communities they serve. Productive myopia does not necessarily deliver any kind of insight or actionable knowledge, but, paradoxically, results in a demand for more data. In this way, the productive aspects of data-drivenness do not depend on scientific or mathematical validity. To the contrary, any kind of analysis results in a demand for more data.
As chief Data Scientist at CMO-LAX, Gia was responsible for the most sophisticated and technically demanding forms of data work in the organization. Her work consisted of developing data pipelines and of making the various platforms CMO-LAX and its schools used in all their various tasks and at all their various sites interoperate. Data work done in schools tends to “take the form of simple arithmetic rather than complex algorithms; manual rather than automated calculations; and a reliance on unsophisticated technical and classificatory procedures” (Selwyn, 2016: 63). Gia herself did not consider most of her work mathematically or computationally sophisticated. Although she used many tools common to data science work in private enterprise—Python, Amazon Web Services, SQL, and Tableau—she described CMO-LAX's capacities as unsophisticated compared to the kind practiced in tech firms; she felt a part of her job was to help the organization catch up to industry. Gia had been working for some months to answer a question: how could CMO-LAX help more of its students complete college? To that end, Gia shared some code she had been developing.
Gia's code sought to predict which of its primary and middle school students (grades K-8) would complete college. Black and Latinx students complete college degrees at lower rates than do members of other racial and ethnic groups, even when SES is controlled for (Bowen et al., 2011; Martin et al., 2017). In a description of her efforts in this area, Gia described her motivation like this (Figures 3 and 4).

Code detail.

Code detail.
Our first cohort of 8th graders graduated high school only 6 years ago, which means we don’t have a ton of data on our college students reaching back to middle school. I am looking into middle school to high school success indicators and then using those high school indicators to determine what factors contribute to matriculation.
Gia's code proceeded in roughly four logical moves. First, the code creates a logistic regression model based on two variables (at label ①). This operation posits college matriculation as a dependent binary variable (“fouryrcollegepersistence”), the value of which is predicted by two independent variables. The CMO's K-8 students are too young to take Scholastic Aptitude Tests (SAT), the most widely used college entrance exam in the US. However, the Chief Data Scientist has a number of SAT scores of former students available to her, recognizable in the code as the variable called “highest_sat_crm_score.” The CMO vigorously collects many kinds of information about its graduates, including eventual high school performance, which forms the basis for the variable called “cum_gpa,” the cumulative high school grade point average. What results for the first part of this code is a model that demonstrates a strong relationship between GPA, SAT scores, and college persistence. As academic research has generally shown, higher GPAs and higher SAT scores correlate with measures of college persistence: students who perform well on these indicators in high school frequently complete undergraduate degrees (Wolfe and Johnson, 1995). Here, trusted statistical techniques have confirmed this observed tendency and, quite usefully, given some sense of how strong the relationship is between the variables of interest for a small set of observed values.
The next step in the program (labeled②) uses the model generated by the logistic regression to predict college persistence for the entire population of students described in the data by GPA and SAT score, not just those for the subset of students for whom such data have been collected (Figure 5).

Code detail.
For the many students about whom she has incomplete data, the Data Scientist makes an inductive leap, assuming that the model she has created will apply to all of her students and not just those about whom she has been able to access empirically observed data.
The last operation of the code performs another regression, this time a linear regression (Figure 6).
This regression (labeled ③) seeks to arrive at the same distinction made by “college success index,” but to arrive at that target based on two different independent variables: one a score on a standardized test given to eighth graders (“nwea_writ_Mathematics_8_Fall”) and the other a measure of absenteeism (“days_absent8”). This is exactly the same measure developed in the previous section of this paper.
The final operation checks the validity of the model. In this case, the relationship established is weak: junior high school metrics do not strongly predict college persistence. As the Data Scientist described her own evaluation of the code (in the step labeled at ④), “I’m finding that a lot of the predictive power gets lost this way.”
Regardless, the Chief Data Scientist decided to implement this analytic provisionally. Lacking any better model to describe the relationship between junior high school metrics and eventual matriculation, the Chief Data Scientist planned to share her analysis and also resolved to collect more data to improve and validate her work. While the desired relationships between variables sought did not emerge, the Chief Data Scientist reasoned that this work, even if imperfect or not especially reliable, could prove more useful to administrators than the alternative, which would be to have no information at all. Her move to share this work also serves to overstate the relationship between data and behavior, even though, by her own careful calculations, no such relationship could be strongly determined. This bespoke analytic, so particular to the environment where it was written and sensitive to the vagaries of the data upon which it operated, provides a concrete way to understand productive myopia: from an organizational perspective, data-drivenness appears not just as a technique for directing activity, but as an organizational goal in and of itself. Tested statistical techniques, deep domain knowledge, and entirely novel and selective procedures mingle here, but instead of providing unambiguous or decisive evidence for one course of action or another, they reinforce a demand for more data. Organizations invested in “numeric authority and continuous growth” use numbers in ritualistic or emotional ways to direct employee behavior, but at CMO-LAX, it is not a final output or target that is of consequence, but the Data Team's calculative capacity (Mazmanian and Beckman, 2018: 375). This voraciousness with respect to data assures both the organizational necessity of the Data Team and the value proposition of CMO-LAX in the education sector.
Like any competent, reflexive practitioner, the Chief Data Scientist was intensely aware of the limits of data analysis, particularly as it concerned the predictive power of models: as a part of her professional skillset, she had terms available to measure and describe the error of the model she had created and was perfectly up-front about these limits. After the publication of the dashboard in the data hub, these terms were locked out of analysis, obscured beneath the orderly planes of a data visualization that cannot register uncertainly, error, or ambivalence. Organizationally, what the data said was of less importance to CMO-LAX's data-drivenness than the presence of the dashboard itself. In the end, the demand for data was always open-ended: the Data Team always advocated for more data, effectively guaranteeing their own authority and centrality to the organization's mission. In this way, data-drivenness confers status both inside and outside the organization (Figure 7).

This dashboard includes the measures of chronic absenteeism. Presumably, Gia's code would lead to a similar dashboard in the data hub.
Discussion: Productive myopia as a tactic in racially segregated schools
Like all forms of knowledge production, data analysis, aggregation, and visualization do not exist outside of cultural, political, and racial contexts (Brown, 2021). Broadly speaking, American public life can be thought of as a series of overlapping and interconnected racial projects: in the US, the public sphere is defined, constituted, and managed according to the specific interests of a dominant cultural group, a group that is racialized as white (Ferguson, 2012; Martinez HoSang and LaBennett, 2020; Muñoz, 1999). Across the US, the racial segregation of public schools has increased in the last three decades, such that in many places, schools are more racially segregated than when the US Supreme Court ruled de jure segregation a violation of the US Constitution in 1954: White and Latino students are the most segregated groups. White students, on average, attend a school in which 69% of the students are white, while Latino students attend a school where 55% of the students are Latino. Segregation for Black students is rising in all parts of the U.S. Black students, who account for 15% of enrollment as they did in 1970, are in schools that average 47% Black students. Asian students, on average, attend schools with 24% fellow Asians. Black students attend schools with a combined Black and Latino enrollment averaging 67%, and Latino students attend schools with a combined Black and Latino enrollment averaging 66%. White and Asian students have much lower exposure to combined Black and Latino students, at 22% and 34%, respectively (Orfield et al., 2019)
Urban schools, as intensely racially segregated learning environments, are also frequently sites of “double segregation,” where students of lower SES are concentrated; this double segregation amounts to a “disproportionate exposure to concentrated poverty,” further harming and stigmatizing affected public school students (Orfield et al., 2019: 24). Regardless of the quality of education their institutions offer, Black students who attend racially segregated schools are “inordinately” harmed by racial segregation, as well as segregation based on ethnicity and SES (Palardy et al., 2015). Students from other minoritized communities are also likewise harmed. Such harm is a part of the vital context that productive myopia obscures. Data work at CMO-LAX accommodates the larger racial project of distributing access to quality public education according to racial hierarchies. Productive myopia trains the organization's vision only on individual behavior, preemptively locking out of view any data analysis that might describe how the reality of school segregation affects impacted students, families, or communities. This strategy allows the organization to make students, families, and even teachers responsible for optimizing the outputs of an educational system that is inherently unequal.
At CMO-LAX, productive myopia accompanied and occluded the use of deficit-informed analyses (Davis and Museus, 2019; Sharma, 2018) and updated them for industry-standard tools and platforms. Throughout my fieldwork, data did not offer clear directions or unambiguous answers, although these patterns were frequently assumed to be present despite a lack of evidence. The most frequent answer to any sustained process of analysis was a request for more data. In this way, data work became not just a means to support organizational decision-making, but an end in and of itself. What data stood in for was largely irrelevant. The work of the Data Team supported CMO-LAX's mission to improve its schools, all of which serve minoritized communities, and to disseminate practices that would improve all such schools. By reimagining itself as an innovative, technologically sophisticated, data-driven organization, CMO-LAX could tout its technological capacities and expand its network of schools. These associations implicitly criticize other public schools as lacking such capabilities and imply that the academic accomplishments of students should be attributed to organizational culture. Productive myopia prevents consideration of the racial formations to which the organization contributes and instead produces demands for data.
While I do not mean to imply that CMO-LAX is responsible for the extreme racial segregation of schools in Southern California, what is significant here is that its uses of data confer reputational benefits that have little to do with quantitative analysis and everything to do with capitalizing on the increasing cultural cachet of data, the imagined potential of data-intensive computation to render the world legible, predictable, and manageable. In many ways, this pursuit of reputational benefits overrode any organizational imperative for equity or social responsibility. As Ray describes this dynamic, racialized organizations
decouple formal commitments to equity, access, and inclusion from policies and practices that reinforce, or at least do not challenge, existing racial hierarchies…This decoupling allows organizations to maintain legitimacy and appear neutral or even progressive while doing little to intervene in pervasive patterns of racial inequality (Ray, 2019).
Productive myopia names CMO-LAX's strategy of making the data it had conformed to the tools and platforms of data work in the private sector. Productive myopia likewise concerned the Data Team's mandate to make its derived analyses and visualizations appear sophisticated for management and select audiences. However, it appeared and whatever tools it used, data work at CMO-LAX deliberately and purposively invoked some association with the tech sector to burnish its own reputation. Productive myopia put off harder questions about resources in favor of valorizing the organization's own approach. CMO-LAX claims to be better at schooling via data-drivenness, but its exultation of data does not extend to questions about the conditions that segregate schools and how CMO-LAX's activities might legitimate this racial project. My point is not that there exists some other, perfectible, more agreeable version of datafied public education. To the contrary, my point is that the contradictions, assumptions, and value judgments on display in this field site are productive: they confer benefits to the organization and help it to expand.
Conclusions
I have advanced the term productive myopia to name the racial dynamics of data work applied to public education. My interest in this study has been in looking at the intersection of the tech sector and public education, in the harms that inhere in uncritical or cynical deployments of technology. Although its proponents frequently suggest that data-drivenness can improve public education (and other public services), I have argued that this popular way of thinking about data-intensive applications ignores—or worse, legitimizes—the way that data work in organizations contributes to racial projects. In the empirical sections above, very loose and statistically dubious models and associations lent a veneer of tech-savviness to the organization studied, but left difficult questions about racial inequality unanswered or invisible, unthinkable even. Data-drivenness became not an ethos of inquiry, but a kind of status symbol. As an analytical tool, the term productive myopia is meant to keep the dynamics at work in racial projects in play, to prevent them from being locked out of view by the allure of data.
Contemporary technologies of data aggregation, visualization, and analysis offer powerful ways to know the world. Technological innovation (particularly in minoritized and racialized communities) is frequently presented as a strictly value-add proposition: if the technology works as advertised, some benefit will accumulate to users and, by extension, to the community; if the technology fails or works differently than expected, no one is any worse for the wear. This is a false premise. As scholars attentive to various forms of digitally mediated racial discrimination and inequality have pointed out, technological change entails risks, costs, and benefits, all of which are unevenly distributed across existing topographies of power, across intersecting types of oppression. If we allow these power dynamics to unfold without criticism or resistance, we risk letting data-drivenness provide an alibi for the harm such oppression invariably produces.
The author wishes to thank Brian A. Schetzsle for statistical consulting on this project.
Footnotes
Declaration of conflicting interests
The author(s) declared no potential conflicts of interest with respect to the research, authorship, and/or publication of this article.
Funding
The author(s) disclosed receipt of the following financial support for the research, authorship, and/or publication of this article: This work was supported by the National Science Foundation's Directorate for Computer and Information Science and Engineering (CISE), Award # 1901367.