
Abstract
If you are an anthropologist wanting to use digital methods or programming as part of your research, where do you start? In this commentary, we discuss three ways in which anthropologists can use computational tools to enhance, support, and complement ethnographic methods. By presenting our reflections, we hope to contribute to the stirring conversations about the potential future role(s) of (social) data science vis-a-vis anthropology and ethnography, and to inspire other anthropologists to take up the use of digital methods, programming, and computational tools in their own research.
This article is a part of special theme on Machine Anthropology. To see a full list of all articles in this special theme, please click here: https://journals.sagepub.com/page/bds/collections/machineanthropology
Introduction
Recent publications (Fortun et al., 2017; Seaver, 2014) have reinvigorated the slumbering anthropological interest in computation first initiated by Hymes’ (1965) edited volume The Use of Computers in Anthropology decades ago. This interest runs parallel to a burgeoning interest in the ethnographic study of data and algorithms (Christin, 2020; Knox and Nafus, 2018). Yet barring a few exceptions (e.g. Beaulieu 2017; Cunningham, 1996), most discussions of data and computers put forward by anthropologists have not explored the benefits these new changes in methods, software, and computing power might bring for the discipline.
Most discussions of ethnographic methods vis-à-vis computational tools and data science methods are put forward by sociologists (Abramson et al., 2018; Nelson, 2020), or by scholars working in cross-disciplinary research endeavors (Blok et al., 2017; Moats, 2021; Moats and Seaver, 2019) or in digital methods (Munk, 2019). Despite a growing number of instructive cases coming from such new constellations of research, more examples of how computational tools can be of pragmatic benefit to anthropologists are much needed. More precisely, what is needed is quite concrete, simple, and instructive writings that can complement classical anthropological and ethnographic methods. As junior scholars and students of anthropology and social data science that have been engaged with these questions in recent years, our aim with this commentary is to lay out a few starting points for budding ‘machine anthropologists’.
In doing so, we point to three ways in which anthropologists can incorporate digital and computational methods and techniques into their methods toolkit. These are (1) how scraping social media can complement ethnographic research by providing a broader contextualization; (2) how working with quali-quantitative methods can create ‘thick’ datasets that are non-traditional yet ethnographically salient; and finally (3) how fieldnotes may be recorded and processed using programming and software in order to enable more sophisticated analyses of ethnographic observations. By way of pointing to these three, we will make the case for why anthropologists should learn how to program, and what such a shift might mean for the discipline.
Using digital methods in conjunction with fieldwork
The field of digital methods has been in a sprawling development in recent years, creating a host of tangible tools for studying online worlds and social media platforms, as well as epistemological and methodological frameworks for how to use the internet not just as an object of study but as an infrastructure for studying the social world (Marres, 2017; Rogers, 2013).
Borrowing inspiration from digital methods, in 2019 we set out to study the communication strategies of the center-of-left Danish political party, Alternativet (‘The Alternative’), using a combination of web scraping techniques and classical ethnographic interviews. We aimed to analyze tweets from the user profile of the party itself as well as by the political leader Uffe Elbæk. A dataset was created by setting up a script in Python, which we used to download 17,408 tweets between 8 January 2013 and 11 October 2019. The tweets were collected with consent and permission from the party.
How are such tweets rendered into objects of anthropological and ethnographic analysis? As a first initial step, we visualized patterns in the tweets with the use of word clouds. This is a relatively simple technique which can be done via online tools such as Wordle, but in this case we used a Python script to construct them. Word clouds are a tool for counting frequencies in which the most common words are visualized relatively larger than less common words. For exploring text data, word clouds may serve a somewhat similar purpose as what Spradley (1979) calls grand tour questions in ethnographic interviews, allowing an interlocutor to introduce and describe any given setting to the ethnographer (Spradley, 1979: 86). A word cloud, we suggest, is imbued with a similar capacity, affording the researcher an introductory overview of basic patterns in a given dataset (frequency of words, types of words, etc.), such as Twitter hashtags. The word cloud thus allows for an initial step in the data analysis before further exploration and analysis of the data can be done.
What patterns does the resulting word cloud analysis reveal? In our ‘digital grand tour’ we learned that the most frequently used hashtags in tweets by Alternativet and Elbæk were related to climate and environmental politics (e.g. #dkgreen, #dkoeko and #stemgrønnest) (see Figure 1). This led us to examine how the political party and its political leader practice green politics on Twitter through their use of hashtags.
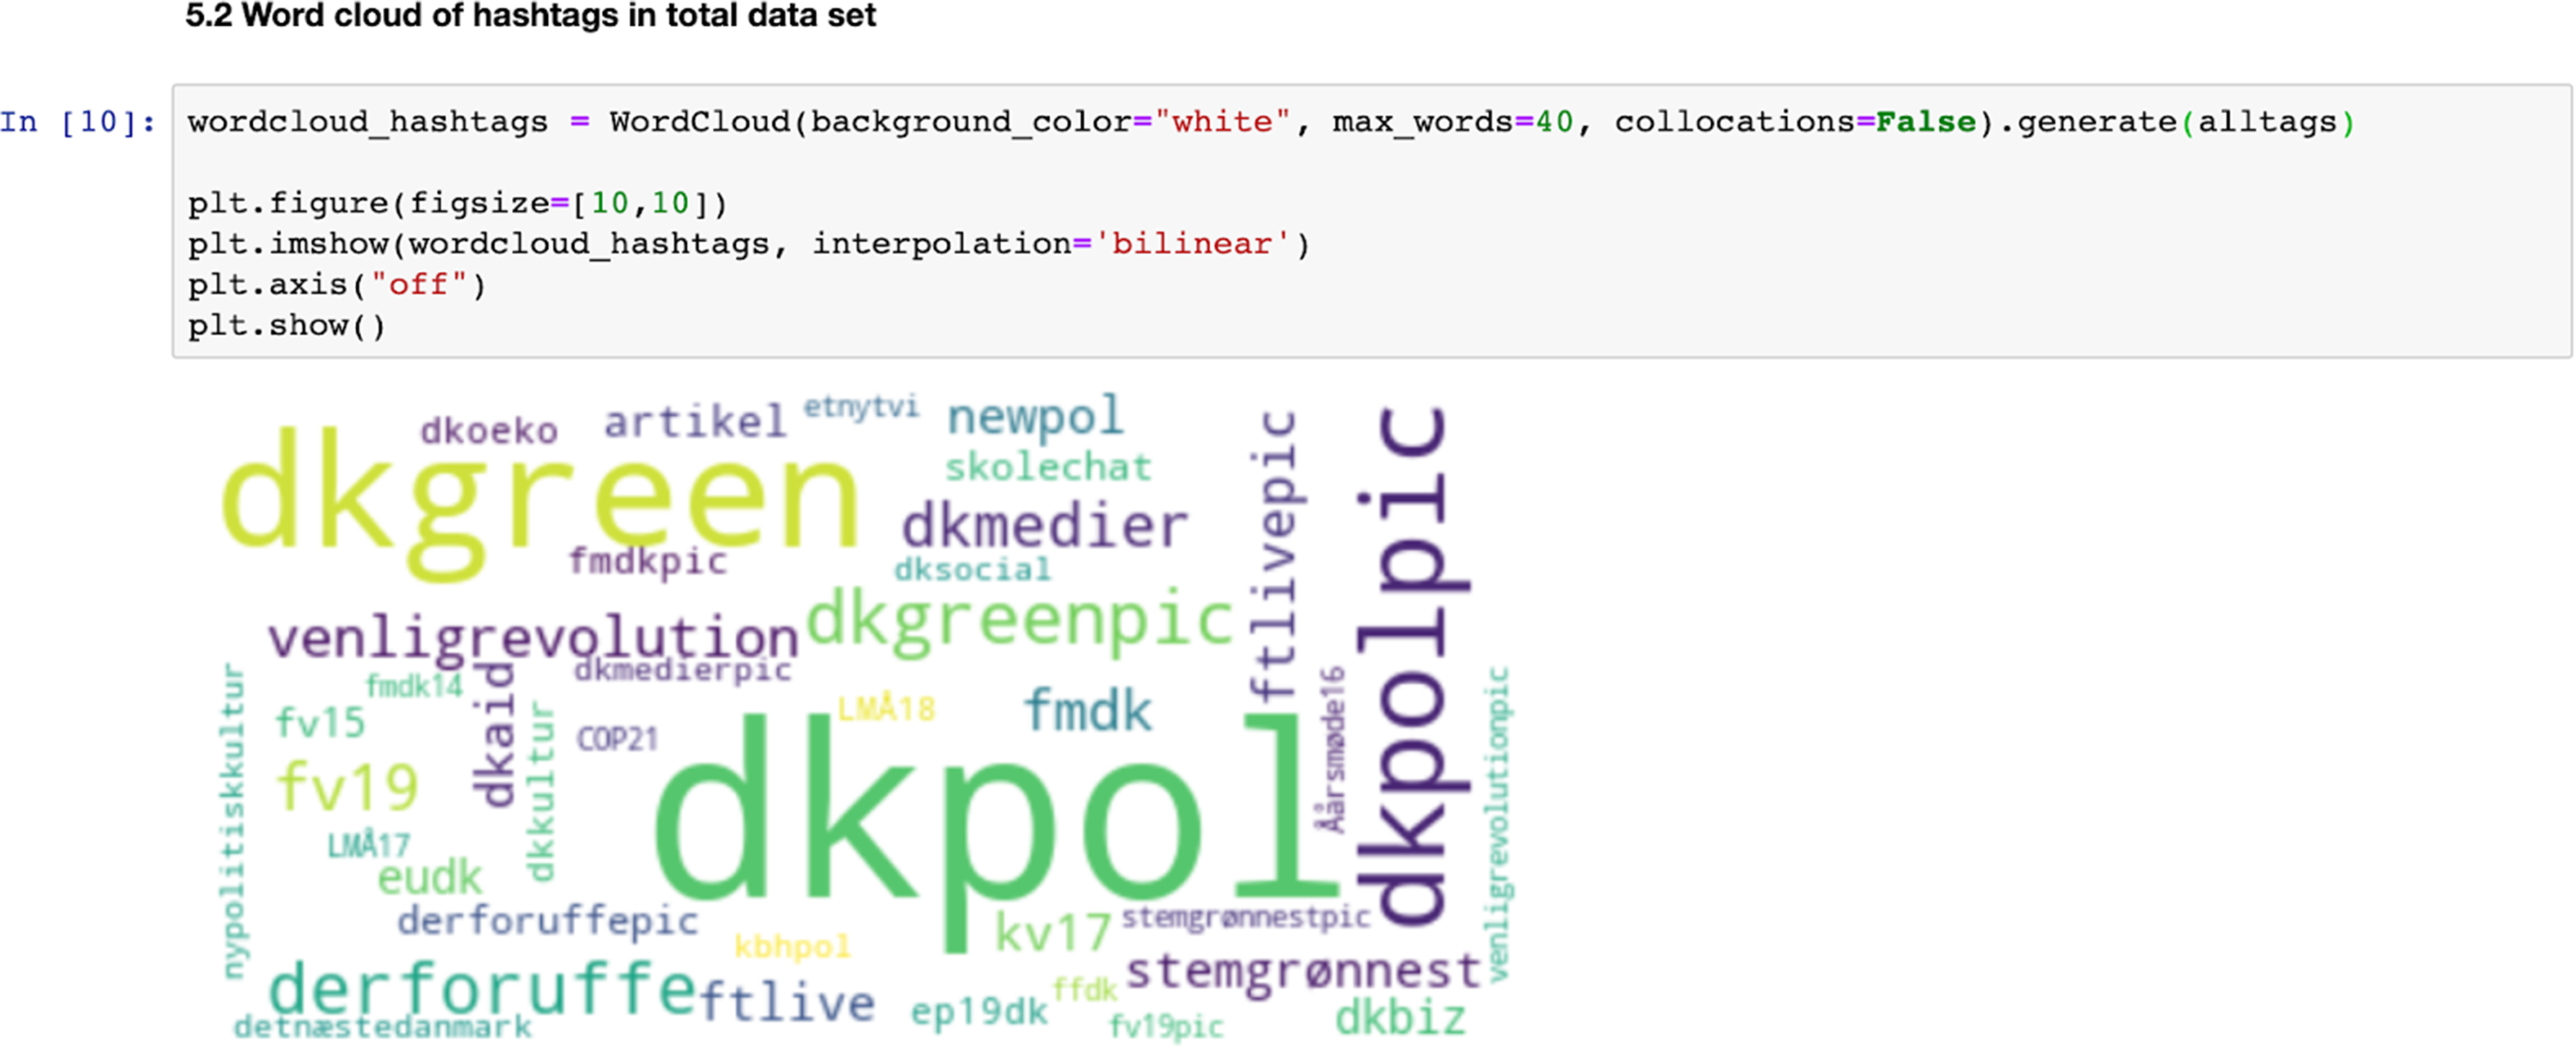
Hashtag word cloud and Python script.
To get a deeper sense of which tweets were promoting climate initiatives, we manually went through the 100 most frequent hashtags and made a list of climate-related hashtags, which were then fed into our Python script. However, merely counting which hashtags were used most frequent does not allow us to deduce why Elbæk and Alternativet chose them. This is where more conventional ethnographic methods were put to use. Via interviews with Alternativet's media advisor, we were able to determine, for instance, that Alternativet by default uses the hashtag #dkgreen on all Twitter content related to climate. By comparing the use of hashtags with the general development in Danish politics during the 2019 election, we obtained knowledge of how Alternativet used hashtags strategically on Twitter to position themselves as more climate friendly than their political adversaries.
The development in the use of ‘#stemgrønnest’ over time (see Figure 2) demonstrates one of the advantageous outcomes that collecting data via computational means had for our project. Scraping tweets enabled us to collect data that extended back in time, with a consistent data density. This provided a diachronic understanding of our field of interest, which in turn strengthened the validity of our analysis (Abramson et al., 2018: 254–255). It enabled us to critically assess the patterns generated by the word cloud visualizations and, more generally, let our qualitative insights guide us throughout the process of scraping, cleaning, and analyzing our data.

Temporal plot of ‘#stemgrønnest’ on Alternativet's (left) and Elbæk's (right) Twitter accounts from 8 January 2013 to 11 October 2019. Note that the lowest value on the x-axis is the date when ‘#stemgrønnest’ first appears.
Logbooks as a methods for quali-quantitative ‘thick data’
While some anthropologists do of course use surveys in various guises, often through the collection of questionnaires in the field (Bernard, 2017), many are skeptical toward using any kind of quantitative methods, especially those using closed questions with the aim of making large-scale statistical analyses. Yet, in combining elements from both classical surveys and experience sampling methods that employ closed questions with self-reported diaries or logbooks employing open questions, it is possible to create datasets that are both qualitatively deep, while allowing for quantitative trends over time for a given population group. As we will outline here, using such hybrid logbooks can be a useful way to gather quali-quant ‘thick’ data, which in turn can be analyzed and visualized using programming in new and interesting ways.
During the first lockdown of Copenhagen during the COVID-19 pandemic of 2020, we asked 59 students to report their sleeping routines, number of both offline and online interactions, and use of digital devices, and a range of other elements, over a period of 4 weeks. The logbook combined a classic survey format using closed, predefined answer categories, with open-ended questions, where respondents could use their own words to describe their day. In addition, follow-up semi-structured online interviews were conducted with 24 respondents.
As the logbooks were designed to straddle both qualitative data and quantitative data, we could combine numerical data which tracked temporal changes such as sleeping patterns and number of social interactions with respondents’ diary-like entries, enabling us to thematically code interactions, daily routines, and digital practices in ways that added a depth of understanding to individual patterns of behavior. Furthermore, we included external data such as weather patterns and changes to the lockdown restrictions to probe how the respondent's habits and moods changed over time.
Taking inspiration from Nelson’s (2020) computational grounded theory, the design of the logbooks allowed an inductive analytical approach where we used simple text mining analyses on the open text fields to look at overall and individual level word usage. For instance, zooming in on the data that relates to questions about how much time respondents used digital devices, we found that although students as expected came to depend more on digital devices for both work and social interactions, there were significant individual differences. We show this by calculating the daily screen time usage during waking hours for each respondent (see Figure 3).
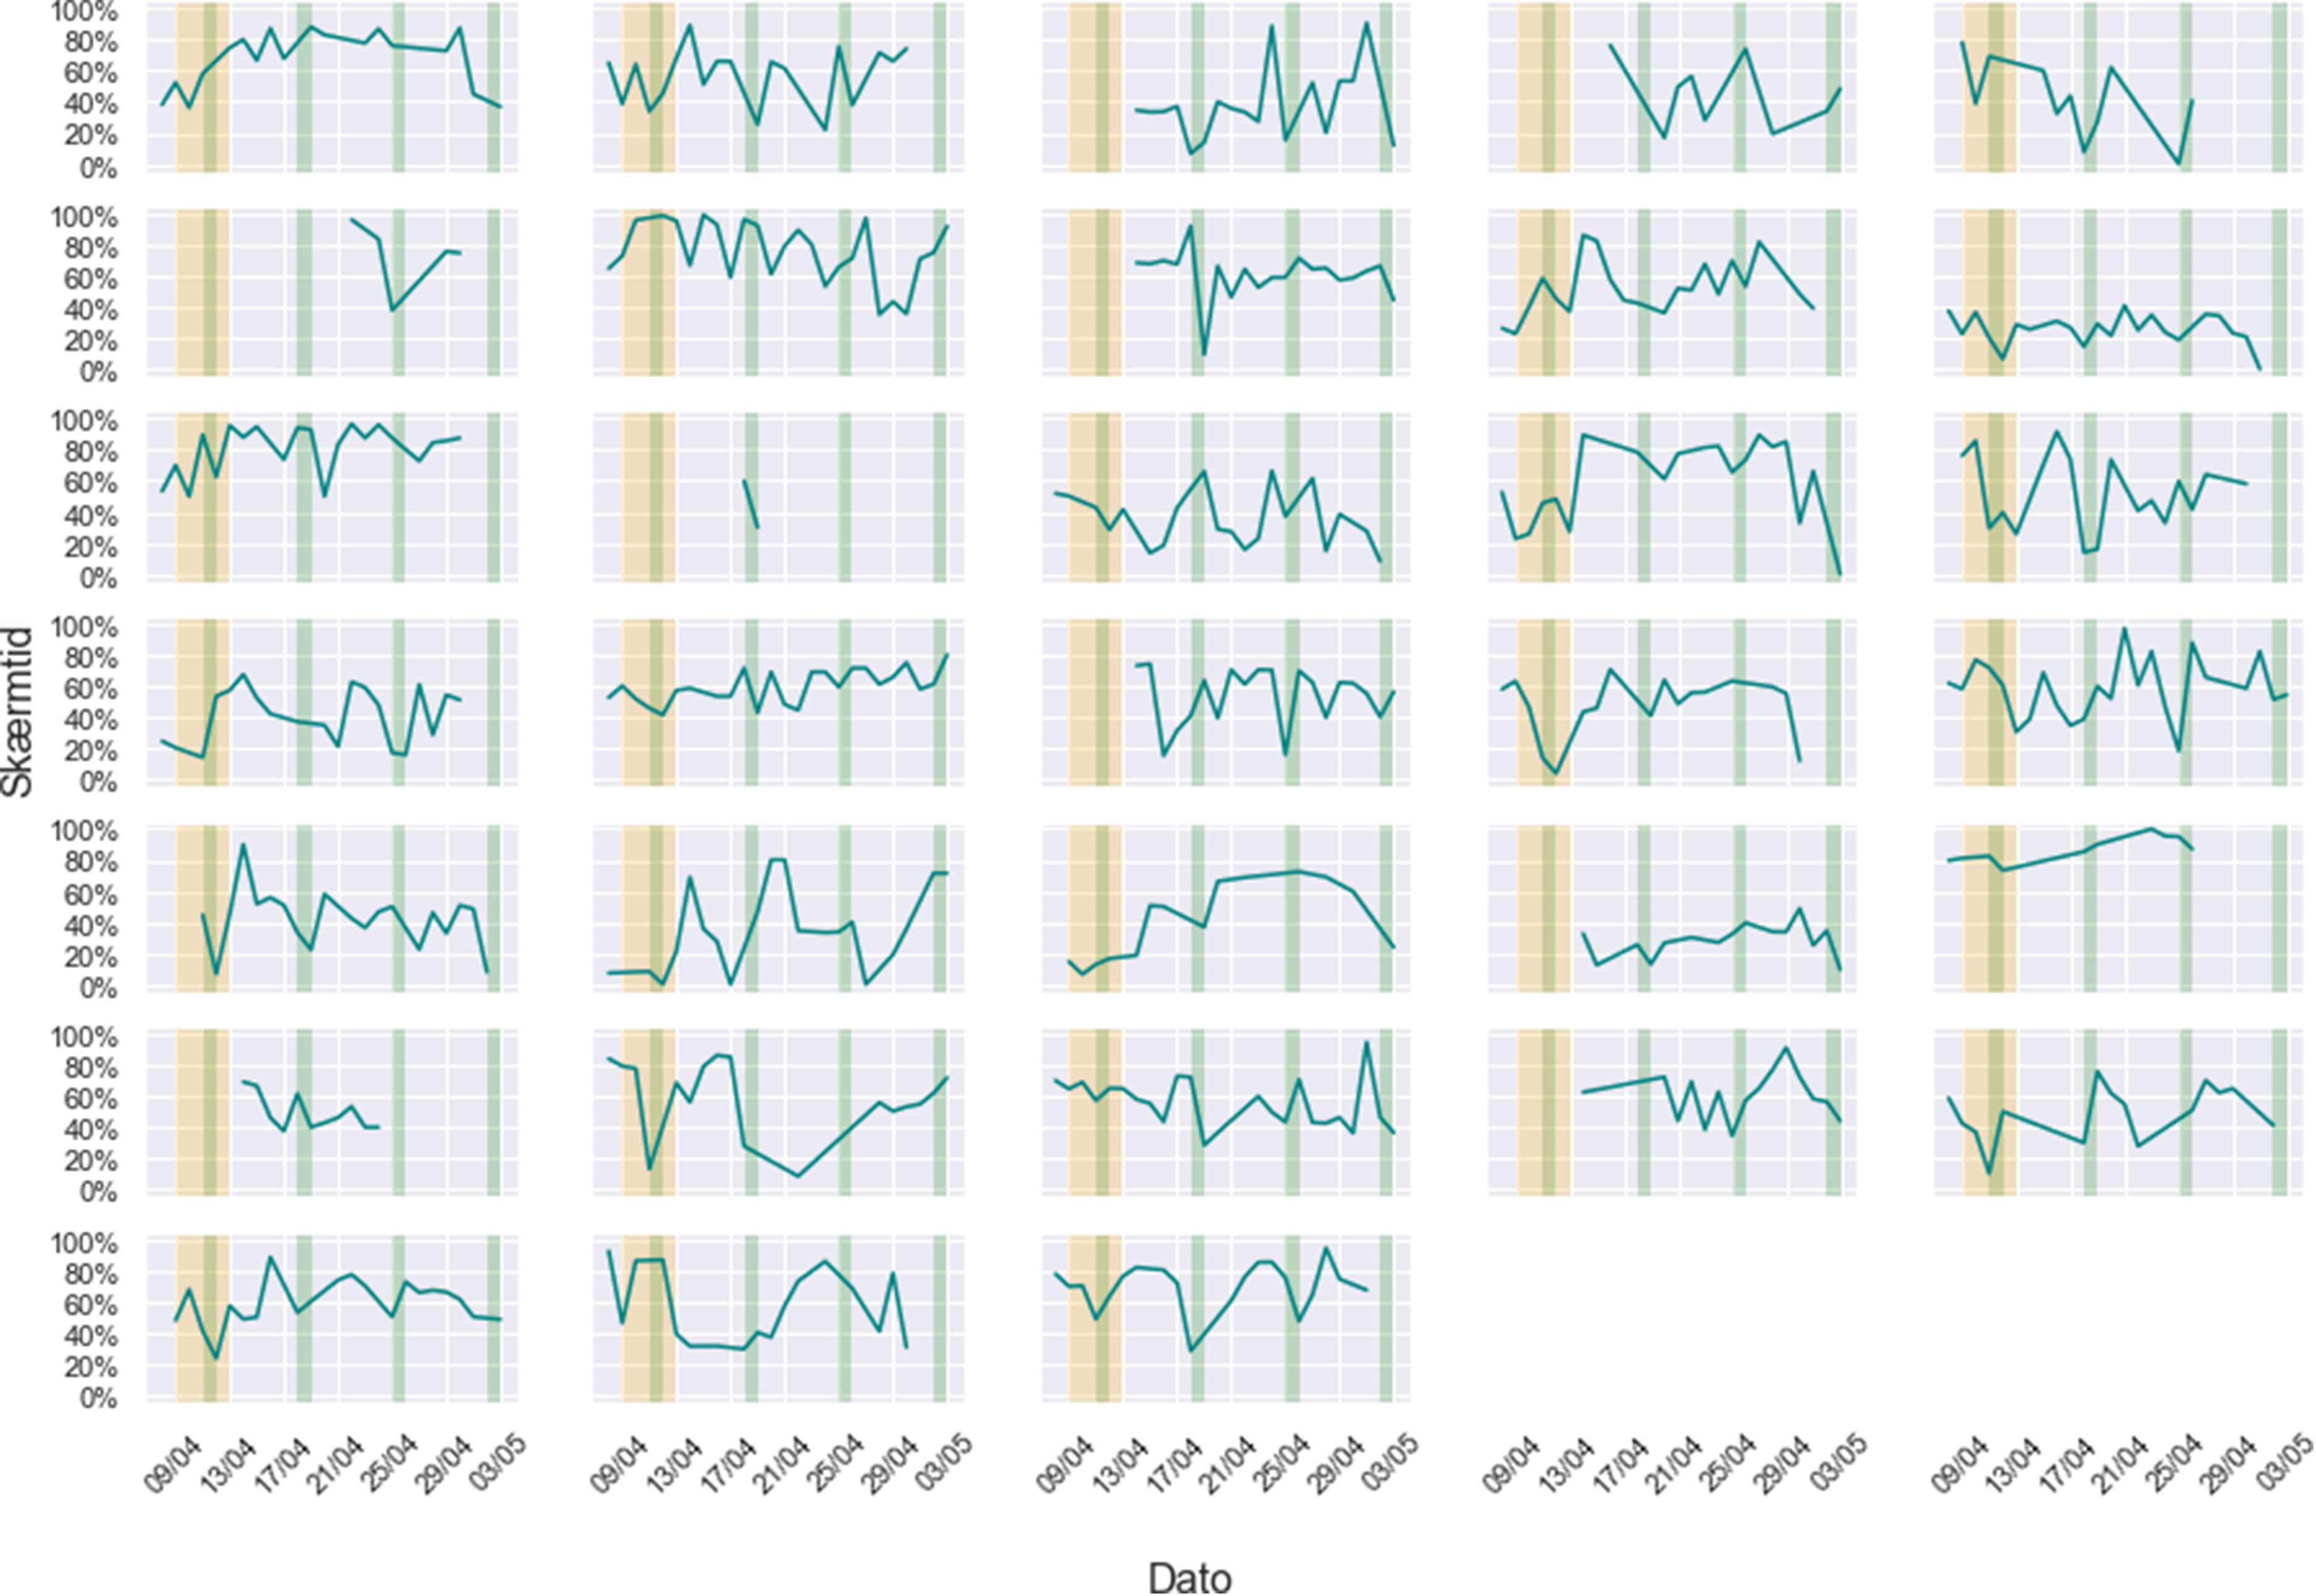
Grid plot of the individual amount of screen time as a percentage of waking hours a day.
The individual ‘seismographic’ lines depicted in Figure 3 are exemplary of what anthropologists might be interested in gaining from combining qualitative and quantitative data through visualizations: they make visible behavioral patterns of humans at a detailed level, without being statistically aggregated across a large population. In this sense, we would describe them as ‘thick’ quali-quantitative data, 1 albeit with a very small population number (N). In our case, it is the extensive data collection of many variables and open-ended answers on a daily basis for 4 weeks from each respondent which constitutes the ‘thickness’ of the dataset.
While a logbook research design such as this one faces well-known challenges (e.g. self-reporting bias), a diachronic, quali-quant self-reporting logbook format can serve as a useful approach for a kind of ‘remote ethnographic research’, which was especially needed in the context of the pandemic where physical fieldwork was impossible. Also, the fact that we were able to carry out follow-up online interviews turned out to be a vital method for complementing and triangulating the results and findings. Finally, by using Python to organize and analyze both the textual data and numerical datapoints, we experimented with analyses and visualizations of the data that could not be done solely (at least easily) using more standard software such as Excel or NVivo.
Computing fieldnotes
While computational tools and quali-quant methods can indeed broaden the scope of many aspects of ethnographic data collection – as discussed in the two previous examples – they can have a specifically interesting impact on the practice of taking and analyzing fieldnotes. The following reflections are based on our preliminary experiments and experiences with developing a new digitized template for writing, processing, and analysis of ethnographic text as data.
Fieldnotes are at once a valuable source of insight into what the ethnographer has observed ‘in the field’, and at the same time, a source of information about the ethnographer's own style of thinking and writing (Sanjek, 1990). Methods and techniques from data science and natural language processing (NLP) – for instance, topic models and sentiment analysis that originate from the study of word patterns – can be used to explore such styles. However, to do so, fieldnotes must be made both human and machine readable. As fieldnotes are typically highly individualized documents reflecting the idiosyncratic styles of their authors, making them amenable for computational processing and analysis will require a relatively strict standardization. In addition, as computers are ordered by categorizations, making fieldnotes machine readable requires a set-up that orders text into pre-defined categories. At the same time, however, such a standard also needs to respect that fieldnotes often capture the messy experiences of the field, a conditional element of ethnographic fieldwork practice, which works with ‘foreshadowed problems’ rather than strict hypotheses (Malinowski, 1922).
Our objective, then, was to locate ourselves at an optimal balancing point between (a) structuring a format that would work computationally; (b) keeping a degree of flexibility for researchers to record field observations in their own style; (c) making sure that observations are understandable when shared among a group of researchers; and importantly, (d) keeping it simple and easy to work with especially in teams. From these initial principles, we set out to construct a template that could be used to write and store fieldnotes in. Our first step in this process was to do away with the standard software for writing fieldworks, that is to say Microsoft Word, since such text processing files are hard to turn into a format that is computable in Python or other programming languages. Instead, we used the simple markup language XML – which is easily readable by Python – to craft a template (Figure 4).

Computational fieldnote template with different categories for metadata and ethnographic situations.
Importantly, the template distinguishes between two main types of data. The first, metadata, contains information about who wrote the fieldnote, when and where it took place, and the purpose of taking the fieldnote. The second type involves several categories that all pertain to content: descriptions of observations or interactions, direct quotes by interlocutors, or reflections made by the fieldworker, which is also commonly found in fieldnote journals (Sanjek, 1990).
To strike a balance between data structure and flexibility, we opted for a format connecting a string of words into a given category. We thus used an opening tag (i.e. ‘<researcher>’) to denote a category. The string of words within the category (e.g. ‘John Johnsen’) then forms the content. To close the category again it is necessary to end with a closing tag indicating this (e.g. ‘</researcher>’). This format is easily customizable as tags and content can be freely chosen, to cater for the fact that field notes should also in the context of this format be coded qualitative using open coding techniques, as is more commonplace for anthropologists. However, this type of format for fieldnotes can also be studied after fieldwork using quantitative text-mining approaches, such as counting positive or negative words that fieldworkers reported for the same or similar settings.
Although the content categories contain the substance of the fieldnotes, the metadata had a particular importance for us in drafting the template. As pointed out by Bundgaard and Rubow (2016), collaborative anthropological projects in particular rely on such metadata to communicate context about field situations. Here, we would add that metadata also represent a rich quantitative (or quantifiable) resource: time stamps, geographical indicators, and number of persons can be quantified and computed in relation to the content data, and for NLP style analyses such as topic models.
Why anthropologists should learn to program
Our intention with highlighting how anthropologists can use digital methods, what we call ‘thick’ surveys, and computational fieldnotes has been to encourage an expansion of the anthropological project by incorporating programming techniques and software that can facilitate new data collection, analysis, and visualizations.
Across these examples, we have indicated not just how anthropologists can borrow from sprawling fields such as digital methods, we have also tried to show the potential values of learning how to program. In keeping with a research approach pursued at hubs such as The Copenhagen Center for Social Data Science (SODAS) where all methods and techniques for data collection and analysis can potentially be useful and integrated with one another using programming, we wanted to learn to code the ‘back-end’ of the data analysis ourselves rather than using such prepackaged software tools. Importantly, programming one's own ‘back-end’ for digital storage, processing and analysis of ethnographic data allows for the use of a range of analysis techniques that are both simple (word frequency analysis and qualitative coding of themes) and advanced (such as training a machine learning model for sentiment analysis or a topic model), which commonly used commercial software packages such as NVivo do not offer. While software such as Excel or NVivo (or online tools such as Wordle) can of course be used for the types of data collection and analysis approaches we have presented here, anthropologists could benefit from learning Python or R precisely because of the subsequent potential of analyses with text data or image data (sentiment analysis and topic models).
Many anthropologists might be skeptical and find computational tools and techniques tedious and not worth the effort. That being said, a lot can be gained even from even a minimal investment. A good place to start is the many online (and to some extent free) courses such as Datacamp that help learn the basic of Python or R. As we hope to have shown, there is no inherent reason why anthropologists should fear using data science techniques and methods. Used wisely, computational techniques and methods can help to create new innovative styles of anthropological analysis, foster reflections about the methods, ethics, and practice of fieldwork itself and shed new perspectives on taking fieldnotes.
I sum, our overall aim with this commentary has been to show how ethnographers and anthropologists alike might benefit concretely from using digital data, using more quantitative data, doing data visualizations, and using other means to render their fieldnotes into analytical objects of interest We believe that this somewhat pragmatic message has direct relevance for nudging the discipline toward benefitting from ‘data machines’, while insisting that relatively simple and approachable computational techniques and tools can be in the service of traditional ethnographic methods such as observations, interactions, and interviews rather than being antithetical to them. Indeed, the task is to make the best and most pragmatic use of the new affordances that programming languages such as Python have to offer, rather than to change the practice of ethnographic fieldwork or anthropological analysis altogether.
Footnotes
Acknowledgments
We thank the two anonymous reviewers for their helpful and constructive comments. The research projects discussed in this commentary were carried out at the Copenhagen Center for Social Data Science (SODAS) and was done as part of the project ‘The Political Economy of Distraction in Digitized Denmark (DISTRACT)’.
Declaration of conflicting interests
The authors declared no potential conflicts of interest with respect to the research, authorship, and/or publication of this article.
Funding
The authors disclosed receipt of the following financial support for the research, authorship, and/or publication of this article: This work was supported by the H2020 European Research Council (grant number 834540).