
Abstract
Instagram is currently the social media platform most associated with online images (and their analysis), but images from other platforms also can be collected and grouped, arrayed by similarity, stacked, matched, stained, labelled, depicted as network, placed side by side and otherwise analytically displayed. In the following, the initial focus is on Instagram, together with certain schools of thought such as Instagramism and Instagrammatics for its aesthetic and visual cultural study. Building on those two approaches, it subsequently focuses on other web and social media platforms, such as Google Image Search, Twitter, Facebook and 4chan. It provides demonstrations of how querying techniques create online image collections, and how these sets are analytically grouped through arrangements collectively referred to as metapictures.
Introduction: Analysing ‘visual media’ online
As indicated by the title, the analysis is of ‘visual media’ online, a term that could be more specific such as ‘visual social media’ (Leaver et al., 2020), ‘digital visual media’ (Dean, 2019), ‘digital visual artefacts’ (Leszczynski, 2018) or even ‘digital images, digitally analysed’ (Rose, 2016). An even more straightforward designation could be ‘social media images’ (Pearce et al., 2020). Each narrows the purview in a distinctive manner. The first concerns social media platforms driven by images (as Instagram, Tumblr, 4chan and perhaps even Flickr), the second emphasises image formats as memes, the third the inclusion of visual objects as emojis and gifs and the fourth digital images, which covers the digitised together with the internet-native. Social media images, the last category, would widen the platforms under study beyond ‘visual social media’ to any with images. In the following, the online visual media discussed includes all the above categories or emphases and is restricted to images online, rather than video, though YouTube’s thumbnails are addressed.
But the point of departure is not just the objects of study and their key terminological specificities. It is also the outputs of their study, i.e. their analytical and interpretive arrangement. Akin to the manner in which digital research methods often fuse the tool and the method, in what has been referred to as ‘programmed method’ (Borra and Rieder, 2014), here analysis and arrangement are melded, the outcome of which could be referred to as a metapicture, in Mitchell’s terminology. The collections of images are framed in a manner of display that enables critical reflection on them (Gronstad and Vagnes, 2006; Mitchell, 1994).
This metapicturing, then, seeks to nestle itself between qualitative visual analysis and interpretation (from, say, art history) (Fernie, 1995) and quantitative knowledge visualisation where one deftly chooses the visualisation type to fit the data set (Börner and Polley, 2014). That is, rather than an emphasis on individual images, the metapicturing applies the analytical reading to images en group (Colombo, 2018). It also retains the images in the metapicture rather than rendering them as data points and visualising them as abstractions.
In what follows are approaches and techniques for deriving and arranging groups of images as metapictures that reflect upon them. The grouping arrangements (with built-in critical reflection) are further specified as image reuse, image trends, image vernaculars, dominant image, image presence, image quality, image staining (or tarnishing), image circulation, image engagement, image associations, image removal and feed competition. Each is taken in turn, together with how they meet the needs of critical questions concerning online reputation, style spaces, societal discourse, cultural conflict, versions of events, content moderation, polarisation and alignment as well as others.
Finally, by way of conclusion, there is also an emphasis on making the metapicture active in the research undertaking. By making it active, I mean the consideration of software outputs and visual arrangements as starting points rather than culminations of investigations (though one may arrive at a metapicture strategy anytime throughout a project). Envisaging the output or metapicture with the built-in critical reflection thereby becomes a part of project formulation. But it also takes it a step further by inviting the formulation of questions that include the reflective arrangement of image groups, a theme to which I return in the conclusion.
Studying Instagram
Instagram launched in 2010 with the retro Polaroid icon, square picture format and well-named filters such as Lark (good for nature shots). As an object of study it has evolved over the years, with its association with selfies (Walker Rettberg, 2014), a staging aesthetic (Manovich, 2016) as well as a new kind of traveller outside of the tourist and traveller, the digital nomad (Bozzi, 2020). It is also connected with micro-celebrities and lifestyle influencers (Senft, 2013), who engage in ‘visibility labour’ (Abidin, 2016) through regularly posting, at once potentially earning themselves revenue as well as engaging in what one scholar has called the ‘war of eyeballs’ (Abidin, 2014).
These internet celebrities (large and small) build followings, or fan bases (Marwick and Boyd, 2011) through active engagement on the platform by following others and liking and commenting on their posts. Some of this ‘relational labour’ (Baym, 2015) may be automated; among the tools deployed by heavy users to build relationships in the form of followings are software apps that automatically like posts of others who follow them, in a form of interactivity once referred to as ‘interpassivity’, where the machine acts on your behalf (Zizek, 1998). It also outsources a type of ‘affective labour’ (Hardt and Negri, 2000), the pleasant-seeming, outward display of a job one would rather not do.
The authenticity of the follower and like counts is an issue for especially Instagram (and to a lesser extent other platforms), given how follower factories (a term in the same family as click farm) offer ‘fame for sale’ (Cresci et al., 2016), where one can purchase followers, likes as well as comments (Lindquist, 2018). These can be of varying quality (and duration), given how some are detected by the platform itself and purged, resulting in infamous cases of sudden, telling drops in the follower counts of celebrities, athletes and politicians but also so-called pseudo-influencers (Castro, 2021; Confessore et al., 2018) (Figure 1). In keeping with the question of whether (and when) one can trust social media data and engagement analysis (Paquet-Clouston et al., 2017), such findings have been discussed in terms of ‘manipulated reputation’ (Aggarwal, 2016) and the ‘engineered self’ (Van Den Hoogen, 2019).

‘Quick fix: Machine selling likes and followers’, interactive installation by Dries Depoorter. Source: Depoorter (2019).
The detection of ‘fake followers’ is itself an academic (and marketing industry) undertaking, with online tools employing ‘signals’ (e.g. lack of profile picture; multiple followers with same creation date) and ratios (low like-to-follower ratio) to aid in the hunt (HypeAuditor, 2021), along with more elaborate techniques in the computational literature (Sen et al., 2018) (see Figure 2). It is often reminded that there is a percentage of inauthentic accounts that one has in one’s follower account anyhow, especially influencers’, who are ‘bombarded with fake followers’ (Purba et al., 2020: 2763) and also are used (as well as recommended) as seed accounts for new users building a nascent profile.

Comparison of percentages of fake followers on Instagram accounts held by political figures, media organisations and others, according to percentages of ‘mass’ and ‘suspicious’ followers, 2019. Source: Colombo and De Gaetano (2020).
Most recently, in the study of the platform, Instagram, like other social media, has been found to have a misinformation problem, first in its artful usage by Russian disinformation operatives and their unknowing co-conspirators during and especially after the 2016 U.S. presidential election campaigning (Howard et al., 2019), and also by purveyors of dubious content about COVID-19, vaccines and other contemporary topics (Cinelli et al., 2020; Colombo and De Gaetano, 2020; Massey et al., 2020). Whilst more attention in this regard has been paid to Facebook and Twitter, Instagram also has renewed promises of vigilance in their content review and moderation, an issue that came before them some years earlier with images associated with pro-eating disorder as well as other content removal controversies (Chancellor et al., 2016; Gerrard, 2020). Faced with content moderation, adherents in these communities would circumvent platform curbing through complex lexical and other manoeuvring (e.g. a hashtag switch from #thighgap to #thyghgapp). Other work has focused on users whose accounts were unexpectedly or illegitimately suspended. They have described inflexible account policies and clunky review pathways (Myers West, 2018). If cut off by the platform, account reinstatement has proven arduous.
Instagramism and style spaces
As it is an image-driven platform, Instagram (but also 4chan, which is treated briefly below), is often associated with image analysis, particularly selfies; however, much scholars remind us that those pictures comprise a relatively miniscule percentage of the images uploaded to the platform (Caliandro and Graham, 2020). It is said to have its own aesthetic, or evolving aesthetics (Leaver et al., 2020), and as such can be approached as a ‘style space’ (Manovich, 2011a).
With the notion, Instagramism, Lev Manovich (2016) seeks to capture the movement to create and record beautiful forms and appearances in a way that enables building (and maintaining) a following, evidenced by overall follower count and likes per post. He describes Instagram styling as design photography. It could be similar in composition to that in Kinfolk, the international ‘slow lifestyle’ magazine (Manovich, 2017) (see Figure 3). Many Instagram users are said to expect staging. Indeed, the practice of sharing a photo after meticulously setting the scene contrasts with the pointing, shooting and sharing performed on other platforms, including messaging apps, where the aim is the maintenance of ‘ambient intimacy’ (Burgess and Baym, 2020).

Instagramism. Design photography by Instagram users. Source: Manovich (2017).
Both selfie culture as well as Instagramism also could be said to be another instance of the internet hitting the streets, in at least two senses. The one concerns ‘place-making’ (Pink, 2008), that is, how shops, restaurants, museums and other locales are Insta-styled. They may create a space where Instagram-type photos can be taken, but they also may create a mise-en-scène that could be termed Insta-photogenic (Budge, 2020a). Platform-place-making is a form of ‘gathering power’ (Casey, 1996) that privileges streets, buildings, bridges and squares by becoming Insta-destinations at once heavily hashtagged and geotagged (Boy and Uitermark, 2017). A second sense is what is sometimes termed participatory or ‘social photography’ (Budge, 2020b). Instagram-ready picture booths or styled settings are constructed for events, in order for platform users to have their pictures taken, eager to be remembered as a part of it (in front of the backdrop and associated with a hashtag). They also can snap their own selfies, individual or group ones, and subsequently post them with event hashtags, and other individuals tagged, to not just belong but also to be viewed and ‘liked’, thereby building platform capital.
Image similarity – Reuniting reused images
Studying style spaces could be performed by image grouping by similarity, or by using software that compares and groups similar images. As in other projects that employ it, such as network analyses, the grouping is a step in a more elaborate analytical procedure, rather than the endpoint. For example, ImagePlot (Software Studies Initiative, 2011) and ImageSorter (Visual Computing, 2018) group images according to their formal properties. Ingesting a collection (or folder) of images, the software orders them most often by similarity, particularly hue or saturation (see Figure 4). One use of such image grouping is to study the reuse of the same or similar images. The analysis rests on how the software bunches together similarity and sameness rather than sameness only. In other words, the cluster will amass both high-res as well as ‘poor images’ (Steyerl, 2009) of the same as well as visually similar ones. The poor image is one that is of lower quality than the original or the copy, because it is the product of copy and paste, reworking for meme production, downsizing for a thumbnail or a preview, or otherwise processed downward, so to speak.

Image grouping. Originals, copies, original copies and poor images group together. Source: Geboers et al. (2020).
Another image type of interest in this regard is the ‘original copy’, a term for digital imagery that blurs the distinction between the original and the copy (Fehrmann et al., 2010). It is described as secondary images, or off-shoots, that attain the status of the original. These, too, would be grouped together because their properties compare well with the original and any copies, however poor. Thus, software could be said to reunite the original with its reuses, such as the copy, the original copy as well as the poor images.
Image trends and vernaculars
The software output of arrayed images may be the starting point of an analysis into what the image groups communicate per subject matter or issue, or how the medium may shape the form the message assumes. As a case in point, the images associated with #climatechange on Instagram or Twitter, for instance, can provide a sense of how the framing of the issue is evolving (in a form of social or environmental communication research) (see also Figure 5). With the entrance of youthful activists and influencers such as Greta Thunberg and Extinction Rebellion, are we seeing more urgency expressed in the imagery (burning planet)?
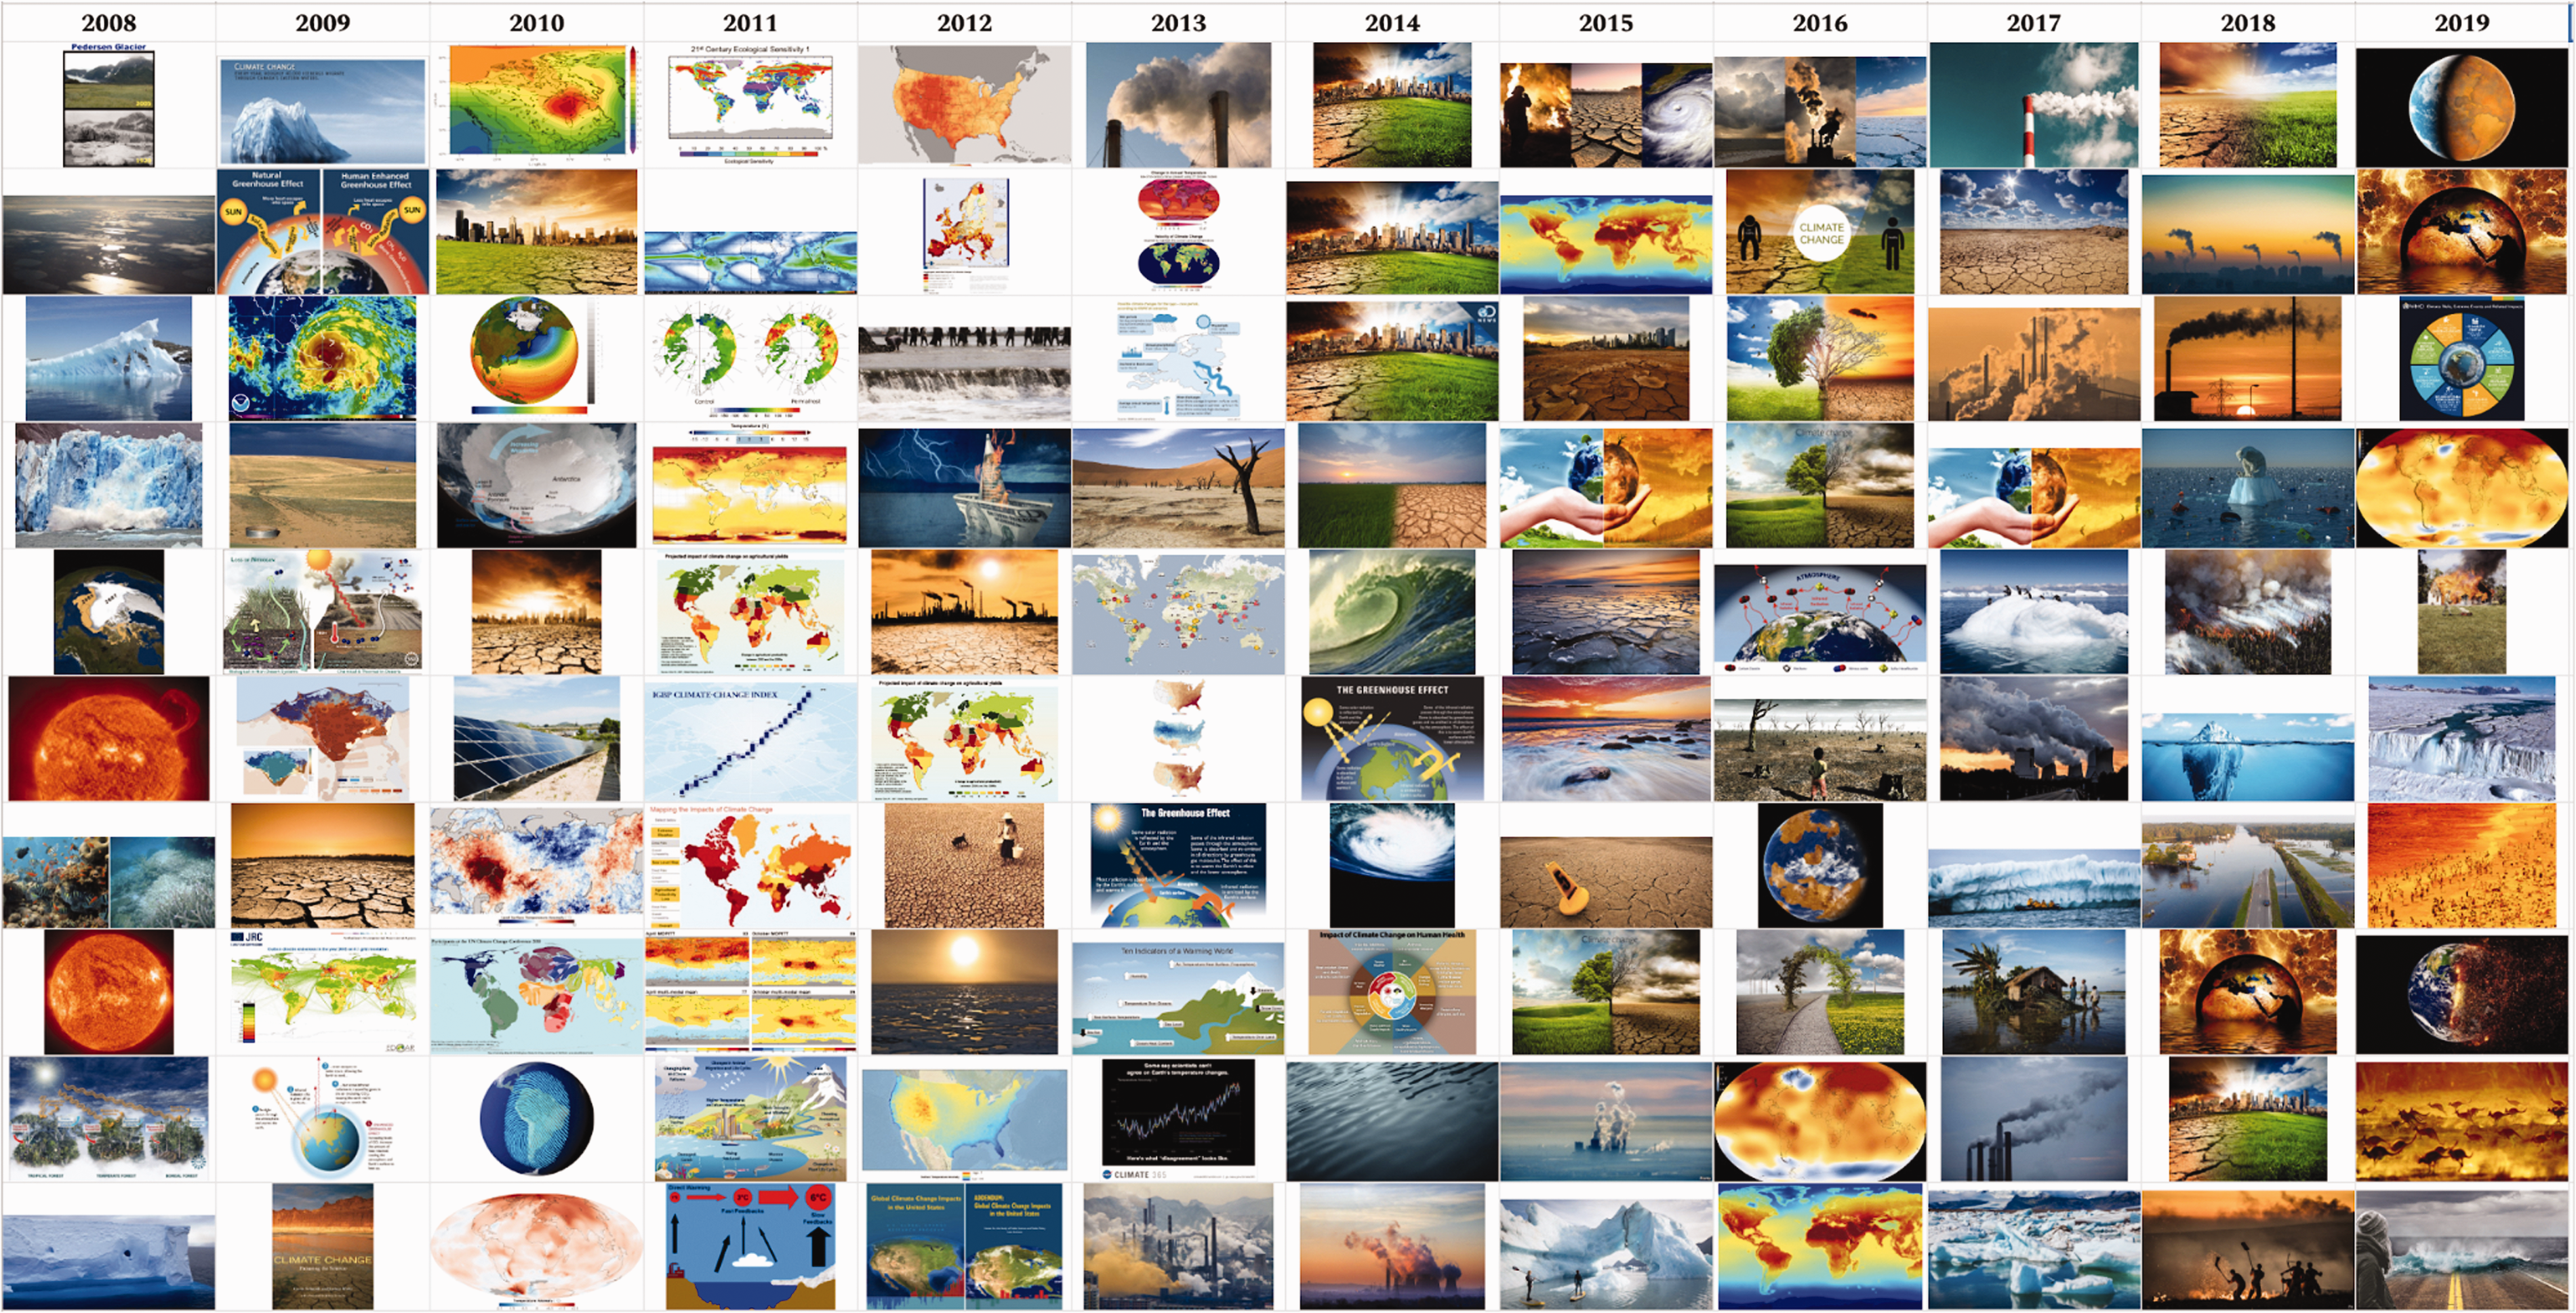
‘Climate change’ query results from Google Image Search, overtime, 2008–2019. Source: Pearce et al. (2019a).
We also may examine how platforms depict an issue in a particular manner (Niederer, 2018; Pearce et al., 2019b). Overall, when sorted by popular posts tagged with #climatechange, Instagram may portray more individual ‘small actions’ (‘teens plant trees’), whereas Twitter may have more of the charts and figures of science, or the memes of politicians (French Premier Macron’s ‘Make our planet great again’). Depending on the platform used to access the issue, the question of who acts, and how it is visually displayed, is answered differently.
Studying how platforms, or communities within them, have a particular style of presentation and cultures ‘native’ to them is also known as platform vernacular research (Gibbs et al., 2015). In a particular issue space such as climate change, the one will prefer a certain format (the landscape), whereas the other routinely deploys another (the chart). To visualise such image languages or vernaculars, there is the image stack technique, which falls under the larger category of composite images (Colombo, 2018). In this visualisation practice, the order of the images is retained, and each image’s opacity is lowered equally (e.g. with 10 images, each is dimmed by 10%). The retention of the order of the layers grants more visibility to the higher ranked images (see Figure 6). Ranking here also can be by engagement score.

Image composites comparing top 10 most engaged-with climate change images across platforms, and technique. Source: Colombo (2018) and Pearce et al. (2019b).
Platform vernacular research, it should be pointed out, ought not ignore the absence of a typical user of a social media platform (Gerlitz and Rieder, 2013), let alone one with over one billion registered users, as Instagram. There are myriad uses of platform, be they documenting everyday life, styling like an influencer, campaigning or posting pictures of kittens (Caliandro and Graham, 2020); diversity of use lies within countries and cultures (Leaver et al., 2020). But, as discussed below, when one queries Instagram, demarcates a substantive space and compares it to the same space on another platform, meaningful distinctions for media and social research may emerge. For example, one platform may perform content moderation particularly well or poorly, in one language space versus another, when the topic explored is the relationship between 5 G and COVID-19, a subject of popular conspiracy theory (EU DisinfoLab, 2020). One may have more divisive content, others healthier dialogue (Niederer and Colombo, 2021).
The dominant image
Whether for social or media research, there are basic approaches to studying sets of images with software. When one orders images by formal property and outputs an array of them in the form of an image wall or cluster map (for example), initially one will note one or more dominant images (see Figure 5). The dominant image may be studied in terms of a format (such as meme) or as a message (slogan or counter-slogan). It should be noted that the technique also shows the opposite of the dominant. It yields marginal and orphan images. One may also place arrayed image collections from competing hashtags side by side – #blacklivesmatter and #bluelivesmatter or #protectthevote and #stealthevote – so as to enable comparative dominant and marginal image analysis.
There is an additional application, exemplified in work performed on the use of the climate-related hashtag, #parisagreement, before and after U.S. President Trump’s announcement in June 2017 that the U.S. would withdraw from it (see Figure 7). Here, the software allows one to compare the quantities of images, and thus activity, one month before and after in a form of ‘direct visualisation’ of all the images (compared to translating the images to data points and visualising as a data representation, as in Figure 2) (Manovich, 2011b; Niederer and Colombo, 2019). It allows for both a distant reading (Moretti, 2013) in the quantity comparison as well as a close reading as one can zoom in and take note of the dominance of ‘Make Our Planet Great Again’, the placard-like image (and cut-out hashtag) that launched the campaign by French President, Emmanuel Macron, on 1 June 2017, in reaction to the Trump announcement. With the U.S. abdication, it calls on France (and Europe) to lead the way. Here, close reading refers both to the method as well as the account one can make from it (Schur, 1998).
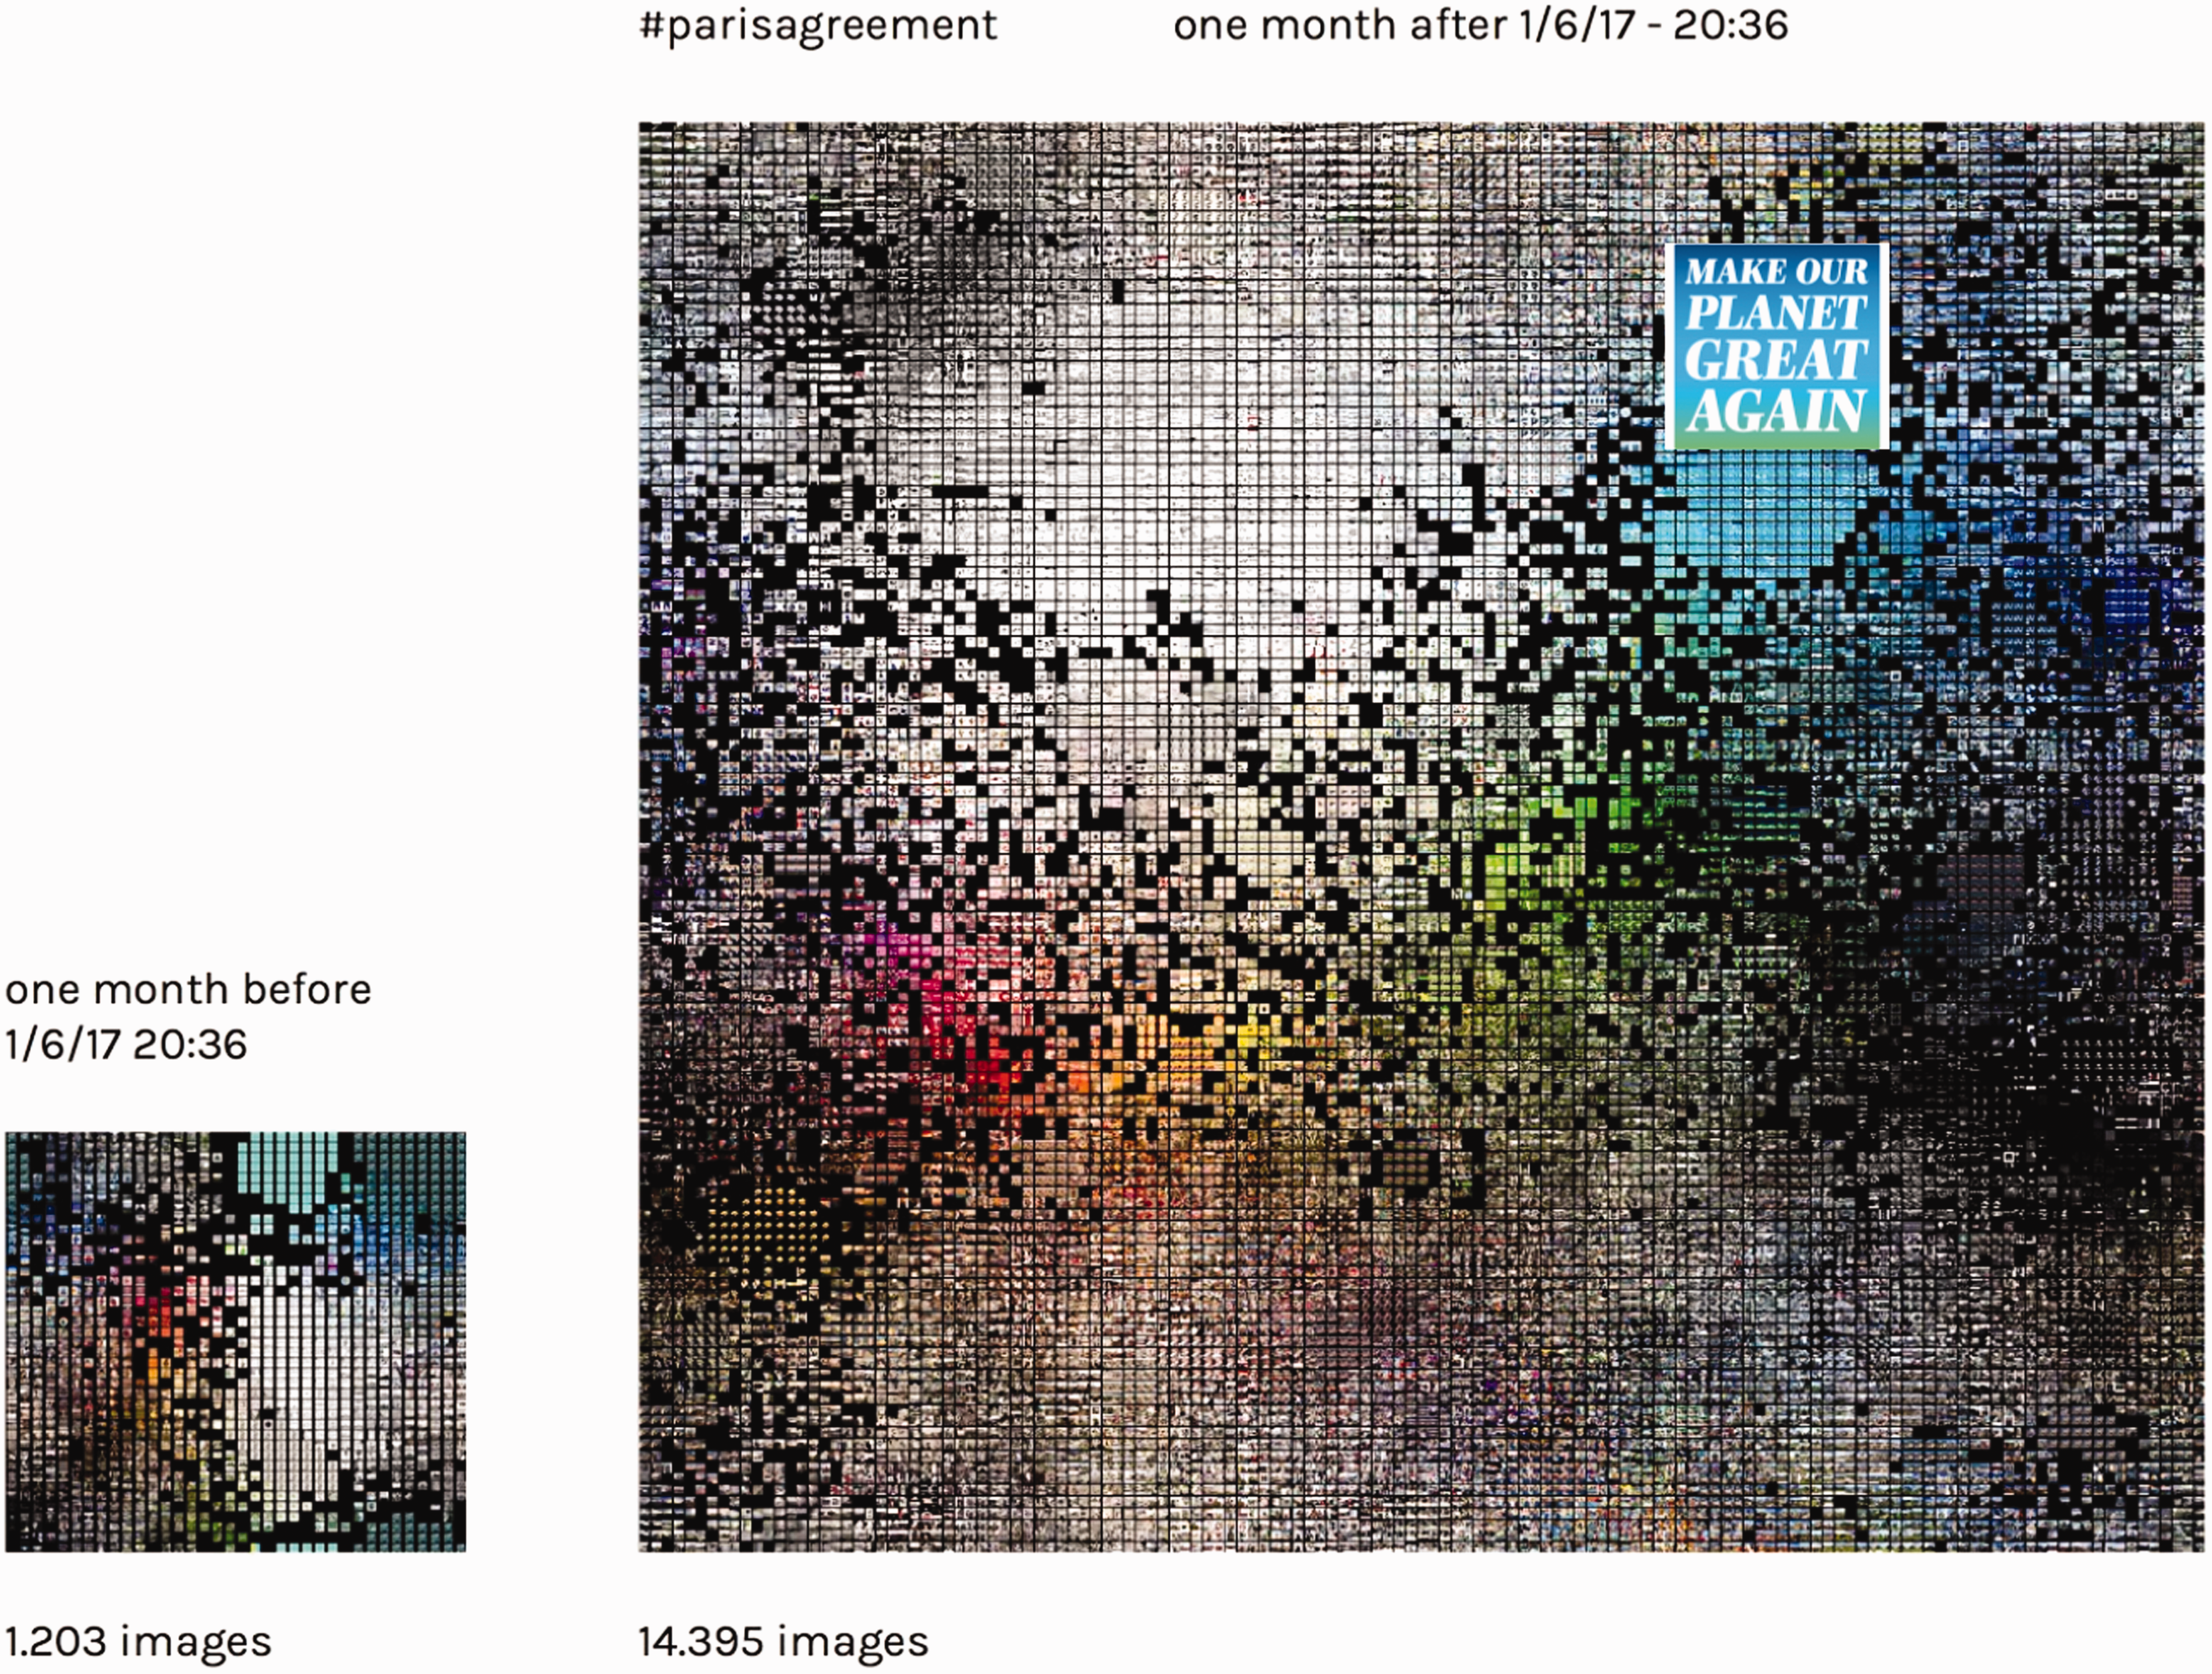
Dominant image analysis with ImageSorter. French President Macron’s meme, ‘Make our planet great again’ as dominant image on Instagram, both one month before and one month after U.S. President’s Trump announcement that the U.S. would withdraw from the Paris climate agreement. Source: Niederer and Colombo (2019).
But the software also can order the images chronologically. If, in a cultural analytics approach (Manovich, 2020), one studies the digitised covers of a magazine over time, or the works of an artist, one can pinpoint instances of change in order to enable a fledgling periodisation (Manovich, 2016). A large collection of Instagram images, chronologically visualised, could point to larger style trends, such as the rise (and potentially fall) of a particular aesthetic associated with the platform. Is Kinfolk waning in favour of cottage core, the internet aesthetic associated with an idealised rural life? Or are particular formats becoming dominant (e.g. sudden memeification of an issue space)? In both examples of image analysis with software – grouping by formal property and ordering by date – the metapicture is the prompt for interpretation. The interpretative work is often practically undertaken through forms of annotation: labelling the clusters and the transition points and periods, respectively.
Instagrammatics – Querying for image sets
Whereas Instagramism could be construed as media style and trend research, Instagrammatics is closer to internet as well as social research (Highfield and Leaver, 2016). It utilises queries of the Instagram Application Programming Interface (API) (when it was accessible), Instagram scrapers, CrowdTangle or other social listening software, making collections of posts for further interpretive study. Queries can be made of hashtags, user accounts and geo-coordinates, including combinations thereof. Hashtag-based queries include influential single hashtags (#blacklivesmatter, #metoo, #stealthevote), sets of related hashtags or competing hashtags (either single or sets of related ones such as #lovewins and #jesuswins – see Figure 8). One may create co-hashtag maps and label the clusters, showing the subcultures or discourses in a particular movement or issue space, such as ‘settler superiority’ in Canada’s indigenous territories (Karsgaard and MacDonald, 2020). Here, Instagram becomes a platform to study the size of publics and counterpublics, together with their discursive imagery and hashtags.

Geo-locating posts tagged #lovewins or #celebratepride (program) and #loveloses or #jesuswins (anti-program) after the U.S. Supreme Court ruling on same-sex marriage, 2015. Source: Rogers (2018).
The queries also can be user accounts, e.g. influencers. When queried together with hashtags, the research could concern the extent to which influencers use responsibly their symbolic power and voice, both generally and in a particular hashtag space (Niederer and Colombo, 2021). The queries could be geo-coordinates. The sourcing of a set of geotagged posts, together with a date range, may result in a collection of images of an event, such as the storming of the U.S. Capitol building. Geotagged posts from Washington, DC on 6 January 2021 (the day of the storming) would be a collection of significant historical interest. Making such a collection close to the event, and subsequently making another one with the same query design sometime later, would enable the study of content moderation, the cleaning up of the platform and of evidence. Combining geo-coordinates with hashtags, such as in the well-known #selfiecity project, opens further avenues of analysis, for it allows one to geo-locate particular moods and sentiments (Tifentale and Manovich, 2015). Where is #stealthevote most prominently located? Is it just as urban as rural?
Metapictures as visual media analysis
I would like to turn to a set of metapictures that, like Instagrammatics, result from visual media analysis with digital research methods (Rogers, 2019) but make image sets from other platforms, including Wikipedia, Google Image and Web Search, Twitter, Facebook as well as YouTube. One is a technique that creates an image grid that compares the presence or absence of images in articles about the same subject matter but written up in different languages on Wikipedia. How to interpret ‘missing’ images? Another examines the top images for a Google Image Search of Gezi Park (Istanbul) protests, extracting the embedded metadata in the pictures taken, in order to determine the price of the cameras that took them and the presence of citizen journalists in the so-called ‘pop-up news ecology’. A third employs a ‘staining’ technique that shades (and, in a sense, tarnishes) search engine results that are construed as preferred placement or misinformation. The others concern the posts (with images) that most animate a movement or group on Facebook, the emojis that are used in tandem with particular war images, the videos (expressed as thumbnail images) referenced by 4chan users that have been removed by YouTube and the contrasting feeds of U.S.-based conservative and progressive Facebook users.
Image presence
In the study of cultural (and national) points of view on Wikipedia, Emina Sendijarevic and I deployed cross-cultural (or cross-lingual) image analysis to compare the ‘same’ articles in different Wikipedia language versions (2012). Certain images are dear to one article to make a cultural case, whilst conspicuously absent in another (see Figure 9). The absence may explain or provide context to emphasis, such as the image of a gravestone of a 13-year-old boy, prominent in the Bosnian article on the ‘Srebrenica genocide’, and for years absent in the Serbian one entitled ‘Srebrenica massacre’. (At the time of writing it is a part of a ‘picture gallery’ on the bottom of the Serbian article, rather than incorporated into the article itself.) The image analysis, outputting a grid, or rows of images from each article next to one another, shows either their order (and thus prominence) or their matches (and thus distinctiveness). It can include the templates, too, such as if an article has an issue with its ‘neutral point of view’ (in this case the Serbian) or has attained the status of ‘featured article’ (as has the Bosnian).

Image grid analysis comparing images in the ‘same’ Wikipedia article on the Srebrenica massacre/genocide across different language Wikipedias. Image insert is of the grave of a 13-year-old boy, present in the Bosnian and not present in the Serbian article. Source: Rogers and Sendijarevic (2012) and Rogers (2013).
The cross-cultural image analysis may be paired with other analytical techniques such as comparing references from two or more articles or placing side by side (translated or original-language) tables of contents, where one notes for example that the Bosnian article on the Srebrenica genocide closes with a section on revisionism and the Serbian-language Srebrenica massacre piece with the controversy of calling the events a genocide. The cultural specificity of the differing accounts of the events continues decades later, seemingly hardening in stance rather than dovetailing. Stance solidification over time may also be depicted by highlighting the lack of change. For example, one accentuates (through shading) telling section headers or sentences that have long endured.
Image quality and camera grade recognition
In data journalism research, a technique in the open source intelligence tradition may be utilised for a form of ‘source criticism’, where one is interested in the origins of the source, in our case whether a picture was taken by a professional grade camera (and thereby presumably by a professional photojournalist). With EXIF data one can discern the camera type, date the pictures and examine the extent to which it has been edited or ‘touched up’. One can look up the prices of the cameras, too.
This form of visual media analysis may be applied in the examination of the apparent significance of citizen journalism and the ‘pop-up news ecology’ (Wall and el Zahed, 2015) at Gezi Park in Istanbul as demonstrators gathered in 2013 to protest the planned construction of a shopping mall in the urban green space (Ozduzen and McGarry, 2020). The environmental concerns evolved into multi-issue, political demonstrations, met with water cannons and other security apparatus, where many images were taken by the protesters themselves and subsequently circulated. It often has been argued that amateur or citizen documentation of events is significant in how they are reported and ultimately remembered (Robinson, 2009). They may challenge dominant and official accounts (Robinson and DeShano, 2011); they may supply alternative (evidentiary) material (Bruns and Highfield, 2012).
In an analysis of Google Image results for the query ‘Gezi Park’, we found that particularly iconic images (particularly the ‘lady in the red dress’ peppered sprayed by a policeman) remained at the top for well over a month (see Figure 10). Thus, searching Google Images for events would not be a way to follow the goings-on, as they rather cement depictions rather than track them, at least at the time.

Top images in Google Image Search for ‘Gezi Park’, 26 May–3 July 2013. Source: De Amicis et al. (2013).
In the event, the iconic photograph of a lady in a red dress was taken by a professional photojournalist. Other top-ranked images were also shot by photojournalists or stringers.
Particularly poignant findings can be made on the basis of the metadata available in the images made iconic by Google in the sense of granting them their presence at the top of the results over time. Examining the data embedded in the top images, or EXIF data, we found that the photos with the most staying power were taken by professional grade cameras and edited by costly software, rather than from smartphones or cheap consumer devices without filters (Allan, 2015; De Amicis et al., 2013). We thereby relied on both ‘mechanically captured metadata’ (e.g. camera make, exposure) and that derived from user activity (software editing) (Hochman, 2014; Rubinstein and Sluis, 2008). Looking up the brands and models, we graphed the price tags of the cameras that took the top images, showing the continued significance of professional journalists and their documentation of the events rather than (mainly) upstart citizen journalists, at least in the event documentation returned by Google Image Search.
Image staining (or tarnishing)
A third example of visual media analysis is in the realm of search engine returns critique, otherwise known as algorithmic auditing (Sandvig et al., 2016). How to make an account to describe and expose the trouble with the top returns for an engine query? In the legal, commercial realm, accounts are often made of how search engines return their own properties (or those that bought space) at the top of the results, once known and scandalised as preferred or paid placement (Vaidhyanathan, 2012). Google notoriously returned its own e-commerce site over those of its competitors, landing itself in antitrust lawsuits (Romm, 2020; Scott, 2017). It is also accused of populating search engine returns with its own services, YouTube videos as well as information (or knowledge graph) panel, prior to serving other ‘organic’ results, as they are known in industry parlance. For example, search for any place and one is returned ‘Google places’. In the event, in 2019 Google reached a milestone in that more 50% of Google searches resulted in zero organic clicks (Fishkin, 2019).
Autocomplete (when the engine suggests a query) has been criticised for its ill-mannered suggestions (Baker and Potts, 2013). Autosuggested completions for Jews, for example, prompted the engine company to intervene, removing offensive outputs (Cadwalladr, 2016). Google ads have been found to be racist, raising the question of how algorithms work, and whether (and how) their training material should be reconsidered (Sweeney, 2013). Google images have been found to have issues of representation when comparing the outputs of professional versus unprofessional hairstyles for work as well as pregnancy versus unwanted pregnancy (Bogers et al., 2020; Noble, 2018). In both cases, the research strategy of employing ‘counter-queries’ (e.g. ‘professional’/‘unprofessional’) serves to root out what is considered the ideal.
There are metapictures of preferred placement or rankings of one type of result compared to others that make use of annotating or ‘staining’ certain results and leaving others alone (see Figure 11). In one example, a journalistic piece emulates scrolling through engine results and by shading Google properties demonstrates that the first 35% (quite a long scroll) are Google’s own (Jeffries and Yin, 2020). (The article is entitled: ‘Google’s top search result? Surprise! It’s Google’.) The scrutiny of engine results by classifying them one way or another (through the lens of discrimination, misinformation, political leaning and other manners) can be visualised by colouring cells in a spreadsheet, as in misinformation is reddened, whilst other information is left blank (Torres and Rogers, 2020). One notes both the placement and amount at a glance. The ranking of a website for the same query over time may be graphed, for example in the Issue Dramaturg project that portrayed the ‘drama’ of search engine space as a website, routinely returned at the top of the results, one day vanishes from the first 1000 returns, likely because of an algorithmic ‘update’ (Rogers, 2013). Changes over time to rankings are also visualised with RankFlow, where one compares how a number of websites or videos in YouTube, for example, wax and wane in the search engine returns (Rieder et al., 2018).

Image staining technique. Percentage of an entire page of Google results that contain Google properties. Source: Jeffries and Yin (2020).
Image circulation
Apart from critiquing their occasional, discriminatory labelling practices, lack of ethnic diversity and the scraped origins of the training sets behind them (Crawford and Paglen, 2019; Sinders, 2020), computer vision, a catch-all term for the automated recognition and classification of images, may be repurposed for critical social and media research, mainly into image resonance and circulation (d’Andrea and Mintz, 2019) but also as exploratory work into the imagery associated with an event or issue (see Figure 12).

Cluster map of #georgefloyd images from Twitter and Google Vision API labels. Source: Stepnik et al. (2020).
A project studying the adoption of the lean-in photo collection by Getty images is one example (Aiello and Parry, 2020). The stock photo set has been heralded as ground-breaking, for it portrays women in powerful ways rather than as soft, sexualised and motherly (Miller, 2014). But how are these empowering stock images actually put to use in the media? By employing reverse image search (either via a computer vision API or in an image search engine), the research may locate instances of image usage, and enquire into whether they indeed break new ground. The images may be empowering, but their usage, we found, did not match evolution of Getty women’s image usage (from 2007 to 2017) as headlined in a New York Times article as ‘from sex object to gritty woman’ (Miller, 2017). The researchers found that they rather reinforced pre-lean-in collection themes. For example, it was found that portrayals of women in scientific or tech environments were found in stories about the challenges of breaking into the fields rather than ones simply about that work. Working women of colour were used mainly in publications with such a target group, rather than not. The most circulated image from the collection was of a young, white woman with long hair. Thus, the collection, at least in its actual usage, did not appear to meet its goals.
Computer vision techniques offer more than reverse image search for the study of resonance and circulation of particular imagery. They also label images, both in terms of content as well as format. When studying social media images, the labelling of image content has been critiqued for its inability to appreciate the ‘social value of the picture’, which includes the intention of the uploader, such as ‘social capital, self-image and memory’ (Bechmann, 2017). Researchers emphasise how the labelling should be accompanied by data enhancement, namely an additional data layer, such as hashtags (Geboers and Van De Wiele, 2020).
One image format type of interest is the meme, which CrowdTangle detects on Instagram, Facebook, Twitter as well as Reddit. One may search for memes with a keyword query, e.g. #stealthevote, one of the more significant hashtags implicated in the mobilisation of those who rampaged the U.S. Capitol. Given that CrowdTangle enables cross-platform comparison, one notes which platforms have tidied away posts containing the hashtag and which still has them in evidence. The effects of content moderation can be analysed per platform, including its sophistication, whereupon one notes that only those posts that rally people to the cause are now scarce, rather than those that report on it. In another such use case, AFP, the French news wire service, queries CrowdTangle’s meme search for keywords related to misinformation (CrowdTangle, 2021). Misinformation may concern the COVID-19 pandemic or national elections, but also other issues they monitor. Those posts that are ‘overperforming’, a filter one can select, they consider worthy of further investigation and potentially deserving of fact-checking.
CrowdTangle’s coverage, however, has been questioned, given that misinformation (that would constitute election interference) may be circulated in posts not indexed by the system such as by individual accounts and private groups (Tech Transparency Project, 2020).
Image engagement
Studying engagement on platforms, through CrowdTangle or other marketing tools such as BuzzSumo, should not be equated with popularity measures, at least according to Facebook’s head of news feed, John Hegeman (Newton, 2020). In an exchange on Twitter with Kevin Roose, the New York Times tech journalist, he made the distinction between engagement (measured by interactions) and popularity or reach (impressions), which is a common marketing distinction. The latter data point, however, is available only internally at Facebook, indicating the value of the data. The context of the exchange concerns how far-right conservative sources dominate the content with the most engagement on Facebook (Roose, 2020). In fact, the journalist has been making a daily list, posting it from the Twitter account, @FacebooksTopTen. Facebook’s internal list of most popular (measured by ‘reach’), contrariwise, were far less politically charged, thereby downplaying the journalist’s claim and Facebook’s culpability (see Figure 13).
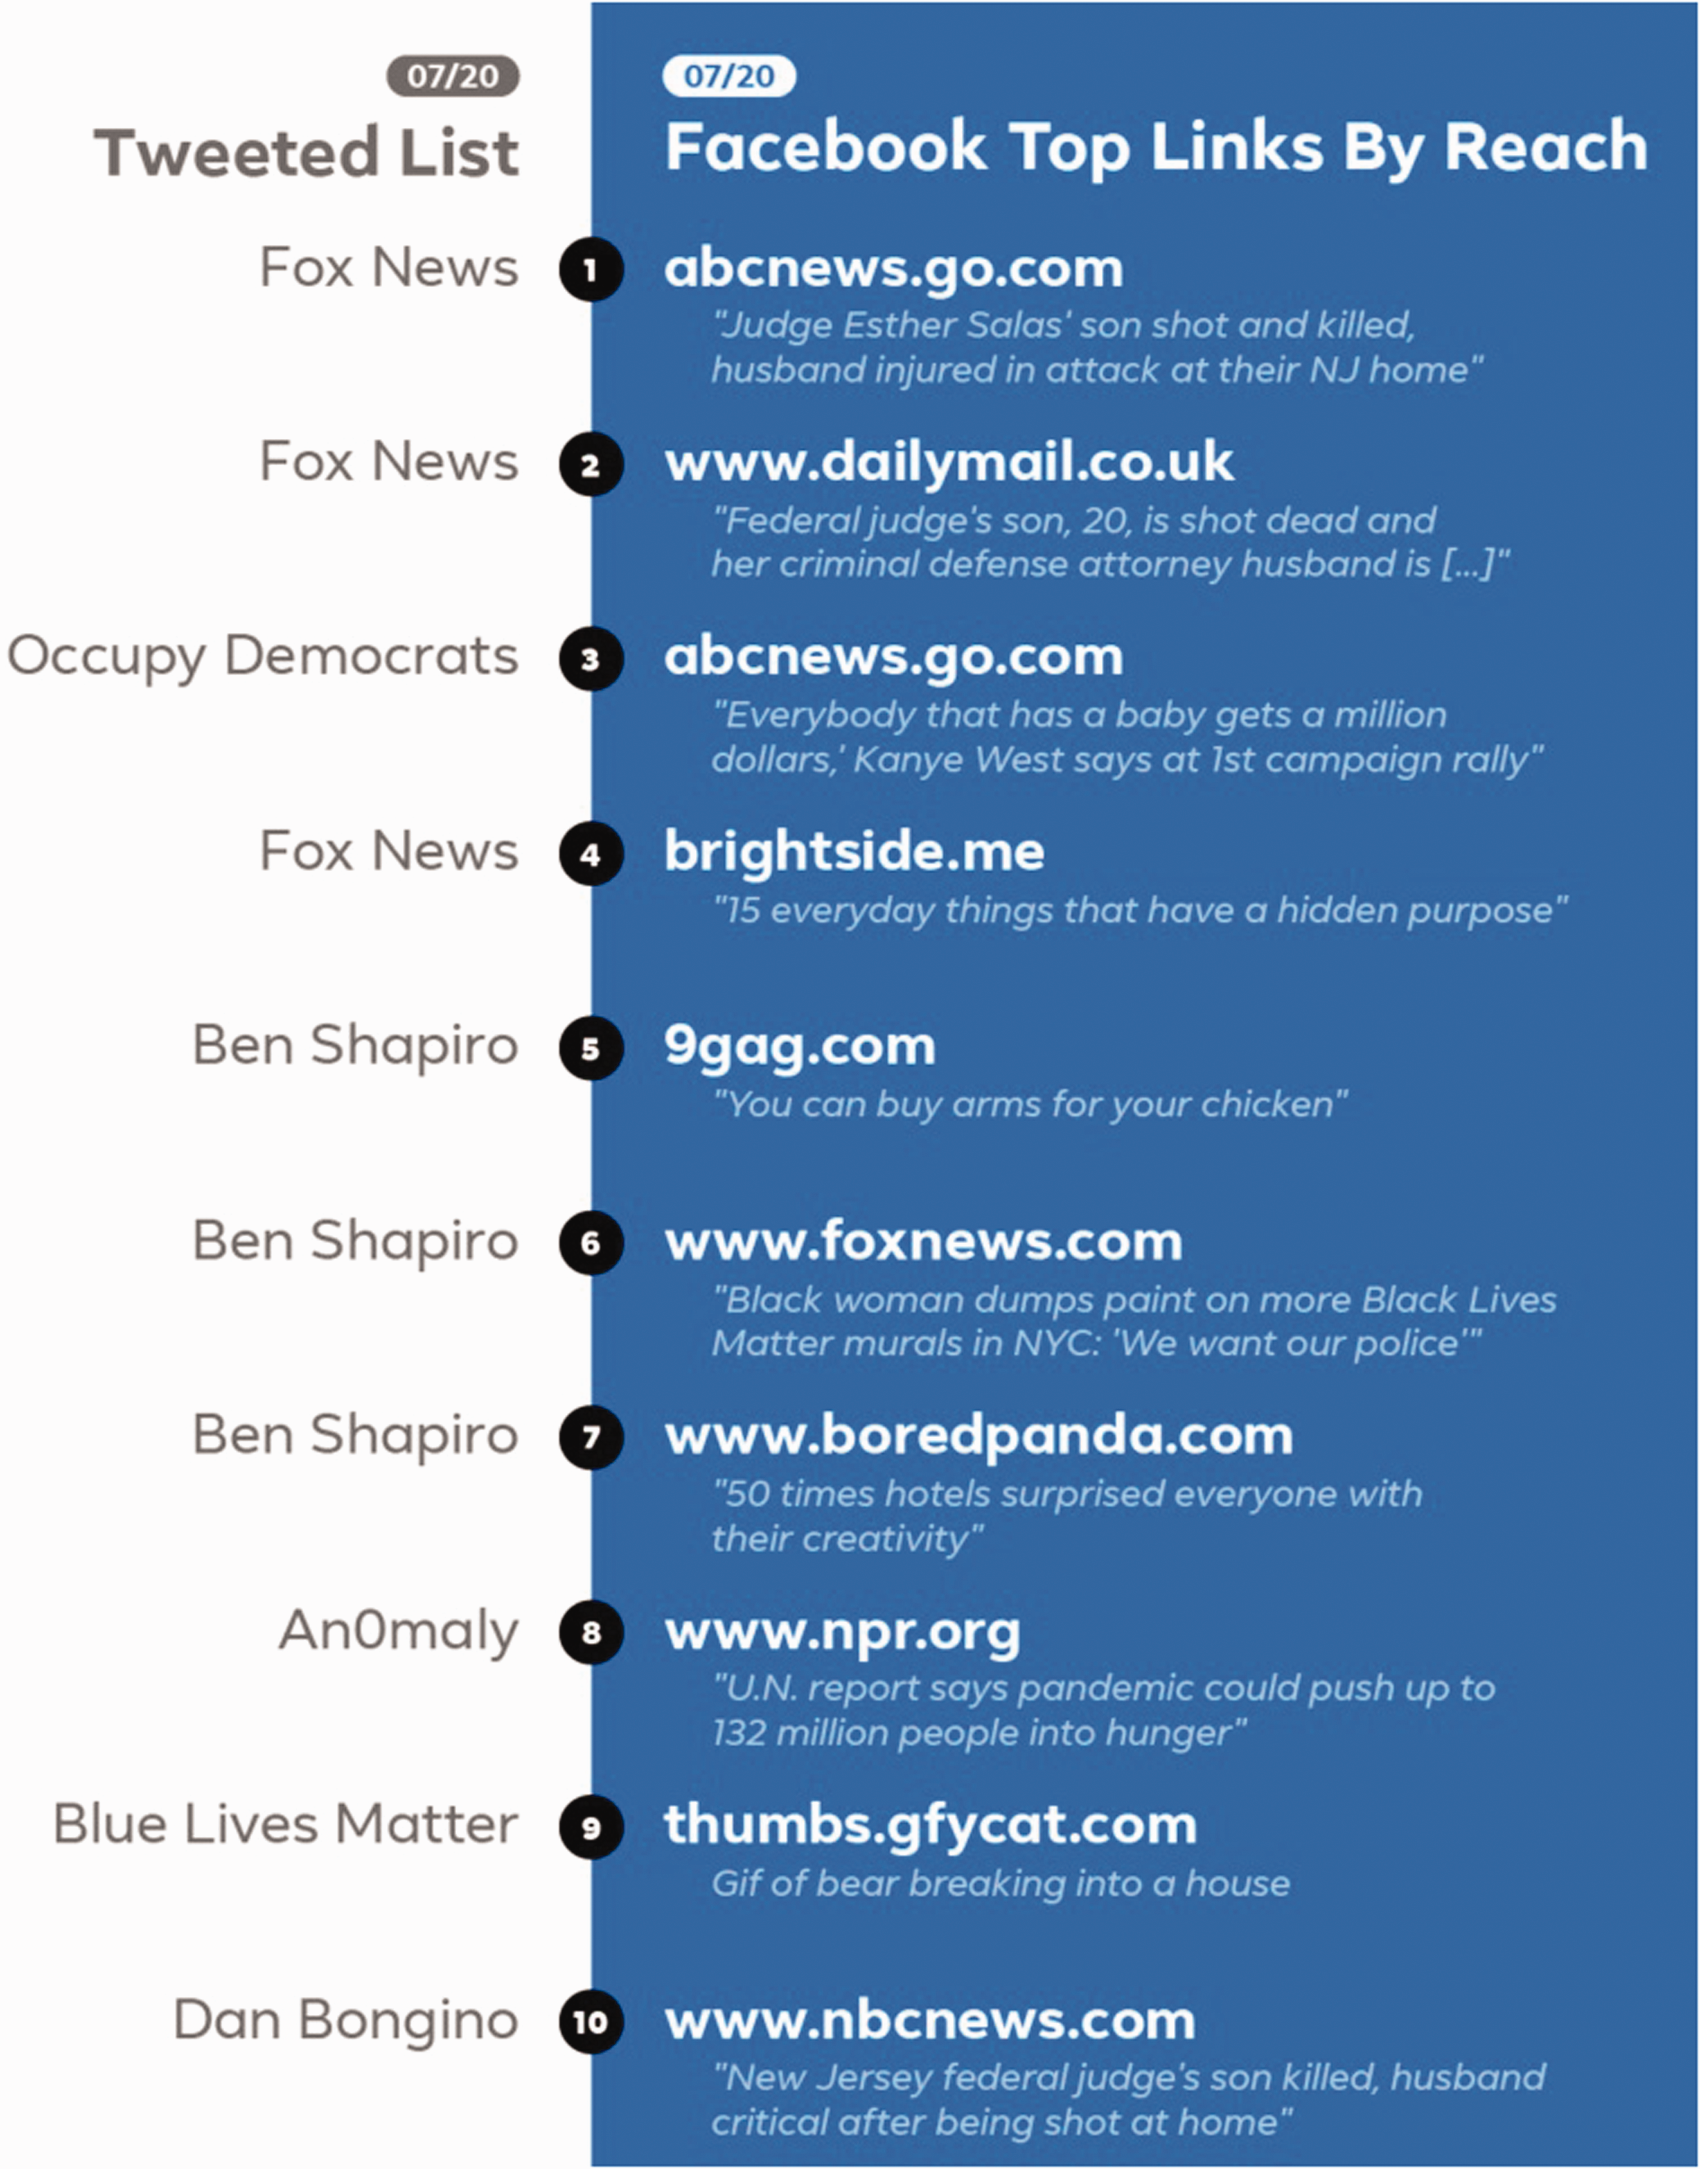
Facebook pages with most engagement (interaction counts, on left) and greatest reach (view counts, on right). List tweeted by Kevin Roose (New York Times), with response by John Hegeman (Facebook).
Showing engagement by ranked list is one method of enabling interpretation (of who’s on top and who’s on the list), and another is a tree map, where visual media posts are resized according to engagement score. It is a visual analysis technique whereby one curates a list of pages or accounts (such as alt-right or less extreme ‘alt-lite’ actors) and subsequently determines which posts have received the highest engagement scores, resizing them by score. In the example of research conducted with the U.K. Home Office, it was found that anti-Islam (or counter-jihadist) posts particularly animated the alt-lite, as visualised, though it should be remarked that other, even more extreme posts may well have been removed (through content moderation) prior to the analysis (see Figure 14) (Alt-Right Open Intelligence Initiative, 2017).

Most-engaged with Facebook posts of set of alt-lite pages, arrayed as tree map, 2016.
Until the advent of what’s referred to as ‘platform lockdown’, Facebook’s Pages API enabled research into how well posts on Facebook are interacted with on a set of pages, such as social movement or protest group (Bruns et al., 2018). One still can undertake that work through the use of the FacePager software or manually. Facebook, however, is nudging researchers away from analysing posts on a predefined set of pages to investigating top-performing posts or web URLs per keyword query.
Image–emoji associations
The comparative study of image formats, more generally, is one operationalisation of platform vernacular analysis. Others would be how hashtags, reactions or emojis are used together with images. On Facebook, for example, sad and angry reactions tend to be chosen together, as was found when analysing posts concerning the Syrian war (Geboers et al., 2020). In order to make findings such as these, one analytical technique is the production and interpretation of a co-occurrence network map, where images and another digital object or artefact (in this case, reactions) appear on the same map (see Figure 15).
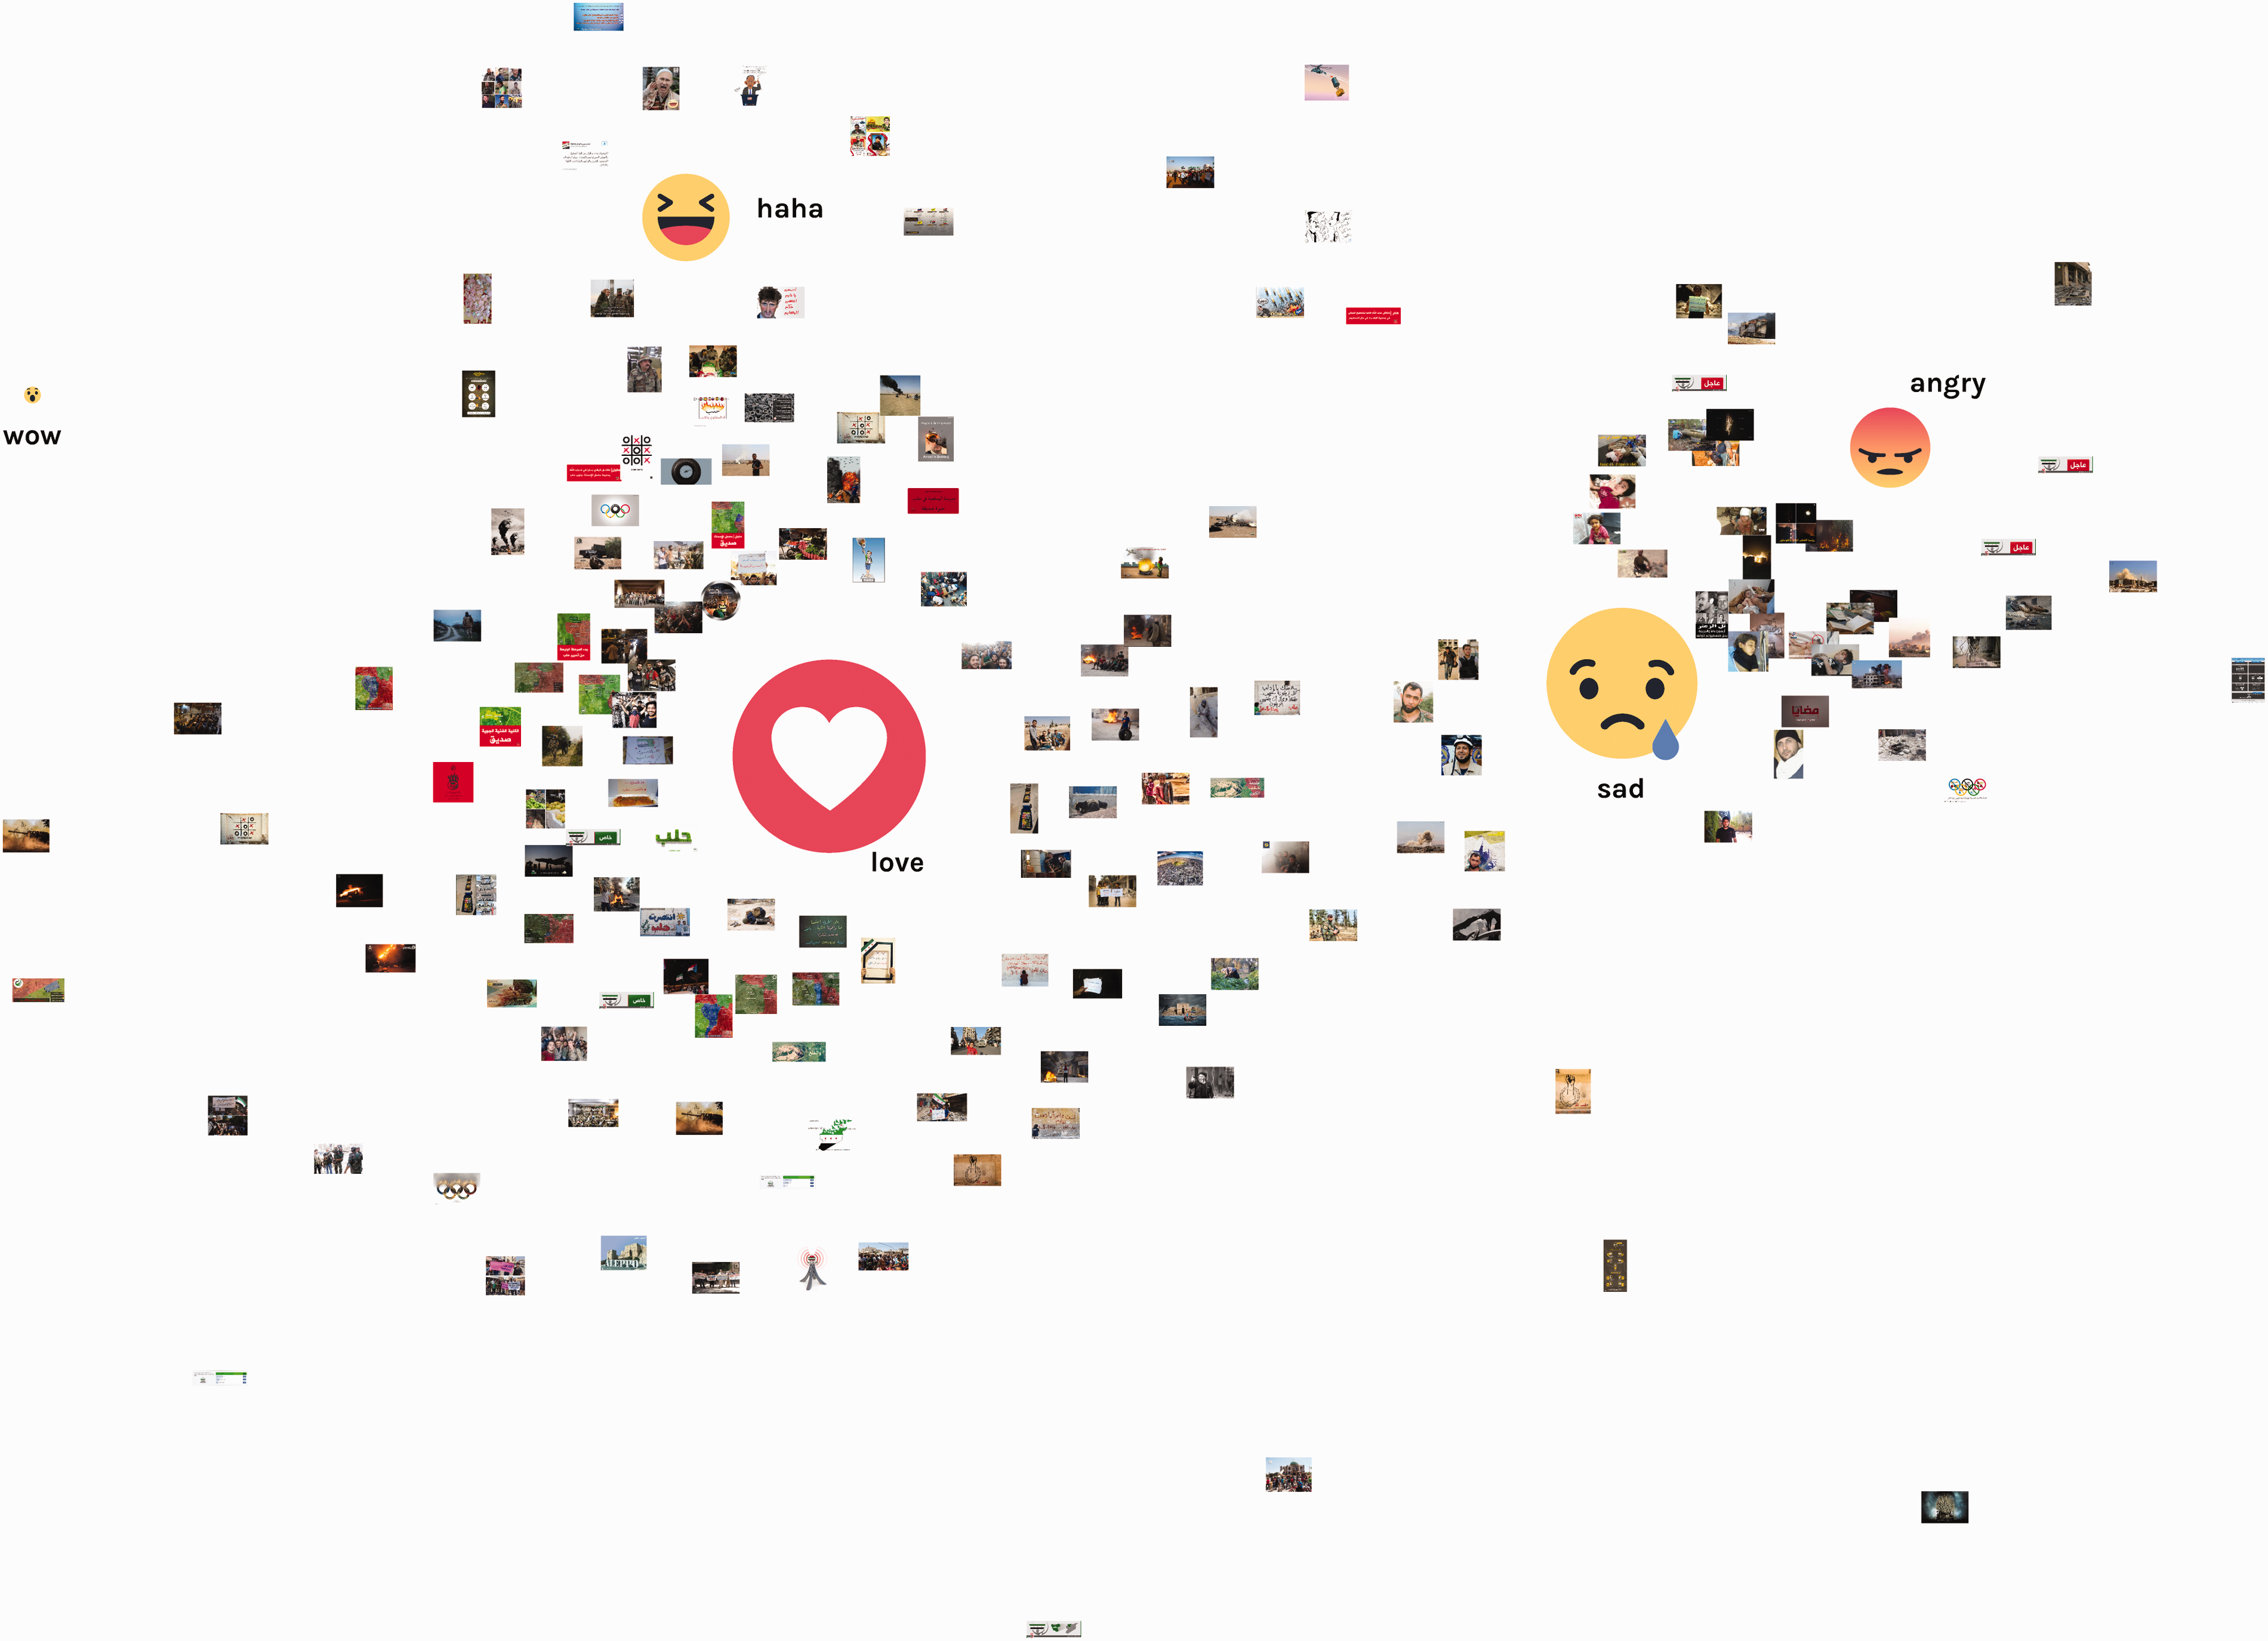
Image-reaction (emoji) bipartite graph from posts on Facebook pages concerning the Syrian war, 2017. Source: Scuttari et al. (2017).
Bunches of images together with hashtags, reactions or emojis come together in a graphing technique that seeks to optimise clustering. It relies on the ‘networkedness’ of the images by virtue of being linked by the same hashtag and/or reaction (Niederer, 2018).
Typically, in Gephi, the network analysis software, a force atlas algorithm is chosen followed by community detection; such a combination encourages distinct clusters to appear. Once so rendered, the second step in the visual media network analysis is to label the clusters by inspecting their contents. For reactions and emojis, one would ask, which sentiments cluster with which images? For hashtag-image networks, the question concerns both how the images may be interpreted through their linkage to hashtags, and vice versa.
Apart from deriving and labelling clusters, visual network analysis has as part of its instrumentarium the study of centrality, brokerage and distance. Which reactions or emojis are central to a particular image space. How far apart are hashtag-image clusters? Which ones link or bridge the subspaces? Here, one annotates and tells stories with network maps.
Image removal
Scholarly attention to 4chan, the image board associated with extreme speech and visual content as well as snark, waxed considerably with the election of Donald Trump as U.S. president in 2016, given the role of/pol/, the ‘politically incorrect’ board, in rallying Trump support through ‘meme magic’ (Ling et al., 2021; Tuters, 2019). 4chan is ephemeral, meaning that it must be routinely scraped or archived for its meaningful study. One can envisage an image grid timeline that is additive, showing in chronological order (per board) what is accruing on the platform. Arraying them in such a manner could show memeification or the hardening (or softening) of content, as also mentioned above in the discussion of the dominant image. Grouping through similarity in an image wall could show the extent to which memes dominate (and which memes).
In an approach where one platform is used to study another, researchers harvested YouTube URLs shared on 4chan/pol/and entered these into YouTube at two intervals in time, fetching the video preview image (and other data) (OILAB, 2019) (see Figure 16). The before-and-after image walls display the widespread (and seemingly simultaneous) removal of videos, though with some still available for viewing. Here, one is able to visualise the scale and timing of content removal, using a presence/absence technique. The videos that survived the sweep become of special interest to study where the platform draws the line, given that they are not quite extreme enough.
Feed competition
The main purpose of putting source sets side by side is to consider alignment or agreement. Comparing Google Image search outputs in 2005 between ‘apartheid wall’ and ‘security fence’ show two distinctively different structures that had just been erected between Israel and the Palestinian Territories, the one concrete and graffitied, and the other lightweight and high-tech (Rogers, 2013). There was next to no agreement between the two sets of visual outputs when comparing the preferred official Israeli terminology compared to the Palestinian.
The comparative display of political media feeds has become prevalent in the past few years, given concern with filter bubbles (Pariser, 2011a) (see Figure 17), or homophilic recommendation systems (Chun, 2018), especially Facebook’s news feed. The ‘Blue Feed, Red Feed’ project by the Wall Street Journal (2016–2019) interactively displayed the stories published by conservative and progressive media sources on Facebook, refreshed hourly (Keegan, 2016). The side-by-side presentation afforded a good view of perspectival divides in media. It was a simulation of stories the users would be expected to receive. In the Citizen Browser project by the data journalist group, The Markup, the technique is taken a step farther, in that they seek not just to simulate the divide in media but rather to demonstrate it by showing the viewers’ actual feeds, i.e. the ‘content social media companies choose to amplify to their users’ (Faife, 2021) (see Figure 18). Feed capture would be a step towards auditing the filter bubble, and the extent to which Facebook’s feed narrows or broadens horizons. Relying on nationwide panels of internet users who donate their feeds to the project, it was found that after the Capitol rampage progressive Facebook users were routinely fed mainstream media such as CNN and NPR, whilst conservative users sources considered rather less reliable (such as The Daily Wire and Breitbart most salient) (Lecher and Keegan, 2021). Reliability measures of sources may be gleaned from NewsGuard, among other media labelling organisations.
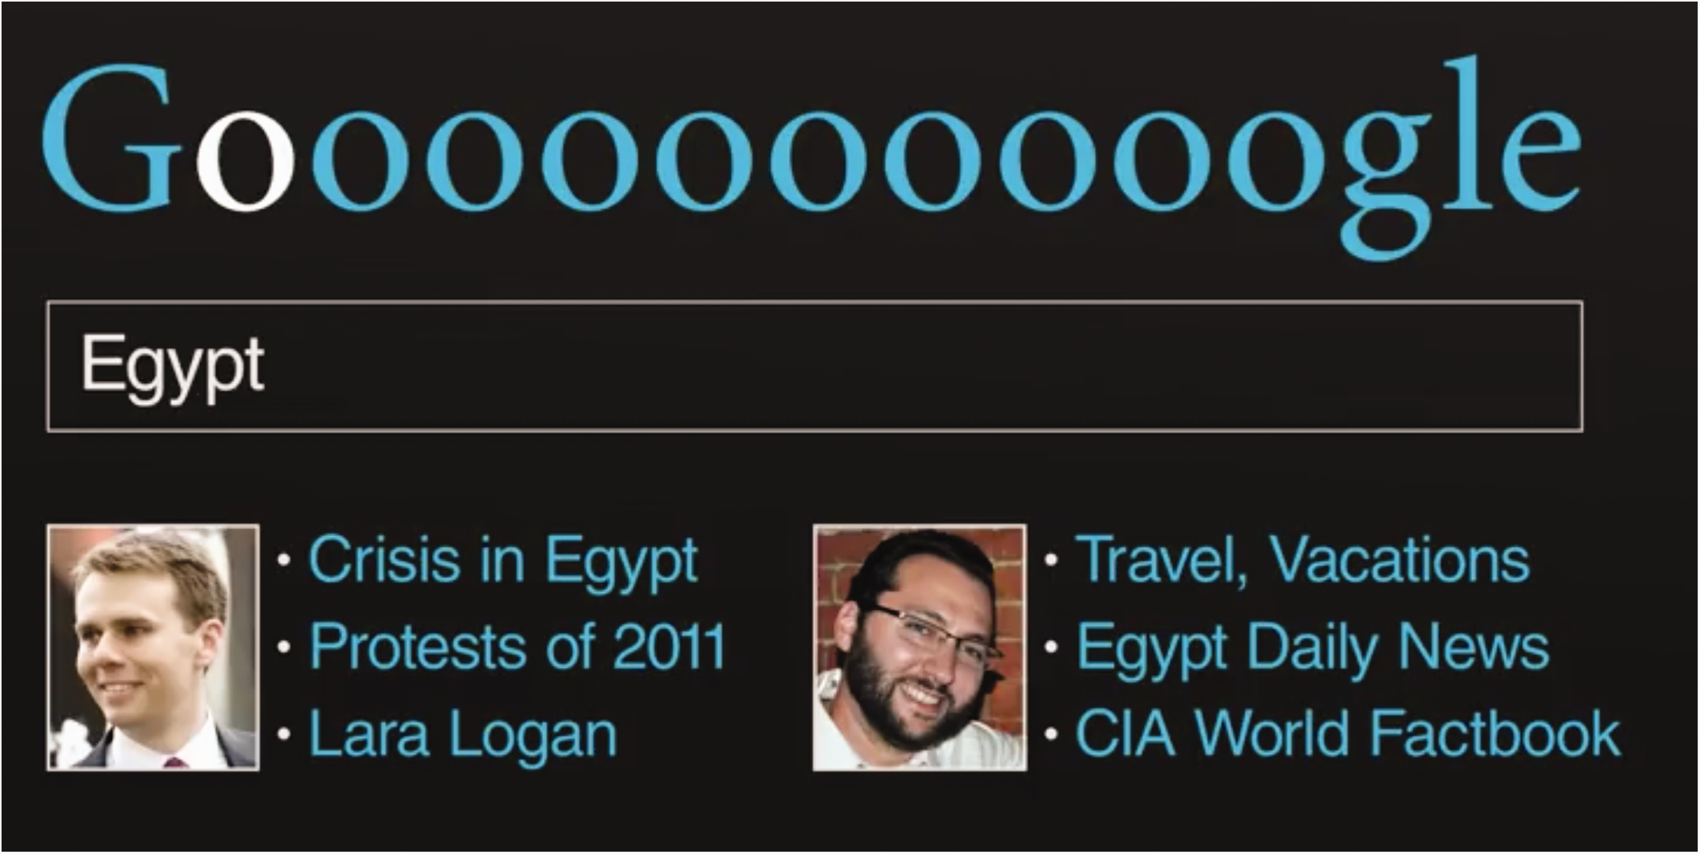
Filter bubble as differing personalised Google results. Source: Pariser (2011b).
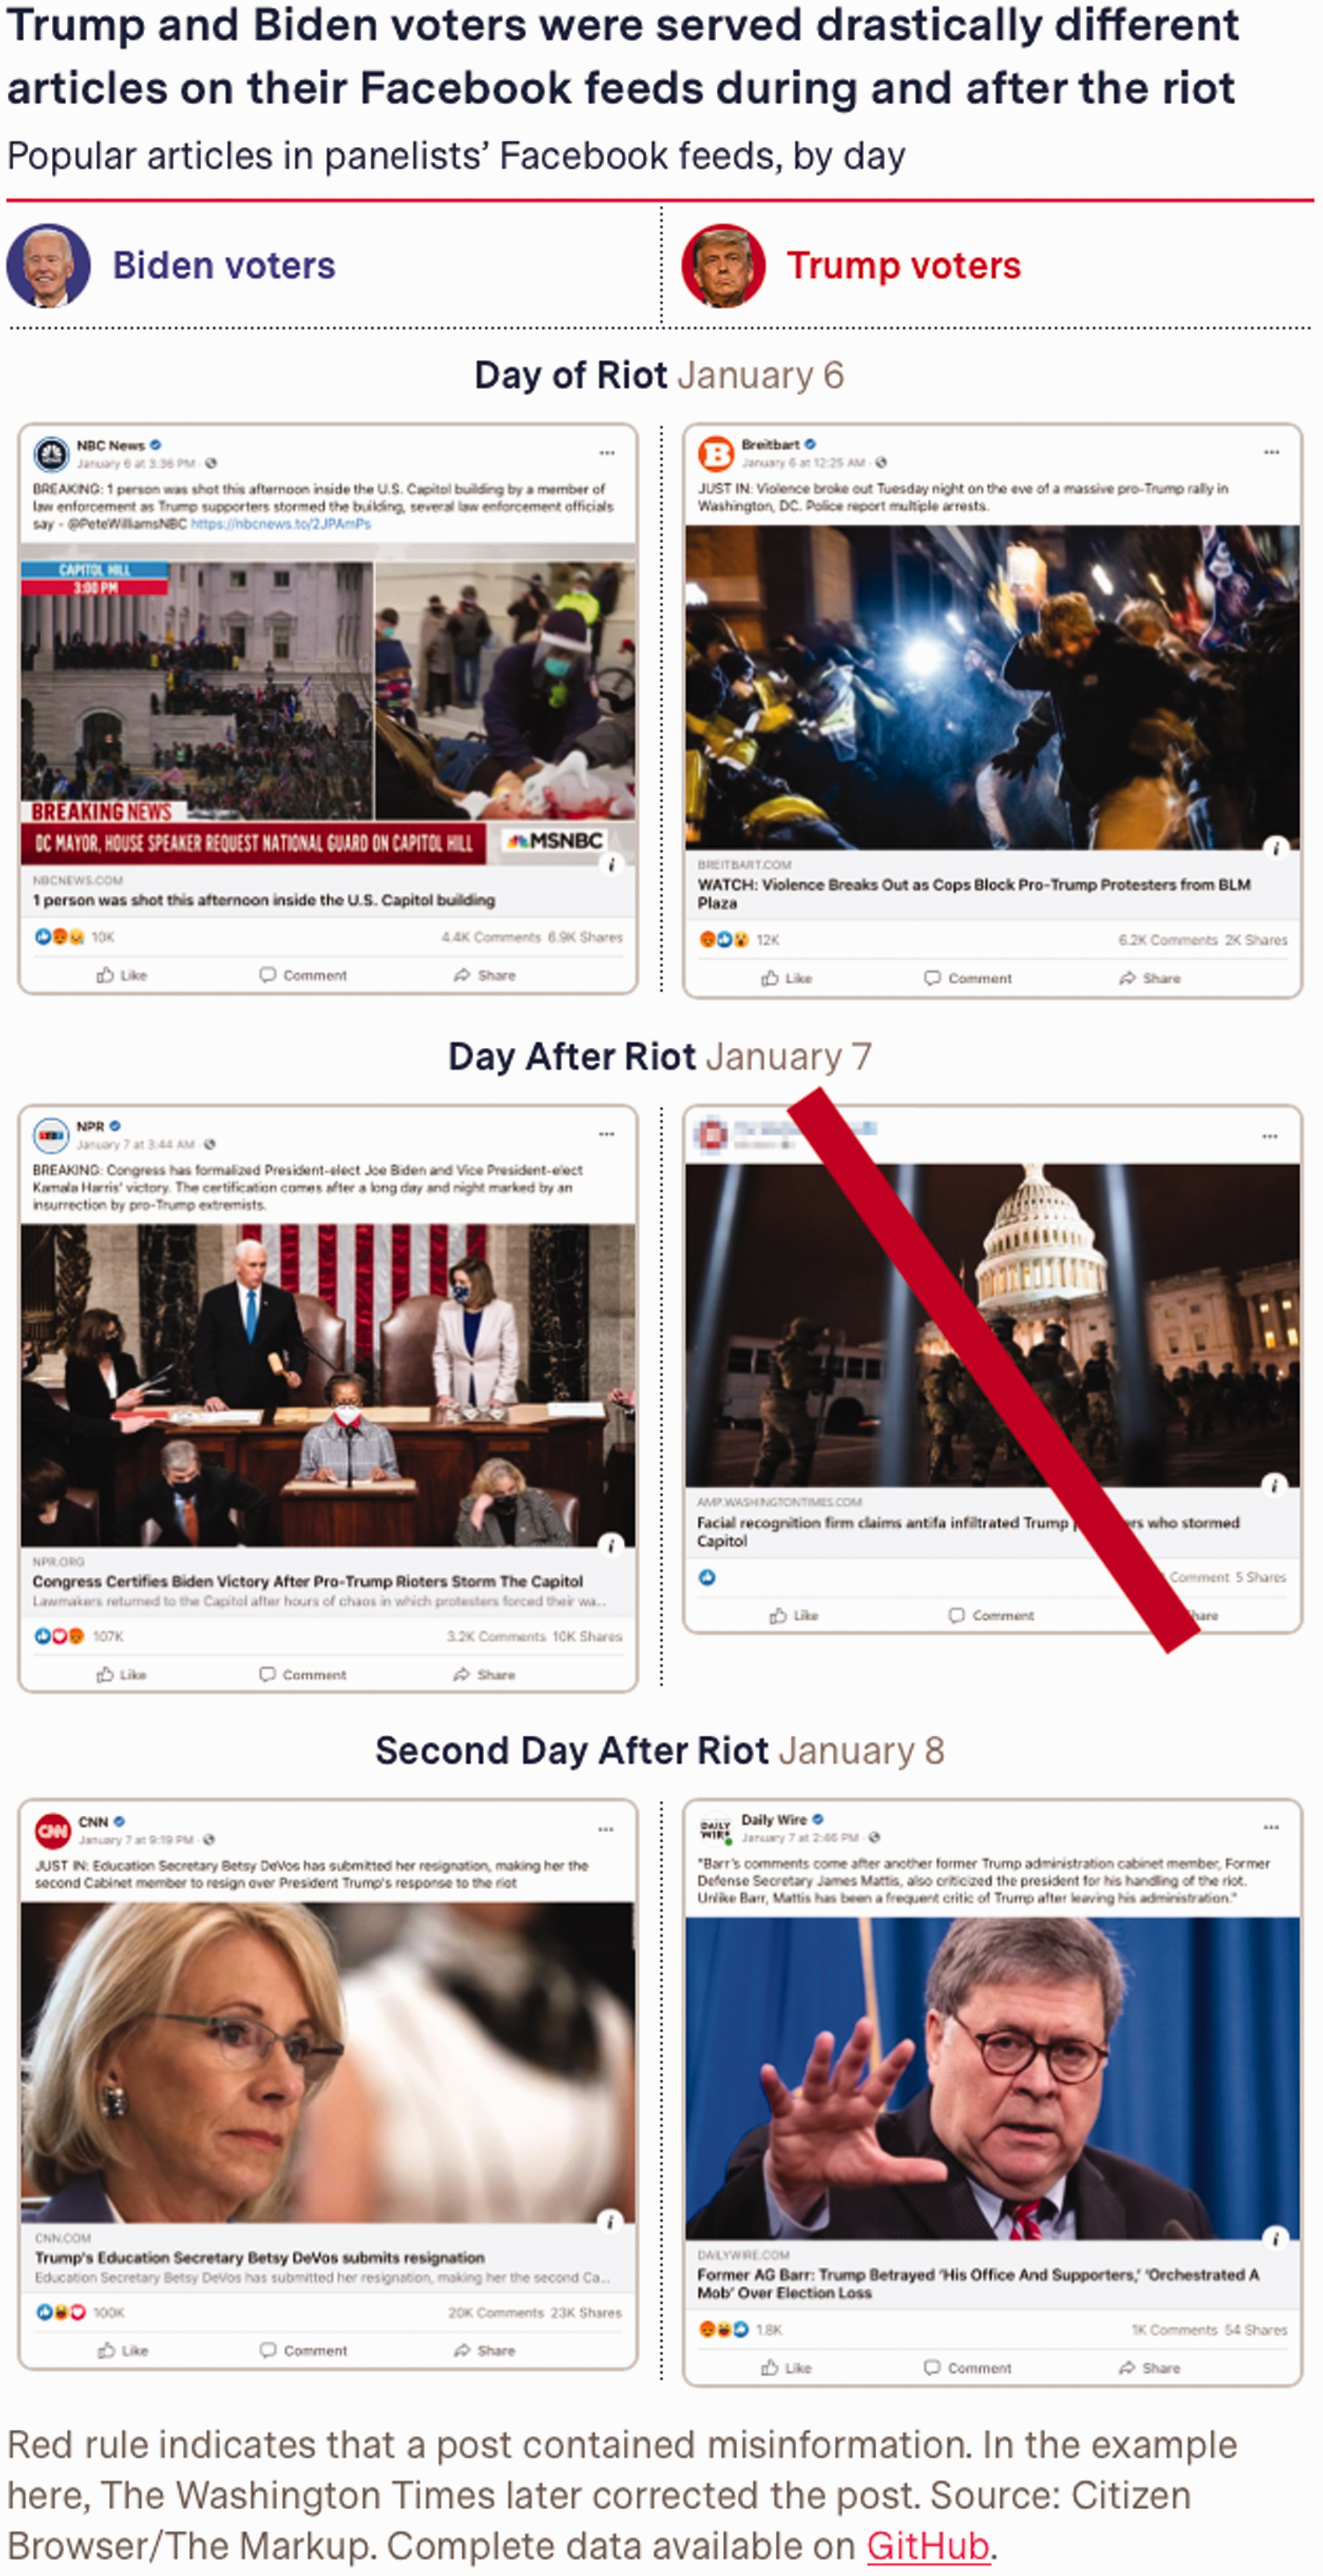
Feed competition. Side-by-side view of stories fed to feeds of liberal and conservative users of Facebook, showing competing accounts of events, January 2021. Source: Lecher and Keegan (2021).
Visual media analysis
Above I discussed image reuse, image trends and vernaculars, dominant image, image presence, image quality, image staining (or tarnishing), image circulation, image engagement, image associations, image removal and feed competition as approaches for visual media analysis. Having collections of images as inputs, these seek to output a kind of metapicture that retain and frame the images in a manner that invites critical reflection upon them. It enables close reading of images (through their retention) as well as more distant reading through their arrangement.
They also open lines of inquiry made implicit when the approach is combined with the metapicture technique. For example, do dominant images emerge when grouping sets of them that share the same issue hashtag? When does a new style appear in a set of chronologically arrayed covers of a magazine? When placed side by side, to what extent do sets of pictures or media feeds show agreement? These formulations would exemplify how the visual media analysis outlined above seeks to make the metapicturing active in the research.
The critical reflection of the images through their arrangement is born of digital research methods that curate or demarcate a set of them by making use of the affordances of the platforms (e.g. hashtags as substantive, grouping markers). While there are exceptions, such as adopting a user persona (in the case of the feed columns of progressive and conservative Facebook users) and extracting data from one platform to understand the workings of another (the YouTube deletion image walls made from URLs on 4chan), much of the demarcation work is undertaken through querying a platform, be it for hashtags or keywords (or both).
The queries of the platform result in sets that could be thought to organise substantive spaces. Subsequently, in the next step, those spaces’ content engagement is measured, whether taken from the interface (front-end or user mode) or through the API or other means by which a developer would access the data (back-end or developer mode). Comparison of the two is occasionally of interest, given that a user’s view (on Facebook, for example) could be considered less expansive than the API’s, especially if one is interested in (politicised) newsfeed critique. In sum, the visual media analysis is the study of engagement and ordering in demarcated online spaces.
Finally, in striving to display the results of the work, the notion of a metapicture is invoked as a technique that retains and frames the images under study so as to enable critical reflection of them. As related in the Introduction, it straddles the hermeneutic and the data-driven at once by de-datafying the images (in the sense that they remain images) as well as by arranging them as an analytical interpretation, such as the counter-meme as dominant image, stained engine results as tarnished or ‘news’ feeds as out of alignment or politically polarised.
Footnotes
Acknowledgements
The author would like to thank Gabriele Colombo, Sabine Niederer and the editors of Big Data & Society for their valuable comments..
Declaration of conflicting interests
The author(s) declared no potential conflicts of interest with respect to the research, authorship, and/or publication of this article.
Funding
The research is supported by SoBigData-PlusPlus, funded by the European Union's Horizon 2020 research and innovation programme under grant agreement no. 871042.
Supplemental material
Supplemental material for this article is available online.