
Abstract
This article proposes an analytical approach to algorithms that stresses operations of folding. The aim of this approach is to broaden the common analytical focus on algorithms as biased and opaque black boxes, and to instead highlight the many relations that algorithms are interwoven with. Our proposed approach thus highlights how algorithms fold heterogeneous things: data, methods and objects with multiple ethical and political effects. We exemplify the utility of our approach by proposing three specific operations of folding—proximation, universalisation and normalisation. The article develops these three operations through four empirical vignettes, drawn from different settings that deal with algorithms in relation to AIDS, Zika and stock markets. In proposing this analytical approach, we wish to highlight the many different attachments and relations that algorithms enfold. The approach thus aims to produce accounts that highlight how algorithms dynamically combine and reconfigure different social and material heterogeneities as well as the ethical, normative and political consequences of these reconfigurations.
This article is a part of special theme on Algorithmic Normativities. To see a full list of all articles in this special theme, please click here: https://journals.sagepub.com/page/bds/collections/algorithmic_normativities.
Introduction
Algorithms appear able to connect different data, methods and objects smoothly between different settings, from matters of social distinction to natural catastrophe and crime. 1 The widespread introduction of algorithms in society seems closely tied to this ability to connect things that were previously unrelated. The attraction of algorithms thus often hinges on their ability to bridge the particularities of one setting to reshape and perform things in new manners (Ruppert, 2013a). Yet, the connective and bridging capacity of algorithms is little analysed. Rather many analysts today tend to frame issues of power and injustice in terms of bias within algorithmic systems (cf. Eubanks, 2018; Noble, 2018; Steiner, 2012).
In this article, we therefore propose to pay attention to algorithmic processes of connecting, relating or folding. The purpose of this is twofold: First, we propose a mode of analysing algorithms which directs attention to operations of folding over assessing the biases and opacity of algorithms. Second, we demonstrate the usefulness of this approach in understanding how society and nature are ordered with algorithms rather than by algorithms. That is, algorithms are in society, they do not control society.
Importantly, in proposing this mode of analysis, we attempt to move away from a focus on the hidden biases in algorithms or data (Angwin et al. 2016; Introna and Wood, 2004; Kirkpatrick, 2016; Sandvig et al., 2016) as well as from a problematisation of algorithms in terms of opacity or accountability (Burrell, 2016; Diakopoulos, 2016; Zarsky, 2015). 2 We instead wish to highlight how algorithms relate and order a multitude of things—for example, different types of data, materials, methods, times, places or social relations—with sometimes unpredictable consequences. 3
To be more concrete, it has become commonplace in the literature on algorithms to argue that algorithms could sustain, automate and accelerate oppression (Noble, 2018) or injustice (Eubanks, 2018) as well as reproduce social norms and bias (Steiner, 2012). A well-known case has been the introduction of algorithmic templates into sentencing and parole over the last decades in the USA. The hope was that the growth of databases of crime patterns and the statistical evaluation of re-offending rates would lead to evidence-based sentencing. In this way, the introduction of algorithmic sentencing was supposed to avoid the risk of biases associated with individual judgements in traditional judicial processes. However, in 2016, ProPublica, a journalistic NGO, evaluated the risk scores generated by one such algorithmic system, widely used within the US criminal justice system (Angwin et al., 2016). The evaluation showed that the risk scores tended to violate formal non-discrimination legislation as the system perpetuated the social and racial stratification of the incidence of crime and of convictions (Kirkpatrick, 2016).
One line of reasoning in this critical research implies that if only algorithms were designed in the optimal and correct way, they would generate results that were objective and fair. It is precisely this rule-bound and routinised nature of algorithms that seems to promise unbiased and fair sentencing. We find this reasoning misleading as it hides the multitude of relations algorithms are part of and produce. In a sense, the very notion of biased algorithms is linked to an objectivist understanding of how knowledge is produced, and worryingly sidesteps decades of research on the practices of knowledge production. 4 In this article, we instead want to stress that algorithms cannot offer uniquely objective, fair and logical alternatives to the social structures of our worlds.
Instead, we argue that algorithms must be understood as sociotechnical systems (cf. Seaver, 2018). They link society, technology and nature in a mesh of relations. And it is through multiple operations of folding—of relating things—that they work: It is in the many practices of relating, constructing, tinkering and applying that algorithms gain their power to reshape things. But, importantly in this perspective, it is not always the algorithm that is doing the shaping or folding. Sometimes humans fold things into the algorithm, and sometimes algorithms fold things into something else. Hence, agency is not fixed with the algorithms or with the humans (cf. Callon and Law, 1995). Thus, we argue that paying attention to processes and operations of folding can be a key mode for researchers to grasp and account ‘for the distribution and fragmentation’ of agency in algorithmic practices (Ruppert, 2013b: 272).
Consequently, we suggest that an analytical approach focusing on folding—on relating things that were previously unconnected—is better able to account for the varied processes by which algorithms order society and nature. 5 We consider case studies of the social and cultural impact of specific, and sometimes biased, algorithms as important inroads to understanding their effects, but we also want to stress the urgency of producing conceptual tools that can be used to analyse what algorithms do across multiple local and specific applications. 6 Folding thus provides a means of addressing efforts to ‘dispel the algorithmic sublime’ (Ames, 2018) in algorithmic studies. With this we want to contribute to going from ‘myth to mess,’ as Ziewitz puts it, and allow for an engagement with the myriad of ways that algorithms both order and reorder the world (2015: 6).
Analysing algorithms as an operation of folding
As we have stated above, we believe that a focus on operations of folding is a fruitful way of sidestepping both debates about the fairness and the opacity of algorithms. Thus, instead of mobilising the sometimes misapprehended metaphor of the ‘black box’ to uncover hidden and opaque operations of power within inaccessible algorithms (Pasquale, 2015), we are interested in the ways in which algorithms are part of ordering the social, natural and normative (cf. Mol and Law, 1994).
In wielding the fold as an analytical tool, we take inspiration from Bruno Latour’s wide-ranging and diverse work on rhizomatic and relational ontologies, expressed through concepts such as folding, translation, rhizomes or networks (1999, 2002). Importantly for us, Latour has developed the notion of folding as a critique of essentialism that allows us to inquire into the mundane power of facts and artefacts. Drawing on Deleuze and Tarde, Latour has integrated the fold into his description of an ontology based in monadology. While for Deleuze the fold has become an important aspect of his work on difference and multiplicity, Latour uses the fold to describe associations and substitutions made by human and nonhuman actors that constitute the networks they operate within (Deleuze, 1993; Latour, 2010; Latour et al., 2012). 7
To mobilise a useful figure, we draw on Michel Serres’ and Bruno Latour’s (1995) dialogue about a crumpled handkerchief to think about folding. In their conversation, they develop the folds of the crumpled handkerchief into a critique of a traditional linear view of time. Extending this metaphor, we might think about relations as becoming folded or torn, like the handkerchief, to encourage thinking in alternative topologies (cf. Mol and Law, 1994). Rather than thinking about objects, relations and concepts as stable entities with fixed distances and properties, we might attend to how different topologies produce different nearnesses and rifts. In this way, technologies, such as algorithms, can be understood as folding time and space as much as social, political and economic relations (cf. Latour, 2002: 248–249). By analysing algorithms in this manner, we argue that we can gain a better understanding of how they become part of ordering the world: sometimes superimposing things that might seem distant and sometimes tearing apart things that might seem close.
To be more concrete, using operations of folding to understand algorithms allows us to pay attention to how diverse things such as values, computations, datasets or analytical methodologies are algorithmically brought together to produce different versions of the social and natural orders. For example, a mathematical formula for aftershock prediction might be folded into a system for predictive policing (Benbouzid, 2017) or health statistics from the USA in the 1960s might be folded into German health recommendations in the 2010s (Bauer and Amelang, 2016). 8 Different times, places, computational strategies and versions of the social becoming folded together through the operations of algorithms. 9
Analysing folding in four vignettes
To show the usefulness of paying attention to operations of folding, we analyse four empirical vignettes where algorithms help order society and nature. The vignettes reflect work done by the authors in diverse settings and go into different levels of empirical detail. In analysing these settings, we bring together some ways in which algorithms fold sets of data, modes of reasoning and objects and subjects. To set them apart from the general argument, the vignettes are placed in boxes, and interspersed with analytical commentaries that draw out our main argument. The vignettes are illustrative of some facets of the operations of folding, and each vignette highlights a particular theme. Importantly, these vignettes have been chosen to demonstrate how algorithmic operations of folding work in practice, from producing proximities and universals, to bringing these normative universals to bear on individuals.
Proximation: From proximities of social groups to proximities of transmission
Our first vignette deals with the history of mapping AIDS. The algorithmic generation of a novel ‘AIDS space,’ as designed by the geographer Peter Gould, draws attention to how algorithms can rearrange a geographic complexity into a non-geographical topography. Here we attend to how an algorithmic transformation of an AIDS visualisation can shift epidemiological attention from the populations that were deemed most at risk toward the regions that are most likely to be affected. It did so by replacing one normative framework of proximity with another. The picture of an epidemic tidal wave sweeping over the country was replaced with a map that instead reflected the spatial coordinates of behaviour and identities characteristic for AIDS. The traditional view was that homosexual men, heroin users, haemophiliacs and Haitians were the origin of the epidemic, but Gould’s AIDS space instead crafted a spatial representation which highlighted the specific patterns in which the epidemic worked, producing new proximities and distances to the AIDS epidemic.
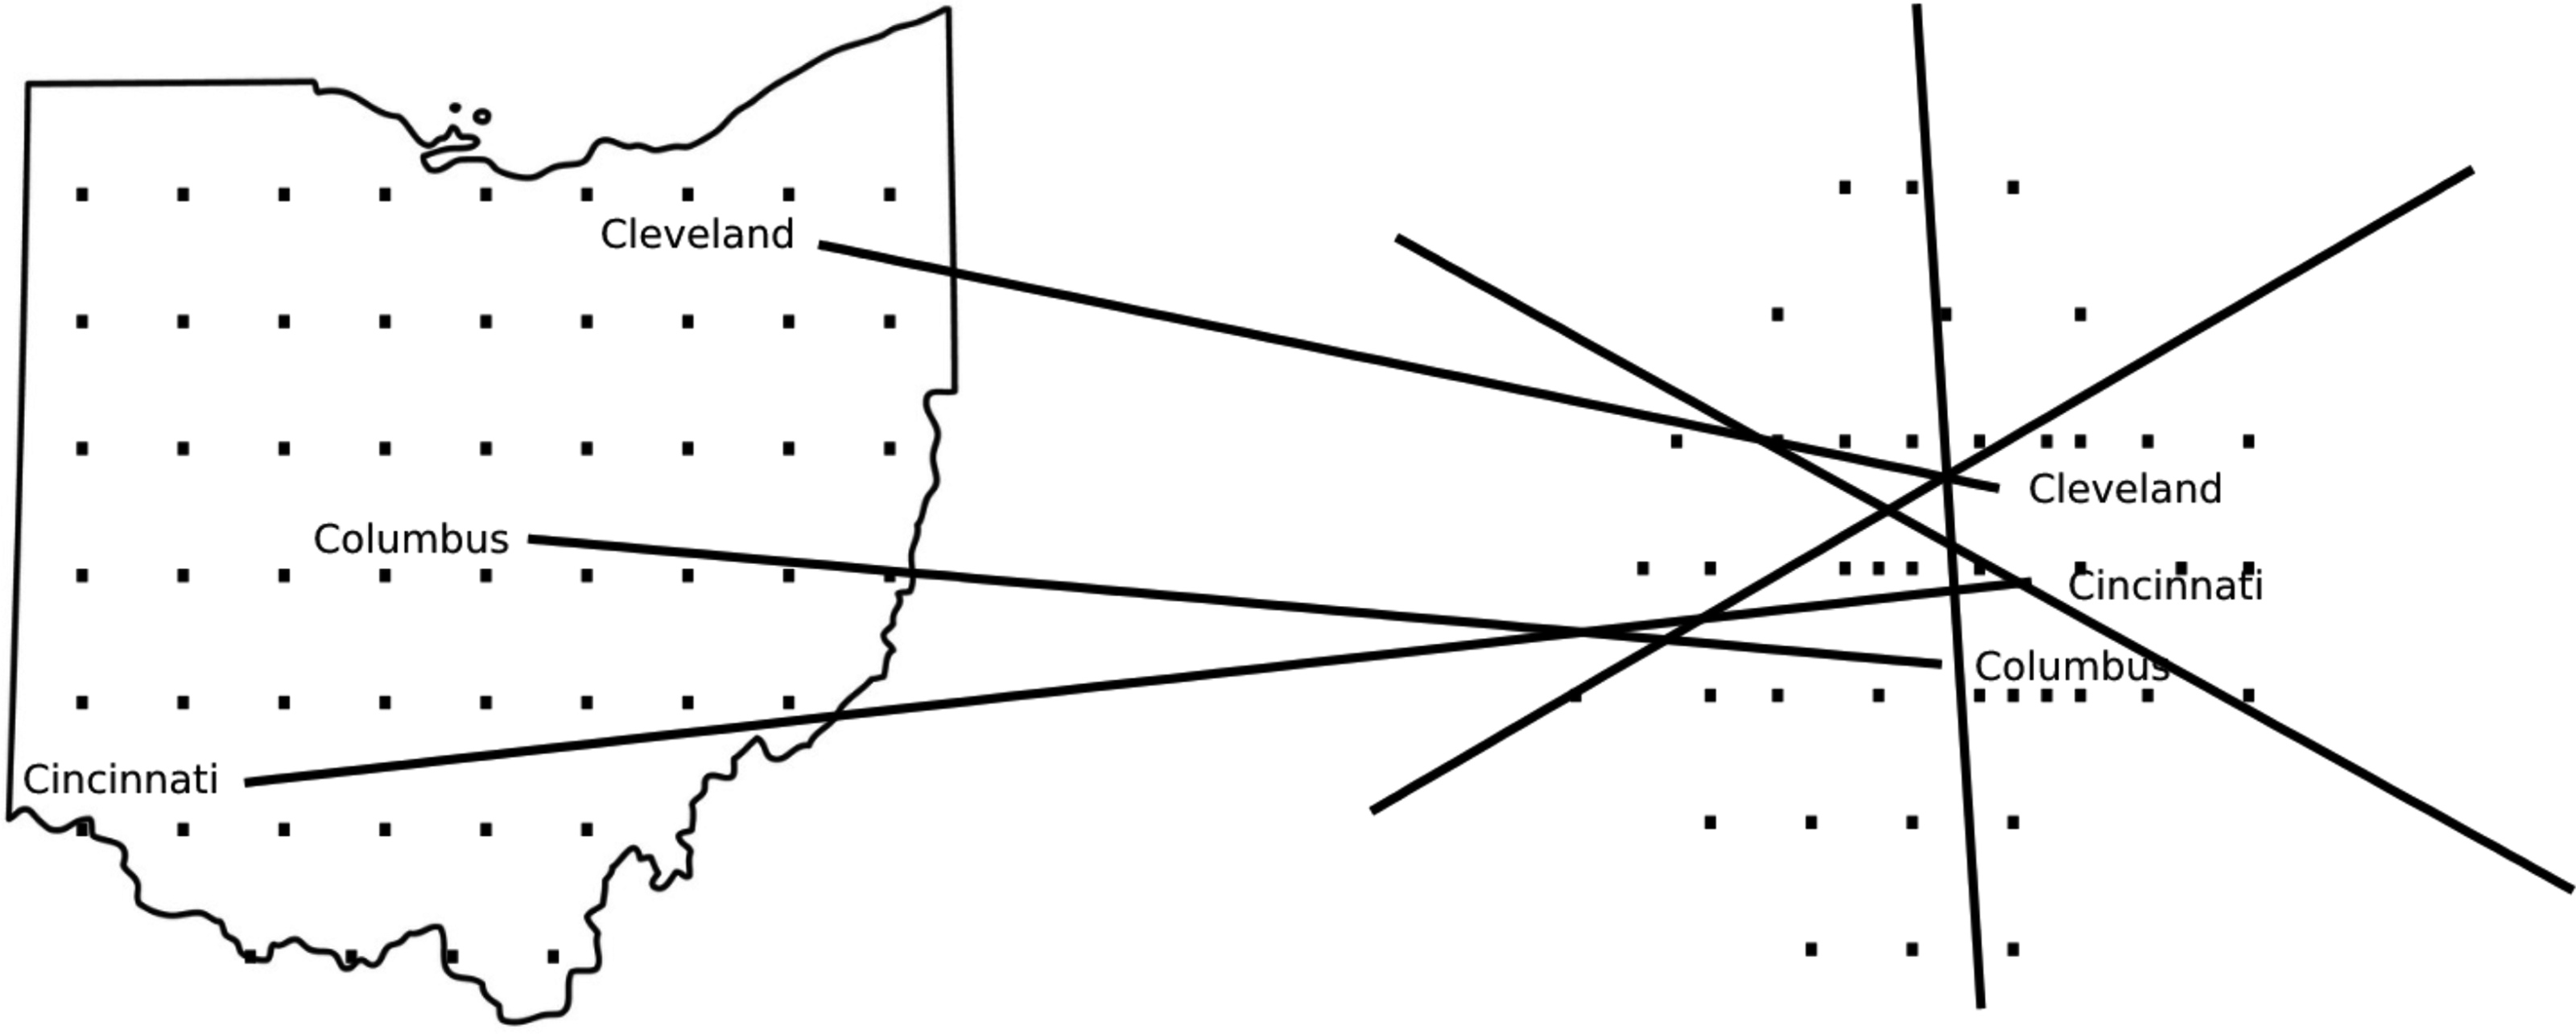
Drawn after diagram in Gould et al. ( 1991 : 86)
Vignette 1: Folding different versions of proximity/mapping the AIDS space In 1990, the geographer Gould expressed his discontent with how the AIDS epidemic was mapped across the United States (Gould et al., 1991). Gould was not satisfied with the image of AIDS conjured in the traditional sequence of maps. These maps usually showed the progress of the disease over time like a tidal wave washing over national geographies in a sequence of steps. These geographical and temporal visualisations, he argued, allowed for complacency regarding the spatial pattern he had observed, which was not comparable to a slow and homogenous spreading. To solve his problem, Gould developed a competing algorithm, which would capture the pathways and complicated spatial–temporal distribution of AIDS. He translated the geographic distribution and the inhabited landscape into a statistical representation of the rapid transmission of the emerging epidemic. As a result, the map was replaced by a diagram in which the spatial distribution had become a characteristic of the epidemic—as the epidemic now became visualised as a cluster centred around urban habitation. Gould designed his algorithm as a way to predict the next outbreak. He was convinced that sequential series of maps could only deliver a vague picture of threat which might shore up a sense of false security. Moving away from the evocative image of a tidal wave, Gould’s team aimed to integrate the highly specific social structure of the epidemic and its relationships to urban nodal points. His intent was to alarm teenagers, students and health practitioners who did not acknowledge their own proximity to the epidemic. A new set of proximities were forged through Gould’s topography. In contrast to the traditional tidal wave, Gould’s new algorithm laid out a model for rethinking the distribution of AIDS with respect to relative population density. The argument was that AIDS could be differentiated from a contagious disease like the plague, for which diffusion follows a gradual distribution over geographical space, reaching village after village as if it were a map of an extending flood. Gould’s maps instead showed how AIDS jumped from one large city to another, accompanied by slower diffusion to the surrounding countryside. This crafted a geographic projection, in which the disease was not plotted in relation to the space in which it moves, but rather space was rearranged along the characteristic dynamics of the epidemic. Gould plotted what he called an ‘AIDS space.’ By moving the urban centres out of their geographic position and grouping them together according to the probability of the next infection, he could visualise the proximity of the next AIDS event (Engelmann, 2018: 124; Gould et al., 1991; Koch, 2005: 272).
The ‘AIDS space’ provides insight into how algorithms can fold the world to create new proximities. Gould’s algorithm produced a new order of the epidemic built on its transmission patterns and associated risk behaviours, and plotted a map of AIDS as a new topological order, which was designed to enable an accurate prediction of the epidemic. The previous focus on the proximity of particular populations to the epidemic was thus replaced with a focus on the specific patterns of transmission and risk. Gould thus dissolved the geographical distance of the cities affected by AIDS. He used his algorithm to draw a map entirely different from the usual visual representations: his map transformed the geography of the USA into a new spatial distribution that was deemed more characteristic of AIDS.
Gould’s algorithm takes on a double function in this context. First, the algorithm re-assembles the transmission pathways characteristic for HIV and presents a formalised expression of the nature of AIDS. Its first impact was to replace a focus on particular risk groups with a focus grounded in the formalisation of the epidemic as a series of infections. Gould’s algorithm thus transformed sexual behaviours and practices into a new set of proximities. But second, the algorithm took these characteristic patterns of the epidemic and re-shaped them into a new spatial pattern, transforming its social topography of infection into a geography of transmission in which new proximities and new spaces of risk were made visible.
Gould’s AIDS space became a timely reminder that social and cultural framings of the epidemic had constrained the understandings of both the research community and the general public. It was intended to replace the traditional picture, which was attached to stereotypes, rumours and false epidemiological assumptions. Thinking AIDS through its unique spatial pattern was an invitation to unsee the proximity of homosexual men, heroin users, haemophiliacs and Haitians to the epidemic. Instead, Gould’s map evoked a picture of a new spatial order—a set of social proximities was replaced with a set of spatial proximities. Two versions of the AIDS epidemic were set against each other.
This brings us to our second operation of folding: the algorithmic production of universals through a heterogeneity of particulars. Here we attend to the folding of a global universal, from a multitude of elements, through an algorithm that was used to produce the ‘Current Zika State.’
Universalisation: From a multitude of particulars to a global neverwhere
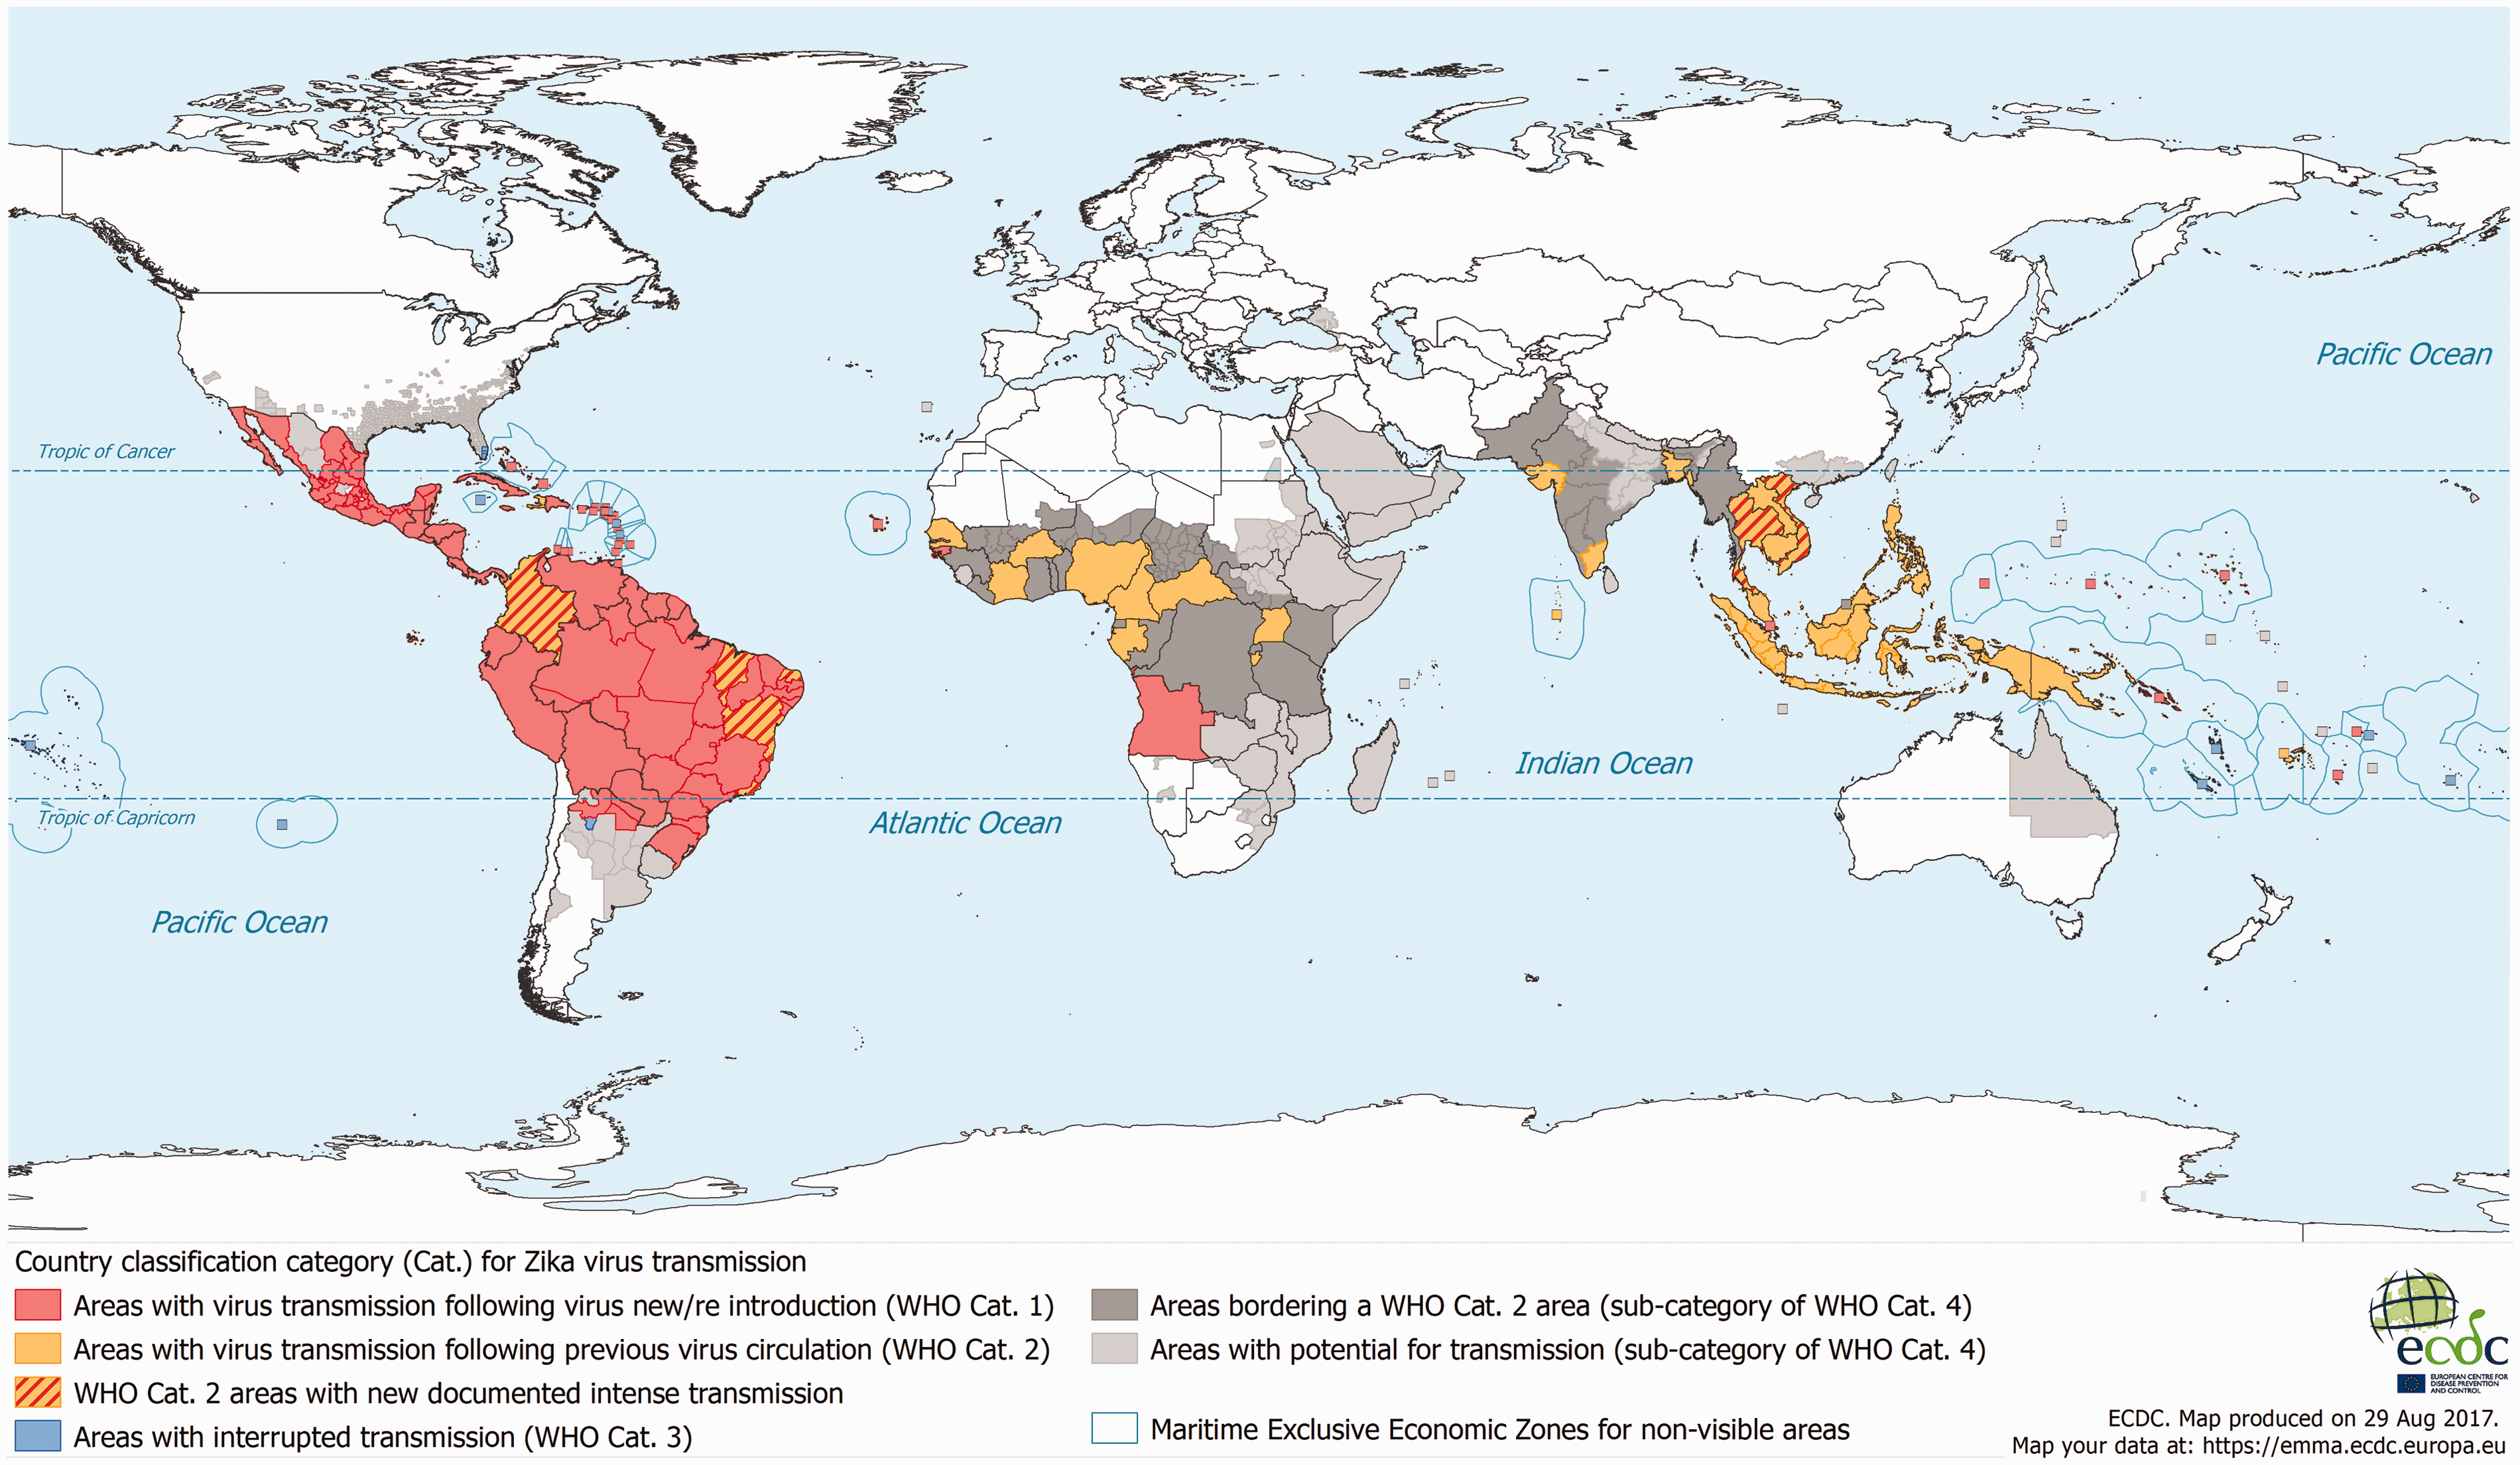
The algorithmic production of the ‘Current Zika State’ shows how algorithms transform a set of local particularities into an apparent global universal, which also performs certain places as proximate to the Zika epidemic. It demonstrates—through the construction of the ‘Current Zika State’—how a series of particular data, measurements, calculations and hypotheses are algorithmically assembled and merged to project a universal view of Zika. These operations give particular times and places the ability to stand for all times and places. Far from existing outside of or exterior to particularity, universals like those of the global Zika map, or the AIDS space described above, complexly combine, incorporate and interiorise particular data and calculations from different times and places. Here we deal with an operation of folding where a heterogeneous set of partial elements is brought together and transformed to produce a universal view. A new universality is created that appears to be self-evident—a natural fact of the world.
The Current Zika State 10
Vignette 2: A global neverwhere/producing the Current Zika State The goal of disease surveillance is to control the spread of disease. Algorithms, machine learning and databases promise to handle larger and larger sets of data—and more data promises more sensitivity to disease outbreaks. Zika is a recent addition to the global bestiary of pandemic threats, and quickly rose to fame before the Olympic games in Rio de Janeiro. Zika provoked a flurry of media attention. Media headlines such as ‘Zika Virus Makes Rio Olympics a Threat in Brazil and Abroad’ circulated the globe (Kassam, 2016). The fact that Zika is both sexually transmitted and transmitted by the Aedes aegypti mosquito triggered a scare that the disease would spread rapidly across continents. The aim of government disease surveillance organisations is to track, prevent, and curtail different epidemics in the world, including Zika. Surveilling any disease depends on a huge amount of work, and Zika is no different. Zika surveillance depends both on quantifying Zika cases around the world as well as other infrastructures for quantified risk prediction. One of the challenges is that many warmer and wetter countries do not have the resources to build and maintain infrastructures for tracking Zika and the feared Aedes aegypti mosquito. How do you then capture where there is Zika risk globally? To address these challenges, the European Centre for Disease Control and Prevention (ECDC) created an algorithm to track the Zika epidemic and to predict Zika risk across the globe. This algorithm drew together several different datasets, computational methodologies and infrastructures that tied the Zika epidemic to both the modelling of mosquitos and climate zones. For example, the ECDC algorithm utilised a risk modelling approach to predict the presence of the Aedes aegypti mosquito in a geographical area. This risk model harnessed data about where the Aedes aegypti had been found, taken from different infrastructures, times and places across the globe. For instance, the geographical range of the Aedes aegypti was calculated based on data from the US Centers for Disease Control and Prevention, but was also based on data about the mosquito published in scientific journals.
11
This risk model of Zika also folded historical climate data drawn from a multitude of weather satellites, and computations from several different climate models. In sum, the risk model aimed to predict whether a habitat could be suitable for the Aedes aegypti mosquito by combining data from many different times and places. However, the ECDC algorithm did not solely tie the Zika risk to computations pertaining to the A. aegypti mosquito. Zika risk was also inferred by modelling the risk of Dengue (which is also transmitted by the A. aegypti mosquito) as well as by using a so-called Köppen–Geiger climate classification of the world. All of these different models, datasets, classifications and computations were harnessed in the Zika algorithm to produce a snapshot of what was published as the ‘Current Zika State’ of the world. The point is that the ‘Current Zika State’ drew on a plethora of different times, places, computational efforts and infrastructures. To know the risk of Zika, algorithms connected past, present and future as well as a multitude of particularities of Zika.
The ECDC algorithm, just as the AIDS maps above, brings together a multitude of datasets to produce a universal and global view of a pandemic, where certain countries and people are more proximate to the Zika epidemic than others. However, what seems to be a map of disease encompassing the entire world is actually a chimera made up of very different data. This global and universalising map ignores absences in the data and the mosaicked qualities that come from the multitude of different data forms. The particularity and partiality of the data are removed from the global view. From the map itself, it is not clear how and why different data are combined, and for which areas. The map gives an account of Zika transmission, but it contains no traces of the work that was necessary to collect these data and combine them into a global view of Zika.
These heterogeneities represent a diversity of practices, locations and timescales, bringing a multitude into a universal coherence. In short, the Zika algorithm is an excellent example of universalisation: Through the algorithm’s different operations of folding things together, particulars are transformed into apparent universals. This is the apparent Janus-face of the algorithm: a complex and heterogeneous past, which can produce a smooth and universal present or future. A set of particularities becoming a smooth and coherent ‘view from nowhere’ (cf. Haraway, 1988)—an algorithmic neverwhere.
Normalisation: From enveloping to developing the normal
We now turn to the algorithmic production of ‘the normal’ by attending to the prediction of stock market risk. In finance, just as in many complex systems, regular activity is characterised by its unpredictability. It can therefore be exceedingly difficult to determine precisely what the normal state of the financial system is. Perhaps because of this unpredictability, algorithms have incredible justificatory power in debates over whether a particular economic pattern represents normal or abnormal variation of economic activity. There are currently numerous efforts to algorithmically detect aberrant patterns that diverge from ordinary background noise of ‘normal’ economic activity.
In recent years, debates over the normal state of financial markets have focused on how aberrations arise. Algorithmic models are routinely used to argue that financial crashes are normal to markets, on the one hand, and that they are abnormal and aberrant, on the other. Economists on each side put forth different algorithms and prioritise different styles of reasoning, from statistical judgement to the recognition of visual patterns. Different algorithms are thus built to identify deviations and abnormalities based on particular versions of normality. These versions of normality are expressed through mathematical functions such as, for instance, the normal or ‘Bell’ curve. Thus, in algorithms built to detect normality and abnormality, specific versions of the normal are translated into mathematical form and folded into the calculative logic of particular algorithms.

Figure: The normal curve and the power law curve. The x-axis indicates the magnitude of a particular change—for example, the extent of the rise or fall of a stock market in a given time period. The y-axis indicates the frequency of changes of that magnitude—for example, how often the market has risen or fallen that amount. Given the same set of parameters, a process modeled with the normal curve approaches the x-axis more quickly than the power law curve, indicating that there are fewer changes that are either extremely large or extremely small. 12
Vignette 3: Competing versions of the normal: Modelling stock market risk
Financial markets do not collapse every day, but they do collapse, and their crashes are unpredictable. Attempts to foresee crashes through algorithms depend in large part on different conceptions of what markets are and how they work. Today, two ways of understanding markets are common. First, there is the dominant view, which sees crashes as outliers: rare and unlucky events. Second, there are alternative perspectives, which see crashes as integral to contemporary capitalist markets: a likely, if unpredictable, occurrence.
The Black–Scholes–Merton model (BSM) is one of the most well-known examples of the dominant paradigm that sees markets as outliers (MacKenzie, 2006). Like many mainstream models, it relies on the normal or ‘Bell’ curve, which implies that small changes in markets are incredibly common and very large changes, i.e. crashes, are incredibly rare. Thus, the BSM model includes as one of its assumptions that major crashes are unlikely in contemporary financial systems. In contrast, alternative models like those of Benoit Mandelbrot (Mandelbrot, 1997; Mandelbrot and Hudson, 2004) avoid the normal curve, instead relying on graphs like the power law curve.
Unlike the normal curve, the power law curve includes the assumption that very large changes in the market occur far more often than traditional models, based on the normal curve, would suggest. As a result, models that use the power law curve include the assumption that crashes are in fact normal, in the sense of frequent, occurrences.
Both the dominant BSM models and Mandelbrot’s alternative models rely on algorithms, but the two types of model involve fundamentally different assumptions about what is normal. So the choice of which model to use necessarily involves a choice about which kind of normal—whether crashes are rare or common—one should assume.
Yet, algorithms alone cannot tell us which choice to make because the decision about what is normal is central to deciding which algorithm to use in the first place. Instead, the choice over assumptions about the normal is made using a variety of styles of reasoning including statistical knowledge, previous use of algorithms, professional familiarity with trading practices, systemic knowledge of financial regulation, discussions with peers, and so on. So contrary to the presumption that the use of algorithms would resolve what is normal, the algorithms make different conceptualisations of the normal even more complex.
Mandelbrot’s model was intended, in part, to settle debates over what is normal for financial markets. However, to date, far from resolving conflicts over the normal, Mandelbrot’s model simply adds another definition of the normal into the mix.
Thus, for stock market models, there is competition between the different normals and different algorithms. Practical assessments of markets, including the kinds of judgements about ‘how well’ the market is doing, rely on both BSM and Mandelbrot algorithms, which are each enfolded with different ideas about a normal market. The use of algorithms in finance thus involves transforming different versions of the normal, including statistical norms, social knowledge about the frequency of market crashes and visual assessments of the normal appearance of a graph, into the overall production of what is normal for finance.
This is not unique for stock market models. Most algorithms are folded with particular versions of the normal. For instance, ideas about normality were also folded into the Zika algorithm. While modelling the habitat of the Aedes aegypti mosquito, environmental data stemming from satellites were mathematically transformed into oscillating cyclical curves. The assumption built into the mosquito-model was that the normal behaviour of nature was cyclical in terms of, for instance, rainfall, temperature or vegetation index. However, this cyclical version of ‘normal nature’ does not fit well with non-cyclical changes in the environment—such as climate change, deforestation or processes of urbanisation. Likewise, in the case of Gould’s AIDS space, what was traditionally represented as an epidemic tidal wave was replaced by a new mathematical description of the normal transmission patterns of the AIDS epidemic. Different versions of normality were folded with the different algorithms.
This indicates that algorithms alone cannot settle debates about the state of the world. Rather than being the source of well-defined normalities, algorithms are constantly folded with different valuations and styles of reasoning in producing what is considered normal. Consequently, algorithms are used in struggles over what is normal, and are often used in ways that complicate, rather than resolve, debates over normality.
Bringing it all together: Proximations, universalisations and normalisations in the Recent Infection Testing Algorithm
This brings us to our last vignette, where we bring together our three operations of folding—proximations, universalisations and normalisations—in one setting. Here, we turn to a second algorithm related to AIDS, a Recent Infection Testing Algorithm (RITA). 13 RITA was first developed to estimate the incidence rates of HIV by calculating the ‘recency’ or major time-points of an infection process in a population. But to complicate the matter, RITA is also sometimes used to do epidemiological assessments for individual patient management. Thus, this algorithm is, among other things, used for bringing the aggregated population dynamics of the AIDS epidemic to bear on an individual patient’s disease.
However, the estimated time-points of infection have limited levels of reliability and robustness, and their applicability for individual cases is unclear, as the calculated time-points are merely a statistical approximation. The estimated time-points can be said to be a one-size-fits-all approximation of what a normal immune response to HIV is, based on a particular statistical population. To compound the issue, RITA does not incorporate individual case details, nor the myriad of potential exceptions to the existing norm, into the approximations. RITA thus assembles a system in which a statistical pattern produces a statistical view of the progression of a ‘normal AIDS infection.’ These computed statistical time-points are, as we show in the vignette, then sometimes brought to bear on individual patient assessments and plans for future treatment. A universalised population, and an algorithmic enactment of the progression of a normal AIDS infection, is thus brought proximate to individual patients.
Vignette 4: How a population algorithm became an algorithm for assessing individuals Algorithmic practices have become entangled with AIDS and HIV in a variety of ways. In the domain of HIV governance, an algorithm can both be understood as an entity that coordinates a testing process—often through visualisation and images—as well as an object that calculates and formats the results of different laboratory tests. RITA is an example of such a device. RITA was first designed for use in public health practices, specifically to calculate the incidence of HIV infections. The goal was to calculate the recency of infections in a tested population by statistically estimating the significant time-points or steps in the infection.
14
However, since its origin as a device for population measurement, RITA has also become a tool for estimating how recently an individual was infected with HIV. As a consequence of this shift from the population to the individual, RITA may, for instance, be used to verify the timing of infection that a patient accounts for. Furthermore, as it is a punishable offence in certain jurisdictions to not inform a sex partner of being HIV infected, RITA can also be used to validate the testimony of a patient when prosecuting transmission cases. In such cases, the algorithmically computed progression of a ‘normal infection’ is folded onto an individual case, with potentially grave consequences for the individual. In essence, the effect of RITA is that it transforms the temporality of HIV infection by staging some infections as ‘recent’ and others as ‘long standing.’ But recency is a complicated matter. The thresholds used to mark a recent infection may be statistically reliable on the population level, but might be diagnostically problematic on the individual level (Kassanjee et al., 2012). Immune system variation in patients, and other factors that are yet unknown, quite often produce RITA results that can be argued to be false using other techniques. This problem can be addressed through confidence intervals and modelling on the population level, but have far more severe implications when individual patients become accountable to them—such as when patients are prosecuted for transmitting the disease.
15
While RITA still plays an important role in the national and international surveillance of AIDS populations, it has thus also become used for prevention planning, identification of individuals for research and managing individual patients living with HIV (Murphy et al. 2017). In these ways, the statistically produced AIDS population is folded onto individual AIDS patients.
Yet, the population constructed with RITA includes assumptions that do not apply to all patients, and this creates problems when applying RITA to the individual level. For example, one might think low levels of HIV would indicate a recent infection. Contrary to this logic, it has been shown that some patients, who have been identified as infected, suppress HIV to nearly undetectable levels—without medical treatment. They have been labelled ‘elite controllers’ by practitioners in the field and do not fit into the progression of a ‘normal infection.’ These elite controllers demonstrate that the assumptions about what is a normal infection across all AIDS populations cannot be taken for granted. Different individual infections can progress according to individual rates that do not correspond to the statistical estimates. So applying RITA’s ‘normal rate of progression’ to an individual might actually mislead doctors.
The use of the RITA thus underscores the complex operations of folding through which algorithms can shape knowledge about and action on the world. Indeed, the RITA—just as the algorithms in our other vignettes—produces both universalisations and normalisations. It produces both a universalised AIDS population based on a plethora of data as well as a computed ‘normal AIDS infection.’ Hence, just as a financial algorithm produces a particular version of a normal market, RITA produces a particular version of a ‘normal AIDS infection.’ But the RITA also brings this ‘normal AIDS infection’ proximate to individual AIDS patients in that an individual’s disease progression can be measured against the normal infection. Thus, algorithms can become a point where ‘everything is tied together in one particular spot’ (Serres and Latour, 1995: 87)—particulars become universals, universals produce normals, and new proximities are made.
A new direction in algorithm studies? Thinking with operations of folding
As algorithms are increasingly used to bring together heterogeneous data, methods, objects and relations, they also help to produce new orderings of society and nature. We have argued that paying attention to operations of folding can be a key strategy for understanding how a diversity of objects are refashioned through algorithmic practices, and that this strategy might broaden and complement approaches that assess algorithms for fairness or bias or lament their opacity (pace Angwin et al., 2016; Kirkpatrick, 2016). That is, we argue that when ‘unbiased data’ and ‘fair algorithms’ become the focus, there is a risk that questions about situatedness, partiality, and the production of the ‘normal’ become invisible. But they remain crucial questions to pose, if we are to deal analytically with the increasing influence of algorithms in society.
In proposing this approach, we emphasise that folding is not an innocent operation, and that algorithms do not work through neutral operations that bring the world together in a detached manner. Rather any analysis of algorithms needs to acknowledge that they work through attachment and relation, not through detachment, biases or objectivity. Thus, drawing on Latour’s (2002) work, we argue that folding entails a translation not a transmission, in the sense that an algorithm does not fold things unaltered. To be clear, political relations and attachments can certainly come in the form of nefarious and hidden bias or calculations in the algorithm, but there are many other attachments and forms of politics that we need to heed in our analyses.
In attending to operations of folding above, our first analytical move was to zero in on how algorithms make proximate different objects and relations. We showed how an epidemiological model, which visualised an epidemic as a tidal wave, was replaced with a new topology that brought geography into focus rather than specific risk groups. What people, objects or relations are then produced as proximate or far away by algorithms?
Our second move was to analyse how universals are produced through the folding of partialities. By attending to the algorithmic construction of a global disease map, we zeroed in on how a multitude of heterogeneous objects—data, methods, objects and relations—were used to assemble a global and coherent map of disease. What partialities are then made to stand in for the whole? What is made part of the universal and what becomes invisible?
Our third analytic entailed attending to how algorithms are folded with different versions of the normal. In this we ask: How do assumptions about the normal become folded into algorithms? And how is the normal or abnormal then performed with algorithms?
So where do we go from here? Analysing operations of folding means remaining open to the different types of relations, politics and attachments that are made and unmade with algorithms. It means tracing operations of folding, regardless of what is folded and by whom. It means remaining agnostic as to what things can be folded with algorithms, and in what ways they can be folded. It means following algorithms through a diverse array of practices, both social and technical, sometimes in the same place, but sometimes through different settings, different logics, and different times and places. Rather than reifying algorithms as uniquely powerful and opaque black boxes, analysing operations of folding opens a different route, which highlights how algorithms can dynamically combine and reconfigure different social and material heterogeneities. We can then begin in earnest to investigate the relations, ethics and politics of algorithms.
Footnotes
Acknowledgements
We would like to express our gratitude to all participants of the workshops of The Algorithm Studies Network between 2015 and 2018, in which this perspective has been developed, reviewed and refined. We further would like to thank our editors, Matt Zook and Evelyn Ruppert, as well as our anonymous reviewers for detailed and productive feedback.
Declaration of conflicting interests
The author(s) declared no potential conflicts of interest with respect to the research, authorship, and/or publication of this article.
Funding
The author(s) disclosed receipt of the following financial support for the research, authorship, and/or publication of this article: We would like to thank Riksbankens jubileumsfond for their generous funding of the workshops and PhD summer school that made this article possible.