
Abstract
Mapping a public discourse with the tools of computational text analysis comes with many contingencies in the areas of corpus curation, data processing and analysis, and visualisation. However, the complexity of algorithmic assemblies and the beauty of resulting images give the impression of ‘objectivity’. Instead of concealing uncertainties and artefacts in order to tell a coherent and all-encompassing story, retaining the variety of alternative assemblies may actually strengthen the method. By utilising the mobility of digital devices, we could create mutable mobiles that allow access to our laboratories and enable challenging rearrangements and interpretations.
Keywords
Inspired by recent texts on quali-quantitative methods (Latour et al., 2012; Venturini and Latour, 2010), the research project recounted in this essay focussed on mapping public discourse around Big Data in science and politics. The aim was to test methods of computational text analysis on a comparatively large corpus of documents collected from US, UK and EU governmental websites as well as articles from Web of Science. The more I delved into the work, the more it became clear that it would not only be about describing the topics involved in the discourse, but also about the process itself, that is, the assemblage of algorithms. In what follows, I describe some of the contingencies involved in the process and argue that retaining them may actually strengthen the method.
In its core, the procedure of computational text analysis is very similar to the purification process described by Latour and Woolgar (1986) in Laboratory Life. Texts are transformed into bags-of-words (organic tissue is puréed), important words are filtered (the material passes selective sifts), and over the course of many iterations topics are inferred (spikes are differentiated from noise). Just as the construction of facts in science hides the circumstances of their production, it would be possible to hide the plethora of necessary decisions and present the resulting topics as facts. But maybe because there is not yet an established routine to computational text analysis, it is still possible to see all the possible paths one could take in arranging inscription devices. They are not yet blocked by what one ‘ought' to do or by hard coded presets within software.
The task of mapping a discourse with computational text analysis involves three interrelated areas of concern: (1) the curation of a corpus of documents, (2) actual data processing and analysis and (3) visualisation (see Figure 1). The difficulties associated with the first task are not really new, as they come with every kind of content analysis. Where are the boundaries of a discourse? In addition, it is unclear what requirements a corpus must meet so that the methods work properly (DiMaggio, 2015: 3). For example, the disproportion between the number of documents I had collected for science and for politics seems to have resulted in a model that is biased towards topics within science. The influences of a corpus' compositionality are easily overlooked when the amount of collected documents suggests that you have ‘seen it all' – a mistake quickly made with Big Data (boyd and Crawford, 2012; Harford, 2014). However, because a computer is, in contrast to humans, able to ‘unread' a text by deleting it from memory, computational text analysis may provide a platform on which the influence of a corpus' compositionality on the outcome can be tested (e.g. by drawing random samples).
Assemblage of tasks, algorithms, and resources employed in the project.
The ability of testing multiple pathways also applies to the second area of data processing and analysis. There are numerous algorithms involved in processing the text that can be combined in many different ways (e.g. transforming a PDF file into text, applying part-of-speech tags, detecting bigrams, named entity recognition, topic modelling). And each of them provides a source of uncertainty regarding how reliable they are and how different orders of assembly may influence the outcome. Take the question of employing bigram detection: Bigrams are pairs of words that co-occur frequently, such as ‘Big Data’. Treating bigrams as singular tokens (if the second word was a noun) increased the number of words in my dictionary by about 30 percent. This, in turn, changed word frequencies tremendously and thereby changed the outcomes of topic modelling algorithms. Furthermore, when we use external material, such as stop word lists or sentiment dictionaries, it is unclear whether they are universally applicable (Diesner, 2015). However, as the task of part-of-speech tagging illustrates, computational methods can be successively improved upon until they perform comparable to humans or even better (Manning, 2011). So, by seemingly reducing human interference, the promise of computational text analysis is an increase in ‘objectivity' compared to classical methods of content analysis. It utilises only the information contained in the corpus, providing a result that is essentially free from interpreter's biases, for example preconceptions about the documents (Buurma, 2015). The topics stem from a process of reading between texts that is impossible for humans to accomplish otherwise. The result is a multidimensional space of meanings, a space that somehow has to be reduced to a two-dimensional visualisation to make it accessible to interpretation.
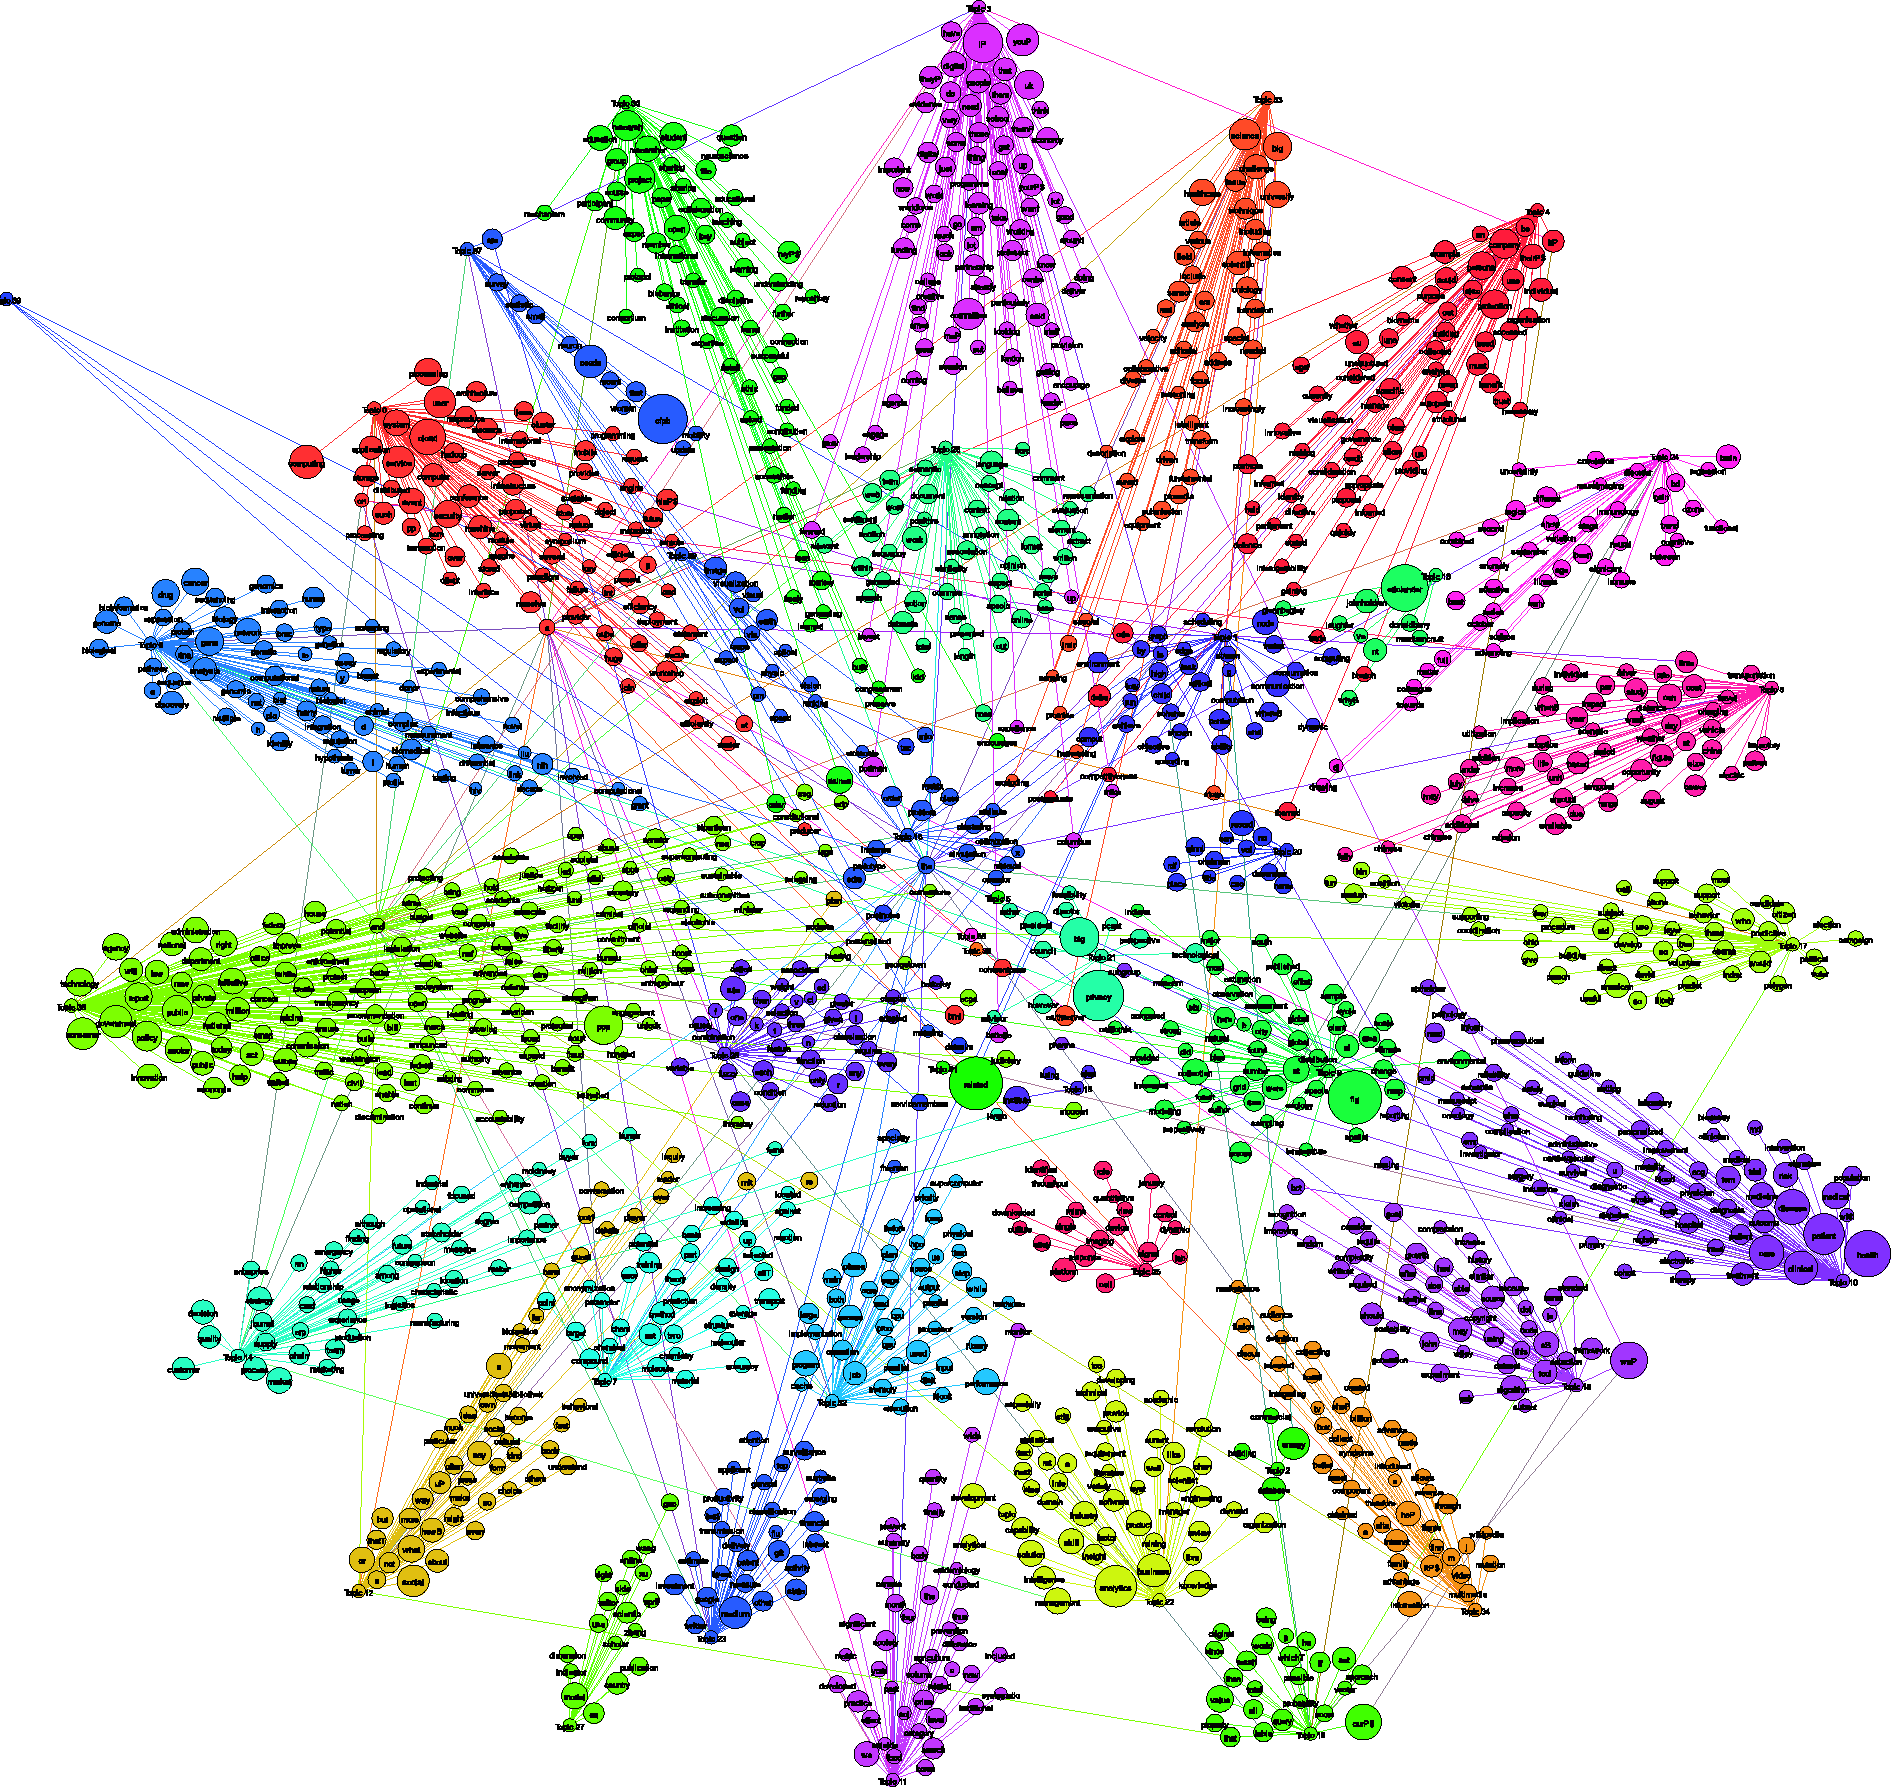
Finding an appropriate visualisation to the various computed results again came with a plethora of decisions on layout algorithms, cut-off points, and parameters. The number of possible graphs is virtually endless and none of them are necessarily ‘wrong'. Some yield similar results albeit on different levels of abstraction (e.g. healthcare vs. cancer treatment), some are distorted, and most are plainly not interpretable albeit not contradictory. Figures 2 and 3 show two different maps of my corpus based on the same set of words. They are the result of two different approaches to making an underlying topical structure visible: as is apparent from the isolated nodes in Figure 2, the first strategy was to set a cut-off point to edge weights in order to reduce the number of edges shown. While in Figure 2 the nodes' colours inform how the map is read, Figure 3 adds readability by including the topics themselves as nodes. In this case only maximum weights or those above a certain threshold are shown as edges. But is the map that is more easily read also more ‘true'? Even after being computationally filtered for words that are important to the context (by frequency or in comparison with other text corpora), topics remain groupings of words that have to be made sense of. After all, topic modelling only shifts the task of interpretation to the very end (Mützel, 2015: 2). Paradoxically, the visualisations seem to lend objectivity to the subjective fictions that topics necessarily are: While I was aware of the troubles I had to go through in drawing the maps, others found them compelling because of their complexity and beauty. Not to mention the visualisations of aggregated topic relations that mask all the uncertainties and artefacts within the results. Because visualisations also form a crucial interface with the data, mistranslations of numbers into colours, sizes and spatial distances may also mislead the researcher in his or her interpretations.
Word-word map for the top thousand nodes by tf*idf in the science and politics parts of the corpus. Node colours are the result of clustering using the Louvain method. Edges denote similarity across LSI dimensions. The layout employs a combination of multidimensional scaling and Fruchterman-Rheingold. All visualisation parameters (including a threshold for the similarity value) are chosen in order to produce a readable graph. Word-topic map for the top thousand nodes by tf*idf in the science and politics parts of the corpus. Node colours are the result of clustering using the Louvain method. Edges denote probabilities of topic membership according to LDA model. The layout employs Gephi's force atlas. All visualisation parameters (including a threshold for the probability value) are chosen in order to produce a readable graph.
Different readers read texts differently. Different algorithms do so, too. Computational text analysis is able to reduce human interference to the task of assembling algorithms which are much easier to check then the reliability of human coders. However, where classical forms of content analysis check themselves by comparing interpretations of different coders and thereby reach a common interpretation, computational text analysis potentially endows one single interpretation with the ‘objectivity' of a complex, mechanical process, hiding many of the decisions involved in its conception. Yet, it also has the potential to become more ‘objective’ a tool by retaining some of the multiplicity incorporated in the documents. In contrast to the laboratory studied by Latour and Woolgar (1986), this laboratory is digital. It would be possible to make use of the mobility of digital devices (Ruppert et al., 2013) and create mutable mobiles. Immutable mobiles, such as books and articles, allow for the unchanged dissemination of findings, which then can be compared against each other in order to produce new knowledge. But the contestation of facts ‘created’ by others used to necessitate the construction of another laboratory, causing an ‘arms race’ within science (Latour, 1986). Now, with the laboratory and its object being digital, it becomes possible to transport both, the corpus and all the used and unused algorithms, together with our stories in order to allow for reconfigurations. Being able to change parameters enables the viewer to get an idea of how the researcher's interpretation holds up across different variations of analytic assemblies. The researcher on the other hand has to argue why he or she had preferred a certain representation and interpretation over others. As much as Big Data changes the nature of the data used in social sciences from data being constructed by researchers to found data (Ruppert et al., 2013), it also provides an opportunity in reducing the role of a researcher's authority in vouching for his or her results. By producing amendable mutable mobiles we can produce ‘objective' results thanks to the multiplicity of our assemblages.
Footnotes
Acknowledgement
I thank Endre Dányi and Susanne Bauer for their valuable comments and support during the project.
Declaration of conflicting interest
The author(s) declared no potential conflicts of interest with respect to the research, authorship, and/or publication of this article.
Funding
The author(s) received no financial support for the research, authorship, and/or publication of this article.