
Abstract
Social media posts are full of potential for data mining and analysis. Recognizing this potential, platform providers increasingly restrict free access to such data. This shift provides new challenges for social scientists and other non-profit researchers who seek to analyze public posts with a purpose of better understanding human interaction and improving the human condition. This paper seeks to outline some of the recent changes in social media data analysis, with a focus on Twitter, specifically. Using Twitter data from a 24-hour period following The Sisters in Spirit Candlelight Vigil, sponsored by the Native Women’s Association of Canada, this article compares three free-use Twitter application programming interfaces for capturing tweets and enabling analysis. Although recent Twitter data restrictions limit free access to tweets, there are many dynamic options for social scientists to choose from in the capture and analysis of Twitter and other social media platform data. This paper calls for critical social media data analytics combined with traditional, qualitative methods to address the developing ‘data gold rush.’
Introduction
Social media have rendered the opinions and interactions among complex networks of individuals accessible and searchable. Such data is of interest to social scientists as well as government and corporate interests. Many researchers recognize a computational turn, some calling it a “data gold rush” (Kennedy et al., 2014). The phrase gold rush is associated with the growing commodification of data. David Berry recognizes this turn, seeing “growth of the computational world overlaying the physical world” (2014: 2). As platforms intensify commodification of data, access to such data becomes something reserved more for large corporations.
Others emphasize an “era of Big Data” (Kitchin and Lauriault, forthcoming). This phrase appears so often in mass media discourse in the past few years, it has become somewhat of a trendy colloquialism. Rob Kitchin describes Big Data with the following characteristics: huge in volume, high in velocity, diverse in variety, exhaustive in scope, fine-grained in resolution, relational in nature, and flexible in trait (2014: 68). Not all social media data analytics would meet this definition of Big Data. Nevertheless, debates in the field of Big Data studies are pertinent to data analytics in general.
Accessibility to voluntarily generated and often publically published content on social networking and social media sites provides a strong draw for social science researchers. “Today’s technology not only equips scholars with tools and methods to analyze Big Data, but also generates the Big Data itself by creating platforms over which ordinary people lead traceable social lives, and get transformed into behavior patterns: Their activities, connections, and products are collected, saved, and can be subjected to analysis” (Salah et al., 2013: 411).
Despite the appeal of such data for social scientists, many researchers interested in this field of study do not possess the background skill set equipping them to engage in such work. “SNS [social network sites] are studied so far either by social scientists, who lacked the necessary tools and expertise to conduct research on large-scale datasets, or by physicists who lacked the research goals of social scientists in exploring the SNS for inquiries about social phenomena” (Salah et al., 2013: 411). This claim is, perhaps, an over-generalization. Many social scientists approach social media data with great expertise. However, this topic is still quite young and ever-evolving, causing accessibility challenges for many who do not possess a computer science background. Despite these challenges, there are many tools available to researchers for the capture and analysis of social media.
This article sets out to argue that Big Data analysis tools have much to offer social scientists. It is laid out as follows:
Review of previous Twitter research; Acknowledgement of recent changes to API conditions; Meta-analysis of Big Data social media research by mass media and communication scholars; Positioning of critical data studies; Call for Big Data analysis by social scientists; Comparative case study of three free tools for social media data capture and analysis.
Much of the previous research conducted, particularly on Twitter, relied on research tools no longer available due to the platform’s increasingly restrictive application programming interface (API) policies. Through a meta-analysis of social media research in the field of communication studies, it is clear that many social scientists are not using data capture tools in their research of dominant social media platforms. This article does not call for data analytics replacing traditional qualitative research methods. Rather, it argues that data analytics should complement such methods. This article is informed by critical theory, particularly critical data studies. Despite new challenges in data access, it is vital that social scientists participate in data analytics as well as other, established methods to provide a reflexive stance on social media use. With this goal, this project concludes by reviewing three free tools currently available for researchers of social media. The case study reveals some of the ways social scientists may inform their research by complementing their analysis with the free tools currently available and under-utilized. Though the case study focuses on Twitter, each tool is either capable of similar research on other platforms or is grouped with other tools for the same purpose.
Previous Twitter research
Michael Zimmer and Nicholas Proferes (2014) conducted an exhaustive content analysis of Twitter research from 2006 to 2012. The topology they created is useful. However, Twitter’s new API restrictions in 2011 significantly altered academic research into the platform. Research is now more limited or relies on purchased data. What data analytic tools are researchers employing now that Twitter has become more restrictive? Are researchers focusing primarily on Twitter or are other platforms under scrutiny? To what extent do researchers compare data across platforms?
In the past, Twitter had a reputation as a data-accessible platform. “Twitter has become a popular medium for researchers in large part because the Twitter API makes it relatively easy to scrape, or download, massive numbers of tweets—literally hundreds of thousands of messages” (Lewis et al., 2013: 41). This, however, has changed in the past few years.
In 2011, Twitter altered its API structure, making free use of tweets far more restrictive and encouraging analysts to purchase data through a Twitter reseller such as Gnip. Previous allowances for developer and researcher APIs were phased out, and new limits of only one percent of daily Twitter traffic were imposed. Prior to this change, researchers could query Twitter’s ‘public timeline’ on an on-going, automated basis to create large data sets such as the one used to map out Twitter geography networks (Takhteyev et al., 2012). This data was generated in 2009 and showed that the strongest predictor of Twitter ties was proximity and frequency of flights between locations.
Before the 2011 tightening of Twitter’s API and data access policy, Twapperkeeper was “the preferred tool for capturing #hashtag or keyword tweets” (Bruns, 2012: 1332). For example, Christian Fuchs used TwapperKeeper to gather and analyze 985,667 tweets with the #wikileaks from 28 November 2010 to 1 January 2011 as well as 73,395 tweets on the Egyptian revolution, using #25jan from 25 January 2011 to 12 February 2011 (Fuchs, 2014: 192). Sahron Meraz and Zizi Papacharissi similarly used TwapperKeeper to collect 1.5 million multilingual tweets using #Egypt from 24 January 2011 to 24 February 2011 (2013: 145). An open-source tool titled YourTwapperKeeper developed after the increased API constraints and has been used by many researchers (Bruns, 2012; Bruns and Highfield, 2013; Bruns et al., 2013; Bruns and Stieglitz, 2012). However, this tool requires a certain measure of computer programming expertise to operate.
Bruns recognizes several challenges associated with tools that rely on Twitter’s API, noting that the API “acts as an unavoidable ‘black box’ between researcher and data source; this complicates the research process and prevents researchers from achieving total certainty about their results, but—short of gaining access to the data through other mechanisms—constitutes an inevitable fact of life” (2012: 1328). Many acknowledge limitations of research that relies on API-generated data sets due to the unknown logic of the algorithm used to produce them (Elmer, 2015: 120; Gaffney & Puschmann, 2014: 65; McKelvey, 2015: 138). It is not possible to fully replicate Twitter data sets using API tools. Therefore, independent verification of findings is not fully possible (Bruns and Stieglitz, 2012: 179). The inability to exactly reproduce data sets is due to the algorithm the API uses to select results in a query. Separate searches at different times and with different tools do not usually produce identical sets of data but similar results. While there are several reliability and verifiability challenges associated with data generated through a Twitter API tool, such methods endure as the most accessible free entry points to Twitter data.
As of 2012, Zimmer and Proferes note that 38% of Twitter research came from the field of computer science with information science (21%) and communications (14%) next. Nearly two-thirds of this research involved content analysis of tweets. Nearly two-thirds of the research utilized Twitter APIs to collect data. They note a decrease in the size of the typical Twitter data set following the 2011 change in Twitter’s API terms of service (p. 257). While social scientists should analyze multiple platforms, it is also time for broader analysis of Twitter data.
There are many reasons why Twitter is particularly appealing to social scientists and to data analysts. One reason research has frequently settled on Twitter has to do with scale. According to Twitter’s ‘About’ page, as of June 2015, the platform hosts half a billion tweets per day from their 316 million users, 77% of whom live outside the United States (Twitter.com). In addition to being one of the largest social media platforms (following Facebook and Weibo), Twitter is also valuable because of the type of information it generates. “Twitter has emerged as a valuable resource for tapping into the zeitgeist of the internet, its users, and often beyond” (Zimmer and Proferes, 2014: 250). Interest in Twitter often relates to a desire to capture the mundane global discourse of daily life. Murthy (2013) organizes Twitter research into the following categories: journalism, disasters, activism, and health.
Twitter has become a part of mass media news writing but with some key distinctions. “In contrast to the gatekeeping processes within mainstream media newsrooms, the selection of relevant content in social media spaces occurs after, not before, publication—and it is determined by distributed users, not centralized editors, through mechanisms such as the retweet on Twitter” (Lewis et al., 2013: 40). They see Twitter “as both newswire and newsroom” (p. 40). Journalists use Tweets as sources and as entry points for further investigation. Nevertheless, Twitter posters are not constrained by editors and market concerns in their posting. This creates an alternative voice accessible to researchers who are interested in contrasting dominant mass media frames with those produced through microblogging of the general public.
In addition to providing access to the public voice on large-scale issues, Twitter allows access to subordinated voices. “Twitter has its own mechanisms of supporting electronic elsewhere that give voice to marginalized groups and sustain feelings of connection” (Papacharissi, 2014: 68). “An electronic elsewhere is an environment accessible to many publics that do not share the same geographic location” (p. 68). Researchers might narrow in on marginalized voices establishing a virtual community through shared concerns via Twitter. Bruns and Burgess describe Twitter as “both a social networking site and an ambient information stream” (2012: 803). Analyzing this platform allows for both network analysis and access to global and local discourses.
“In contrast to social networking sites (SNS) such as Facebook, the reach of posts on Twitter is not necessarily limited to a specific group (such as subscribed ‘friends’ or ‘followers’); rather, posted messages are public by default and may also be found by visitors searching the site or tracking the Twitter stream” (Bruns and Stieglitz, 2012: 161). This makes Twitter feeds more accessible to researchers, due to the public nature of posts. It also allows for the previously mentioned dual analysis of content and network since the use of Twitter produces loose and evolving networks. “The specific affordances of different social networking sites are also reflected in the structure of the social networks which form around them” (Bruns, 2012: 1328).
Why are researchers focused on Twitter? It answers the social network questions, the global discourse questions, and the public sentiment questions. “If Twitter is a conduit for a global stream of consciousness, it logically follows that the medium is a barometer for revealing everything, from the occurrence of natural disasters to the public perception of political candidates” (Murthy, 2013: 51). Many have also followed Twitter’s influence and impact on large-scale events. Examining a million tweets during the Egyptian revolution, Meraz and Papacharissi “spotlight Twitter’s socio-technical flexibility in altering and spreading influence while supporting the networked efforts of grassroots political activism” (2013: 139). Such analysis of Twitter data should utilize digital methods (Rogers, 2013) acknowledging how platform affordances impact the development of networks. “Networked publics are typically called into being on Twitter through the use of text, hashtags, and addressivity markers, which shape the flow of the stream produced” (p. 140). Such analysis is particularly well-suited to social scientists. Burgess and Bruns note that the “comparative openness of Twitter” as compared to other social media platforms, has created an “unprecedented wealth of social media data and stimulated rapid and significant innovation in computational tools to gather, analyze, and visualize this data in the digital humanities and social sciences” (2015: 94).
Changing API conditions
As Twitter became a public corporation in 2013, what was once considered a wide-open platform began taking steps to secure its data flow. Some note a shift from an “open internet” to “a more ‘closed’ model with fewer, more powerful corporate players;” this closing off is marked by, among other changes, the more restrictive Twitter API (Puschman and Burgess, 2014: 45).
As many researchers note, it is possible, though expensive, to gain full access to the complete Twitter data stream (Borra and Rieder, 2014; Bruns, 2013; Bruns and Burgess, 2012). Companies such as Gnip and Datasift once allowed researchers to purchase Twitter data sets. However, that is now only possible through the Gnip, now that it is a Twitter-owned company. Twitter has also donated its full data set to the US Library of Congress (Burgess & Bruns, 2015: 108). This allows a future potential for researchers to write proposals for access to this data. However, this source is not yet available and will likely only be available to limited groups. Given the currently expensive and limited access to the full Twitter data stream, individual and small research groups without substantial funding usually turn to tools that utilize Twitter’s API capabilities, often relying on API tools created by the researchers specifically for the purposes of their study. It is not necessary, however, to create a new API tool for each research project.
Meta-analysis
In order to conduct a meta-analysis of communication research on data analysis of social media, the first research step was to conduct a query of the EBSCO hosted database “Communication and Mass Media Complete,” which contains over 200 titles. The first limiting search criteria sought titles that contained the terms “Facebook” or “Twitter” or “social media.” Additional search criteria sought “Big Data” as a subject term and “analytics” in the full text. This search was limited to peer-reviewed titles written in English and providing full-text. The query resulted in 294 articles.
The meta-analysis of data-based communication research on social media finds that few scholars utilize Big Data capture and analysis tools. Figure 1 shows results from the meta-analysis. Once duplications in the query of Communication and Mass Media Complete were eliminated, the pool contained 285 complete articles. Thirty-six of these results discussed the topic of social media without specifically analyzing a data set. This leaves 249 articles sharing research into social media platforms, 83% of which utilized more traditional communication studies methods for examining social media data. For example, one-third of the studies used a survey, most often an online survey. This may have been combined with other methodologies but was the most common form of data collection.
Bar chart demonstrating that few of the articles in the meta-analysis used a tool, such as a platform API, to collect and analyze social media data. Even fewer researchers used a combination of traditional research methods and data capture and analysis tools. Bar chart demonstrating which platforms each article researched.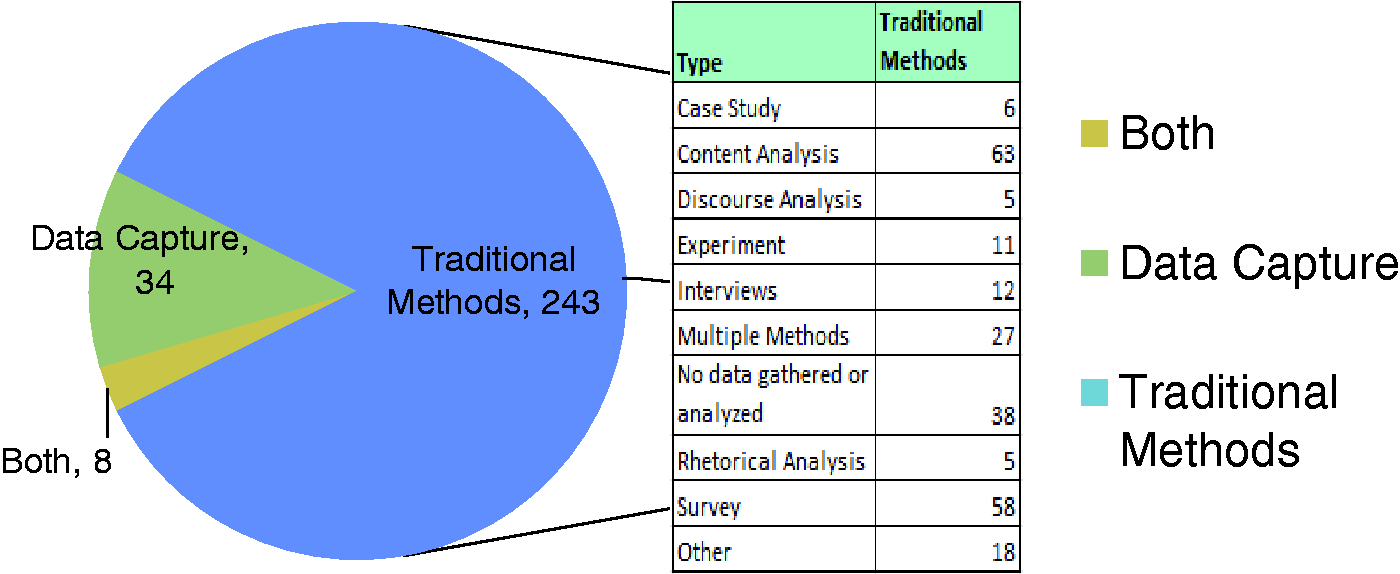

Although Zimmer and Proferes (2014) found nearly two-thirds of Twitter research in all fields of study were conducted using content analysis, this meta-analysis of communication studies research into social media shows slightly less than one-third of data-driven research utilized content analysis. However, methods identified as textual analysis, rhetorical analysis, and discourse analysis were not categorized together with content analysis in this study. If one were to consider any form of tweet-specific reading a content analysis, then the numbers would certainly be higher.
One potential explanation for the dominance of traditional research methodologies over data analytics is the focus on Facebook as a platform; 69% of the research examined Facebook; 46% examined Twitter; and only 10% examined more than one platform in the research. Figure 2 shows the results according to platform researched. While the Twitter API has recently become more restrictive, the Facebook API is far more limiting, allowing queries to public groups but not personal profiles. Of the 17% of research which captures, purchases, or locates social media data sets, nearly all examine Twitter exclusively, with purchased sets more likely to examine Facebook as well. Eighty-four percent of the research using such data utilized a free capture tool rather than purchasing data sets. Most of this research does not identify the name of the tool but acknowledges that it relies on the Twitter API. Of the named API tools, YourTwapperKeeper and NodeXL are most common.
These results demonstrate that most social media research in the field of communication studies does not use data analytics, despite what some call the computational turn. When such researchers do use data analytics to capture and analyze social media, Twitter is the most frequent platform of analysis, and free API tools are most commonly employed. The more common form of social media research focuses on Facebook as a platform and uses methods such as surveys and content analysis.
Critical data studies
Kitchin and Lauriault (forthcoming) assert that the term ‘data’ entered the English language along-side growing emphasis on science and statistics during the 17th century. This developing use of the word connoted “pre-analytical and pre-factual” uses of the term as data was seen as “the raw material from which information and knowledge are built” (2014). However, they challenge this characterization of neutral data. Citing several others (Bowker, 2005; Gitelman and Jackson, 2013), they claim that “raw data is an oxymoron;” “data are always already ‘cooked’. Data are then situated, contingent, relational, and framed, and used contextually to try and achieve certain aims and goals” (2014). In response to this view of data, Kitchin and Lauriault call for critical data studies applying critical social theory to data. Dalton and Thatcher (2014) lay out seven points for a critical approach to ‘Big Data.’ This includes the following considerations, as rephrased by Kitchin and Lauriault (forthcoming):
Situate ‘Big Data’ in time and space. Expose data as inherently political and whose interests they serve. Unpack the complex, non-deterministic relationship between data and society. Illustrate the ways in which data is never raw. Expose the fallacies that data can speak for themselves and that Big Data will replace small data. Explore how new data regimes can be used in socially progressive ways. Examine how academia engages with new data regimes and the opportunities of such engagement.
They acknowledge that analysts often use data to improve society such as through humanitarian and environmental efforts. However, they recognize what they term the “darker side to much data work” such as through “dataveillance and the erosion of privacy; profiling and social sorting; anticipatory governance; and secondary uses and control creep” (2014). They call for a combination of data analytics with qualitative approaches such as “ethnographies, interviews, focus groups” and “participant observation” adopting a critical stance “to deconstruct the discursive regime accompanying data-driven initiatives” (2014). Dalton and Thatcher agree that “‘Big Data’ research can be similarly improved by working with, rather than denying the importance of, ‘small data’ and other existing approaches to research” (2014). They note that the term ‘Big Data’ will likely recede from public attention as it becomes banal. Therefore, they call on engagement in “the hard work of theory” to “question and challenge its role in an emerging hegemonic order of societal calculation” (2014).
For Kitchin (2014), this critical analysis extends to the algorithms underlying media platforms as well. “Algorithms do not just process data, they produce, affirm and certify knowledge through a particular logic built on specific assumptions” (quoting Gillespie, 2014 in Kitchin, 2014). Algorithms “can never be understood as simply a technical, objective, impartial form of knowledge or mode of operation” (Kitchin, 2014). McKelvey (2014) agrees with the need to examine algorithms and calls for democratic methods of internet inquiry toward this project. Berry also sees “danger in lack of critical reflexivity in algorithms” and notes that “we have to be careful not to reify computation and lose its ‘processual’ aspect (2014: 10–11). It is not enough to simply examine social media posts as a ‘raw’ artifact, separated from the systems that produced them. Researchers must consider the processes that create a moment as well as the networks involved in the situation. This must extend to the algorithms utilized to present the data.
Meraz and Papacharissi (2013) discuss networked gatekeeping and agenda setting. They note that social network science theory demonstrates power laws in social media use; the rich get richer. “A few users are able to capture an inordinate amount of attention in open, growing web systems as a result of age (entering the network earlier) and preferential attachment (receiving greater connections from incoming nodes due to celebrity)” (p. 142). “Mainstream media are prominent in the retweet category while celebrities tend to be more prominent in the mention indicator” (p. 142, citing Cha et al., 2010). A critical stance opens up the politics of such phenomena. “Theoretical extensions to gatekeeping must thus locate prominent, elite actors and take account of who they are and how they affect the flow of socially contagious information within networked environments” (p. 142). One way to expose such politics is through a network analysis of social media discourse.
Social scientists are uniquely positioned to pose such critical questions. Berry notes that it is no longer possible to separate computers and communications (2014: 16; see Oettinger and Legates, 1977). Given this premise, to what extent are communication scholars engaging in data analytics? If critical analysis of communication through social media should examine platforms, mechanisms of control, algorithms, and mechanisms of networked gatekeeping, what tools are researchers utilizing to address these issues?
Discussion of why social scientists should utilize data analytics
David Berry claims that “critical theory can contribute to the praxis” of exploring “the dangers and the possibilities offered by digital technologies towards the project of human emancipation” (2014: 13). Social scientists have an interest in how people communicate. While more qualitative research methodologies are a vital means for answering important questions about that process, data analytics can also reveal important findings. Savage and Burrows argue that data analytics should not be left to just “in-house scientists and marketers” (2007: 896). Large data corporations such as Google and Facebook retain “the best access to data, as well as the best tools and methods to make sense of it” (Williamson, 2014, from Kennedy et al., 2014: 2). “Corporations are dominating the field of digital data analytics” (Kennedy et al., 2014: 3; see also Driscoll & Walker, 2014: 1761). Kennedy et al. recognize that this corporate domination creates a digital divide not based on access to computers or the Internet but based on data availability. They seek to circumvent “the threat of a new digital divide based on differential levels of data access” (Kennedy et al., 2014: 2; see also Redden, 2015: 27).
The call for Big Data research in a computational era impacts social scientists interested in social media. “Additionally, online social networks appear to exert a special fascination for researchers because they are, for the most part, already rich in readily accessible and apparently objective data: it is considerably easier for the researcher to establish who said what to whom, and under what circumstances, in a large and lengthy public discussion on Twitter than it is to generate a comparably comprehensive and accurate data set for a similar offline interaction” (Bruns, 2012: 1328). This statement is coupled with the caveat warning against broad generalizations based on such data. Researchers must understand the limitations of information provided through data analytics as well as the algorithms and processes involved in capturing such information.
While some researchers hope to breech or prevent a Big Data digital divide between academics and large corporations, others are critical of ‘Big Data’, questioning the ethics of such research and whether controlled access to large data sets will lead to ‘data haves’ and ‘data have-nots’ among other concerns (boyd and Crawford, 2012). Analytical potential from social media has broad appeal, yet this newly valued commodity is primarily inaccessible to the creators of it. “While the data in social media platforms is sought after by companies, governments, and scientists, the users who produce it have the least degree of control over ‘their’ data” (Puschman and Burgess, 2014: 44). There are significant barriers preventing platform users from full understanding of how their information is used.
“Only corporate and government actors—who possess both the intellectual and financial resources to succeed in this race—can afford to participate”… “the emerging data market will be shaped according to their interests. End users (both private individuals and non-profit institutions) are without a place in it, except in the role of passive producers of data” (Puschman and Burgess, 2014: 52). In a capitalist model, users of social media platforms and non-profit researchers offer value only in the production of data, not in the analysis of it. Non-profit researchers must find their access points to social media data analytics. The insights provided by analysts without an economic aim have great potential to inform and improve use of these platforms as well as analyze the social and societal implications of social media practices.
Despite the availability of free social media research tools, many non-profit researchers struggle to make use of what is available. In an effort to encourage public use of social media data analytics, Kennedy et al. (2104) sought to partner with community organizations to utilize Big Data analysis tools. This tool set included NodeXL, Gephi, DMI IssueCrawler, and, ultimately, commercial tools. The group turned to commercial tools because their community partners found the free tools too complex to navigate. Even when the tools are free, the expertise needed to analyze the data and enact the tools often prevents the general public from utilizing them broadly. Nevertheless, as research takes a computational turn and the era of Big Data creates a culture of corporate elites who have access to and skills necessary to utilize data analytics, it is vital that social scientists also develop skill sets and learn how to access available tools.
Methodology
In order to show what different tools have to offer social sciences, this article uses a comparative case study. The case study comparing Twitter data analytics tools focused on the “Sisters in Spirit March” on 4 October 2015. In order to highlight some of the differences between these tools, each was utilized to capture Tweets in a 24-hour time period. As part of an on-going campaign calling for a national inquiry to the disproportionate number of murdered and missing Indigenous women, each 4 October is marked by candlelight vigils to remember the lost in cities across Canada. The Sisters in Spirit Candlelight Vigil is sponsored by the Native Women’s Association of Canada. The largest of these marches, during this data set, occurred in Calgary, Alberta. For the past five years, this date has been combined with the REDress project. Jaimie Black began this effort to hang empty red dresses throughout Canada as a visual reminder of the missing women (Greenslade, 4 October 2015). The following research reflects Twitter data containing #MMIW (Murdered and Missing Indigenous Women) or #SistersInSpirit captured by each of the mentioned tools during the day after these events (5 October 2015). Social scientists infrequently publish the name of the API tool they used to capture data. Others maintain lists of API tools, such as Wasim Ahmed’s blog explicating Twitter research tools (2015). The following three tools are three options among many.
The first query used Storify.com to search for #SistersInSpirit on 13 October. Storify is not, specifically, a platform designed for research. It is widely used to curate selected social media posts which can then be embedded in media pages and commercial websites. However, it can be repurposed for research. The intended data set was for posts on 5 October, which is beyond the commonly accepted one-week limit of the Twitter search API (Borra and Rieder, 2014). However, Storify was able to reach more than one week back and collect 54 Tweets from that time period. A follow-up search conducted on 31 October produced only five tweets from the fifth. Though a Storify query found tweets more than three weeks old, the number produced was drastically reduced for the same search. Once captured, these tweets, as well as many extending from 4 October to 13 October, were saved and published through the Storify website.
Using Netlytic.org, the second query searched Twitter for #MMIW, which stands for ‘murdered and missing indigenous women.’ A Tier I Netlytic search pulls up to 1000 tweets each 15 minutes for 24 hours. This search ran from 4:02 a.m. on 5 October to 6 October. It produced a data set of 2,188 tweets. These tweets were then exported as a CSV file to Excel. They were also analyzed as a network utilizing Gephi and the network analysis tool embedded in Netlytic, for comparison.
Finally, the Digital Methods Initiative tool Twitter Capture and Analysis Toolset (DMI-TCAT) was used to query #MMIW. With an aim to support digital methods, DMI TCAT was created as an open-source tool available through GitHub (Borra and Rieder, 2014). Like YourTwapperKeeper, DMI TCAT relies on both Twitter’s streaming API and its REST API. While the code for installing TCAT is published through GitHub, free-of-charge, it requires a server dedicated to its function since it runs on an on-going basis, according to the search criteria entered. This data set comprised results framed from 8:00 a.m. GMT on 5 October to 6 October and produced 2,036 tweets. Data from this set was exported as CSV files to Excel as well as network files to Gephi for analysis.
Case study: A comparison of three free Twitter API tools
This section will outline three tools researchers might utilize to capture and analyze Twitter data. The first is Storify (storify.com), which specializes in collecting visual data as it appears in the platform. The second is Netlytic (netlytic.org), which is a tool created for the Social Media Lab, currently at Ryerson University. The third is the Digital Methods Initiative Twitter Capture and Analysis Toolset (DMI TCAT) (https://wiki.digitalmethods.net/Dmi/ToolDmiTcat), which originated as part of the digital methods initiative at the University of Amsterdam. These are certainly not the only tools available to researchers. However, they represent some of the better options for those who cannot afford to purchase Twitter data. While differing in capabilities and ease of use, each tool is bound by the same Twitter API restrictions. Data grabs will most likely not capture tweets older than a week or two and are limited to a daily quota of one percent of the entire Twitter stream.
Researchers utilize a variety of methods for analyzing Twitter, such as time series and sentiment analysis (Thelwall, 2014), computer-assisted content analysis (Einspanner et al., 2014), as well as ethnographic and qualitative research such as discourse analysis (Marwick, 2014). The visualizations produced by Storify, Netlytic, and DMI-TCAT are informative of the data they represent and are also effective entry points for further qualitative research.
Which data analytics tool best fits a research project is, of course, largely determined by the epistemological and theoretical underpinnings situating the research. Annette Markham (2012), for example, calls for researchers to fabricate social media posts similar to originals in an effort to more fully anonymize research subjects. While most Twitter researchers see no ethical dilemma in analyzing Tweets obtained through the Twitter API (see, for example, Bruns et al., 2012), a priority of anonymity makes APIs such as Storify a less than ideal fit for such research. There is, of course, a difference between analyzing and publishing data. However, publications with links to Storify collections do not, inherently, anonymize posts.
The difference between using surface image or textual grabs of Tweets through methods such as a Google query or Storify and utilizing API tools such as YourTwapperKeeper, DMI TCAT, and Netlytics highlights the difference between what Richard Rogers calls ‘digitized’ methods and ‘natively digital’ methods (Rogers, 2013: 204). When researchers attempt to use established methods of analysis by creating or using digital means, they are digitizing their efforts. However, when methods of analysis are adapted to consider the natural climate of the platform providing access to data, then the researcher is using digital methods. For example, a screen shot of tweets analyzed through conversation analysis does not fully consider the nature of Twitter. Elements such as hashtags, handles, retweets, links, and the open-audience style of tweets as well as networks of followers are not inherently considered with conversation analysis. Adopting a digital method approach, some call for the Microanalysis of Online Data (MOOD) as a form of digital conversation analysis (Giles et al., 2015). Gruzd and Wellman note that “different social media platforms support different types of interactions (such as ‘likes’ on Facebook vs. ‘retweets’ on Twitter) and connections (friends on Facebook vs. asymmetric following relationships on Twitter)” (2014: 1253). They argue researchers must demonstrate an awareness of platform differences when analyzing data.
Researchers seeking to practice digital methods (Rogers, 2013) would want access to metadata hidden by Storify’s capture process. Storify preserves active links to hashtags and likes; however, the information is kept in the same format as Twitter itself presents. This allows for manual analysis of small data sets but not large-scale data analytics. Nevertheless, if the focus of analysis is on discourse, and relational data between actors is valued less than content, a Storify capture enables a visibly rich representation of Tweets.
Axel Bruns and Stefan Stieglitz identify six “key data points” for analyzing Twitter data: sender, recipient(s), timestamp, tweet type, hashtag(s), and URLs (2014: 71). These are what they consider to be the basic metrics provided by the Twitter API. While it would be possible to identify and code each of these manually for a small data set collected with Storify, this metadata is automatically coded and categorized into csv format through DMI-TCAT. In order to compare capacity of these three tools, each has been used to capture issue-specific tweets in a one-day time period.
Storify
The first query used Storify.com to search for #SistersInSpirit on 13 October. The intended data set was for posts on 5 October, which is beyond the often recognized one-week limit of REST API searches (Borra and Rieder, 2014: 268). However, Storify was able to reach more than one week back and collect 54 Tweets from that time period.
Storify allows free non-profit use of its services while requiring businesses to purchase a Storify Enterprise subscription. Once a user has opened a profile, the researcher can link Twitter or Facebook profiles in order to enable searches of those platforms. Storify allows users to enter search terms such as hashtags and then query Twitter, Facebook, Google+, YouTube, Flickr, Instagram, Tumblr, Google, and 10 other platforms. For Twitter, this search produces an initial list of 50 Tweets, complete with their images and active links. These posts can be collected into a story as a complete set or selected individually for adding to the saved story. It is possible to repeatedly call for additional sets of 50 returns until the date or size limits of the API are reached. Once collated, these Tweets can be published to the web for others to see the story created through gathering social media.
While the published collection (https://storify.com/mylynnfelt/sisters-in-spirit-march) looks visually accurate to the original Twitter posts, the analytics driving which posts are retrieved by Storify remain unnamed. There is no automatic access to aggregate data or to metadata. The data set produced would be fruitful for semiotic or textual analysis but is limited in portraying networks of actors, frequency of retweets, and other useful data. It is worth noting that this data set contains far fewer posts from 5 October than were retrieved through either of the other tools. This is due to the constraints of this tool. A query of #MMIW on 13 October returned so many recent posts, it was not possible to reach back to 5 October. However, when Storify queried #SistersInSpirit, the 5 October posts appeared in the data grab. Therefore, this search focuses on the latter hashtag. It is also worth noting that it was difficult to move posts as single entities and far simpler to “add all” returned data. The data set also includes several posts beyond the 5 October planned timeline. It was also difficult to remove posts already added to the story. For smaller data sets and focused, visual and textual analysis, Storify is a useful tool.
Netlytic
Netlytic is an easy-to-use, welcoming interface for the inexperienced data analyst. It supports analysis of Twitter, Facebook, Instagram, YouTube, and data sets imported by the user. There are three tiers of Netlytic profiles, each with varying restrictions and abilities of use. Someone seeking to learn the tool with smaller data sets can comfortably use the free first tier. However, this limits the researcher to only three queries at a time, each limited to a one day search. In order to begin another query, a previous one must be eliminated. Once all useful data has been exported from the site, this might not be a problem. However, a true cross-platform analysis may require access to more searches at once. Tier two provides access to up to five searches at once, each limited to 10,000 records. Tier three costs between $9 and $35 per month, depending on the status of the researcher as a student, professional academic, or business person. This tier allows for up to 300 simultaneous data sets of up to 100,000 records each.
A Netlytic Twitter query is supported by several analytic steps. The researcher is moved along the capture and analysis process from edit to preview, followed by text analysis, network analysis, and ending with a report full of links to save visual diagrams or embed them in a website. The system is flexible, allowing the user to export all captured tweets and related metadata to a csv file, where more analysis may continue as well as allowing network analysis exports to several useful analysis programs such as Gephi. However, for researchers unfamiliar with such programs, Netlytic also offers its own network visualization tools. This visualization can be created using either the name network or the chain network. During text analysis, visualizations of word clouds and words over time are automatically produced. It is also possible to add categories of analysis for Netlytic to apply to the data set. Each of these tools is simple to use but somewhat restricted by the dashboard. For example, social network analysis completed in Gephi opens researchers to countless options for customizing the visualization to represent the data while the Netlytic equivalent tool allows far less choice in presentation. For the researcher unfamiliar with these methods, a simpler dashboard is likely preferable. Researchers wanting to calculate indegree, outdegree, various centrality measures, and other metrics for each node as well as the overall statistical properties of a network would need to export the data to Gephi for such analysis beyond mere visualization.
Figures 3 and 4 demonstrate how the same Twitter data gathered through Netlytic can be represented very differently if produced through Netlytic or if exported to another program, such as Gephi. One function of network analysis is often to identify modularity and clusters. For a researcher seeking to enrich data analytics through interviews and ethnographic research, identifying key actors in a network provides entry points for further analysis. The Netlytic network visualization tool is simple and easy to use. However, it is quite limited in options for representation. It is fortunate that Netlytic allows for network data export to other programs. The network portrayed in Figure 3 reveals the key speakers in this data set. The larger nodes are more influential speakers. The color-coded clusters demonstrate connections between groups within the network. An analysis of the content of tweets may reveal different tone and emphasized topics among the different clusters of speakers. These details are also present in Figure 4; however, since the entire data set is portrayed at once, there are too many nodes to show labels for individual accounts. Both visualizations allow researchers to analyze the network of MMIW advocates according to relationships and content.
Twitter data gathered on Netlytic and exported to Gephi where the data was filtered to eliminate small noise and color coded for clusters. This network uses a Forced Atlas II Layout. Nodes are sized according to degree. Network analysis produced by Netlytic from the 5 October #MMIW capture. While Twitter users are clustered by color, the data set represents all Tweets. This is created using a Fruchterman Reingold layout with nodes sized according to total degree. Adding labels to each account would overlap to the effect that they are unreadable.

Looking at the data this way usually involves social network analysis, which “takes at its starting point the premise that social life is created primarily and most importantly by relations and the patterns formed by these relations. Social networks are formally defined as a set of nodes (or network members) that are tied by one or more types of relations” (Marin and Wellman, 2011: 11). This stance emphasizes the relationships between individual actors. “Social network analysis is neither a theory nor a methodology. Rather, it is a perspective or a paradigm…Unlike a theory, social network analysis provides a way of looking at a problem, but it does not predict what we will see” (Marin and Wellman, 2011: 22). Figures 3 and 4 are visualizations of social networks created through a common Twitter hashtag. While such graphs allow researchers to map out connections and visualize networks, this is not a method or theory on its own and can be used dynamically with various methods.
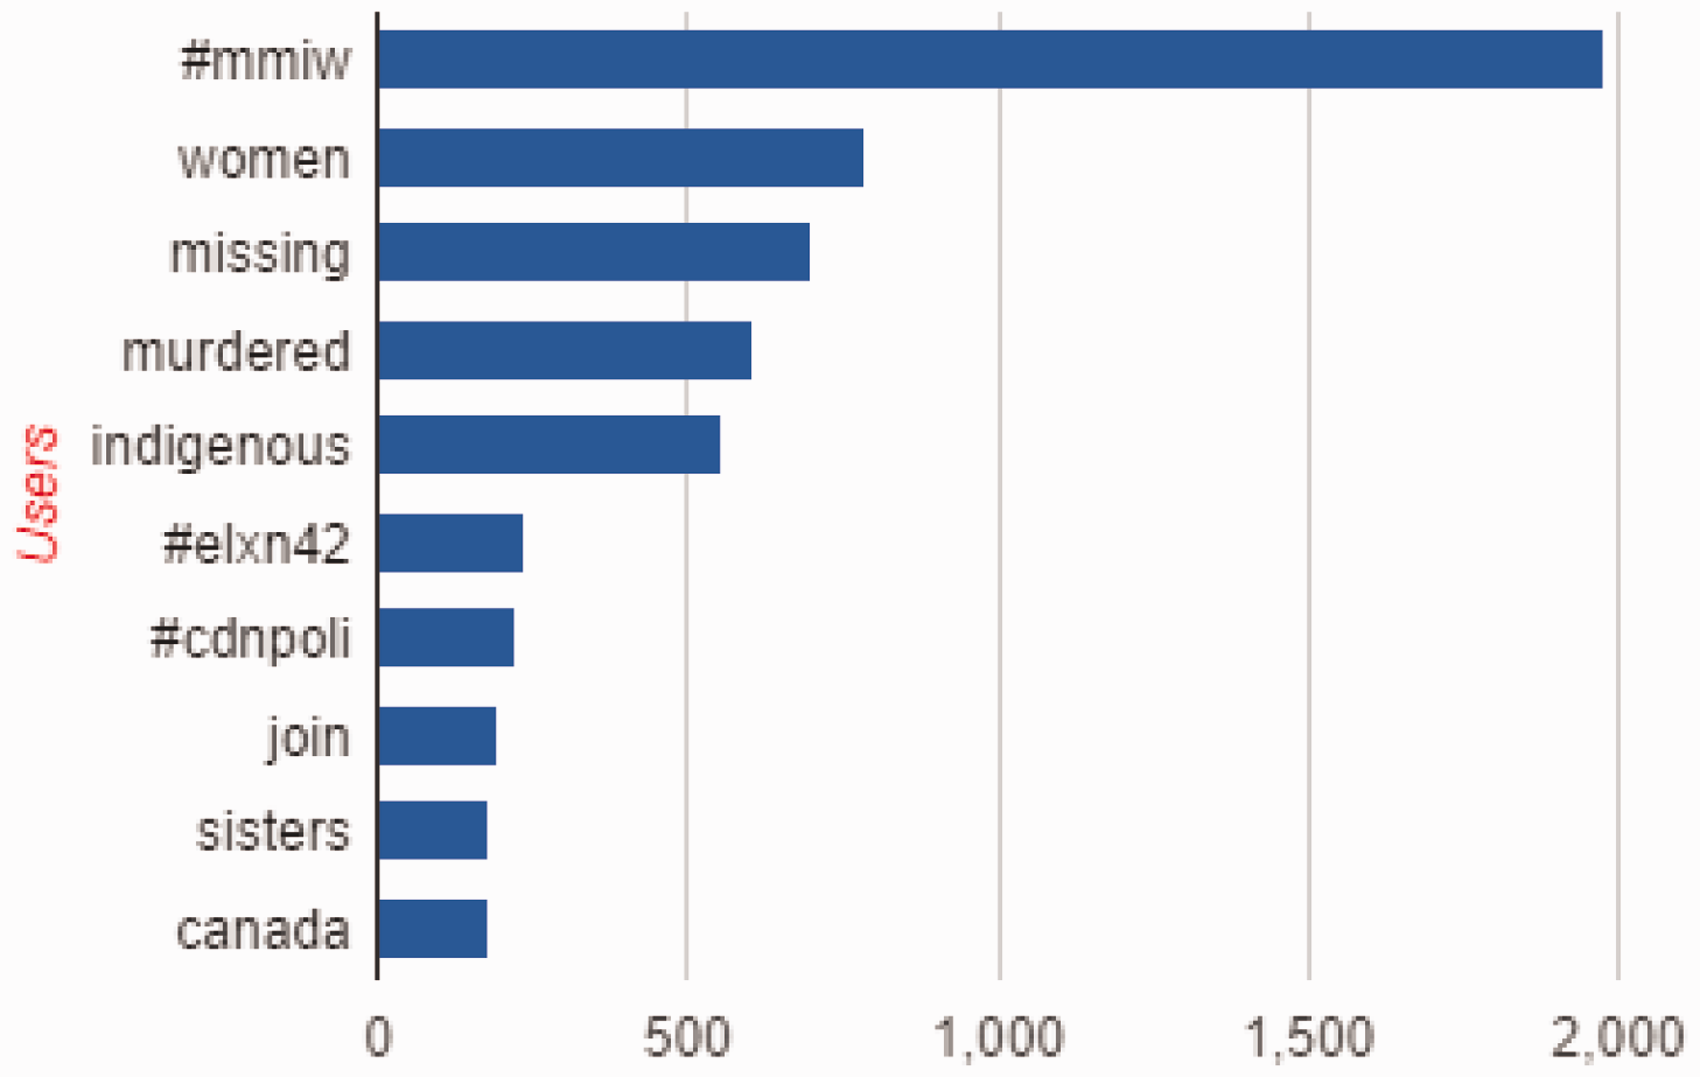
The 5 October capture of tweets containing #MMIW using Netlytic returned 2188 messages from 1529 posters. Netlytic offers simple charts showing the top 10 posters and the top 10 word frequency in the posts, as seen in Figures 5 and 6. It is useful to have such graphs quickly produced. It is also still possible to create custom-made charts using data once exported in CSV format to a program such as Excel. The automatic representation of word frequency and influential accounts allows early understanding of large data sets. Researchers can easily use this overall picture to focus on a smaller sample from the data and conduct qualitative analysis such as interviews with key speakers and content analysis.
A Netlytic-produced chart of the top 10 Twitter Users in the 5 October 2015 #MMIW data set. A Netlytic-produced chart of the top 10 word frequencies in the 5 October 2015 #MMIW Twitter data set.
It is noteworthy in this data set that some of the most vocal Twitter accounts, as portrayed in Figure 5, are not necessarily the most influential speakers demonstrated in Figure 3. Two examples of this are ‘lowabeebe’ and ‘lorene1voice.’ Although ‘lowabeebe’ is only the second most prominent user, according to Figure 5, as Figure 3 shows, this is the largest node in the network, based on both in-degree and out-degree. ‘Lorene1voice’ is a user who tweets a call for a national inquiry to MMIW every day. This user appears in the top user list but is not highly involved in the network of interactions on this day of analysis.
The top word frequency chart, Figure 6, shows that even though this data set represents a window immediately following the Sisters in Spirit March and Red Dress Day, Twitter discourse emphasized the words that spell out the MMIW hashtag and election-related hashtags. This topic is explored more fully with charts generated through DMI TCAT.
DMI TCAT
The Twitter Capture and Analysis Toolset for the Digital Methods Initiative is probably the most functional free Twitter analysis tool. While this toolset does not serve to capture and analyze any platforms other than Twitter, the DMI tools wiki page provides separate options for examining Amazon, Pinterest, Google, Instagram, Facebook, Tumblr, Wikipedia, YouTube, and others. Of all the tools hosted on the DMI wiki, however, TCAT is probably the least accessible to new users. While Storify and Netlytic are both accessible to anyone willing to connect through the internet and establish a profile account, TCAT is available only to researchers affiliated with The University of Amsterdam. However, the source code for TCAT is openly available through GitHub. This means that anyone with a host server and some computer programming skills can use the tool freely. However, such steps may require a partnership between social science and humanities researchers with computer science or campus IT support staff in order to initiate use of TCAT.
Once established, TCAT offers abundant metadata and flexibility. Researchers can export the entire set of tweets with accompanying metadata as a csv file. This includes 35 columns of separate categories, compared with Netlytic’s 11 for the full data set. Additionally, it is possible to export a random sample of 1,000 tweets with the same accompanying metadata in order to conduct a closer analysis of a smaller data pool. It is possible to export each individual retweet as well as limiting the export to tweets containing geo-location data.
Under the category of Tweet Stats and Activity Metrics, researchers are provided with nearly a dozen separate reports, each accessed as csv files. This includes sub-sets such as Tweet Statistics, Hashtag frequency, Tweet Frequency, Mention Frequency, and Media Frequency, to name a few. Thus, information from the data pool can be parsed separately and represented with flexibility.
Under the Network exports, TCAT supports analysis through secondary programs such as Gephi. Again, the export options exceed Netlytic’s by offering half a dozen separate data sub-sets which can be exported. Figure 7 demonstrates a co-hashtag graph created in Gephi with a data export from TCAT. However, TCAT does not offer an in-house, simple method for generating such images. It is up to the researcher to handle data analysis through secondary programs such as Excel, Gephi, and Tableau. Overall, TCAT offers far more dynamic research options than Storify or Netlytic. However, the learning curve to establish TCAT on a server with constant access to the internet and a computer support staff familiar with coding language is only the first step to utilizing this tool effectively. Researchers must also be proficient in network analysis programs such as Gephi and csv-support programs such as Microsoft Excel in order to do much of anything with the data TCAT offers.
Co-hashtag network from TCAT 5 October #MMIW Twitter set. This Gephi visualization uses a Fruchterman Reingold layout. The clusters are colored according to modularity, and the nodes are sized by modularity class. This depicts discursive clusters among hashtags that appear with the one used to define the data set, #MMIW.
Conclusion
The free tools available for Twitter analysis allow for dynamic visualizations of networks and Twitter content. A social network analysis reveals who the influential social media users are in a given network as well as the subordinated voices. Comparing top users with network visualizations highlights the differences between those who are highly vocal and those who are highly connected. These tools make it possible for researchers to gain the macro view and see relationships between actors and between topics of discourse. These tools allow patterns among participants and patterns of discourse to emerge. Full understanding of these patterns is best enriched with qualitative analysis of the data. The tools that enable this Big Data approach position researchers with important micro entry points such as clusters of conversation, influential network members, and dominant as well as subordinated discourses.
The meta-analysis revealed a low usage of data analytics among communication studies scholars. Perhaps some social scientists are resistant to social media data analytics because the methods differ from more traditional social science research. However, most Twitter analytic tools enable multiple research methods such as social network analysis, geographic analysis, content analysis, and textual hermeneutics and more. “‘Big Data’ research in the humanities is rarely an end in itself, and does not replace or invalidate other approaches. It remains possible, and important, to continue to employ the well-established analytical repertoire of media communication, and cultural studies (and related disciplines), and indeed to use an initial exploration of the larger datasets which are now available as a way to pinpoint the specific areas that will provide most fruitful for ‘small data’ and ‘deep data’ research that proceeds, for example, through close reading, direct engagement, or ethnographic observation” (Bruns, 2013). Choices to utilize social media data in research can and should complement more established methods, thus creating thick description through multiple methods of analysis.
Research on Twitter has been steadily increasing since 2007, with the majority of researchers coming from an IT or computer science background; this research focuses mostly on the content of tweets (Ha et al., 2014: 777). If researchers adopt Rogers’ (2013) call for digital methods that consider built-in characteristics of a platform under analysis, future Twitter research might examine the content of tweets, but within a larger context of other network features such as retweets, handles, favorites, and other platform-specific practices.
The choice of which tools to use in social media analysis should be driven by research design. API tools are constrained by Twitter’s policies of allowing capture of only up to one percent of a daily Twitter flow. Queries are also limited to real time, capable of searching back up to one week, but no further. While it is possible to scrape Twitter.com and access older tweets, this form of capture does not retrieve underlying metadata available through API techniques (Bruns, 2013). While some forms of data analysis would not be inhibited by missing metadata, relevant context and nuanced meaning is lost without it.
Social media are a rich data source capable of answering many social science research questions. Twitter is of particular interest, given its spread of use, public nature, and socio-technical flexibility. However, changes in Twitter policy over the past five years have made access to tweets more costly and restrictive. Various API tools exist for researchers with limited funding to aggregate and analyze Twitter data. Three of these tools include Storify, Netlytic, and DMI-TCAT. The first two are capable of capturing data from social media platforms beyond Twitter. TCAT is one of many DMI tools, and the others are directed to alternative platforms. Both TCAT and Netlytic combine capture with analysis. Storify maintains the original visual presentation of posts and active links but neglects to generate usable metadata. Netlytics analysis tools generate quality visualizations without significant prior training. This tool is user-friendly. However, Netlytic, in its most robust tier, has a price associated with it. Tiers I and II are quite flexible, allowing for automatic analysis or data exploration to more rigorous analytical programs. The metadata available for export is not as complete or varied as what TCAT generates. TCAT, of the three tools discussed here, requires the most technical expertise but provides the most fertile data for analysis.
Many note a computational turn in an era of Big Data (Berry, 2014; Kennedy et al., 2014). Corporations and governments routinely employ data analytics. As social media data becomes increasingly commodified, challenges of free access for non-profit research compound. This may lead to the stratification of data haves and have-nots with academics in the latter category. Nevertheless, researchers have tools freely available for social media analysis, albeit each limited by platform API agreements.
There is a need for critical data analysis, utilizing digital methods for capturing and analyzing social media according to platform dynamics. There is also a need for enriching data analytics with more traditional methodologies to provide thick description. Citing Gelernter (2010), David Berry expresses a concern that the digital provides an information overload focusing on the present. Just as light pollution in cities drowns out a view of the stars, too much instant data can flood the research focus, preventing a historical perspective (2014: 15). In a world where it is increasingly difficult to separate communication from computers (Berry, 2014: 16), communication researchers have much to gain from the digital tools that reveal data analytics. This computational analysis, however, should be supported by qualitative methods to enable both the big picture and the close, critical view. It is vital that social scientists apply such critical analyses to utilize the vast potential of social media data for purposes of epistemology rather than the exploitation common in corporate and government Big Data analytics.
Footnotes
Acknowledgements
The author would like to thank Dr Joanna Redden for her advice and mentorship during the writing of this article as well as the reviewers who provided constructive feedback.
Declaration of conflicting interests
The author(s) declared no potential conflicts of interest with respect to the research, authorship, and/or publication of this article.
Funding
The author(s) disclosed receipt of the following financial support for the research, authorship, and/or publication of this article: this research is conducted as part of a larger SSHRC-funded project, with Dr Maria Bakardjieva and Dr Delia Dumitrica, titled Social Media and Canadian Civic Culture: Comparing Emerging Practices of Democratic Participation in Canada.