
Abstract
This paper discusses the empirical, Application Programming Interface (API)-based analysis of very large Facebook Pages. Looking in detail at the technical characteristics, conventions, and peculiarities of Facebook’s architecture and data interface, we argue that such technical fieldwork is essential to data-driven research, both as a crucial form of data critique and as a way to identify analytical opportunities. Using the “We are all Khaled Said” Facebook Page, which hosted the activities of nearly 1.9 million users during the Egyptian Revolution and beyond, as empirical example, we show how Facebook’s API raises important questions about data detail, completeness, consistency over time, and architectural complexity. We then outline an exploratory approach and a number of analytical techniques that take the API and its idiosyncrasies as a starting point for the concrete investigation of a large dataset. Our goal is to close the gap between Big Data research and research about Big Data by showing that the critical investigation of technicity is essential for empirical research and that attention to the particularities of empirical work can provide a deeper understanding of the various issues Big Data research is entangled with.
Keywords
Introduction
Since social media services such as Facebook, Twitter, or Instagram have emerged as prominent online venues attracting very large numbers of users and intense activity, researchers from a range of disciplines have set out to study these platforms and the social phenomena they are entangled with through software-supported data capture and analysis. Drawing on approaches set in computational social science (Lazer et al., 2009), digital methods (Rogers, 2013), or computational variants of more traditional techniques, for instance content analysis (Lewis et al., 2013), these researchers have empirically explored three general directions: first and most frequently, studies have investigated particular cases set in genres such as political activism (Poell and Borra, 2012), public debates (Maireder and Schlögl, 2014), or disaster communication (Shaw et al., 2013); second, there have been studies trying to profile overall platform characteristics, often working with complete datasets (e.g. Cha et al., 2010; Prieur et al., 2008) or representative samples (e.g. Gerlitz and Rieder, 2013); third, a considerable number of researchers, often coming from computer science or related disciplines, have used social media data to develop and test formalizations of concepts coming out of communication studies or social exchange theory, for example the notion of “influence” (Watts and Dodds, 2007). Despite considerable differences in research direction and epistemological outlook, these approaches and fields share an interest in gathering large datasets from social media platforms and analyzing these data with the help of computational techniques. Official Application Programming Interfaces (APIs), provided by the platforms themselves, are typically used for collection, highlighting these technical passage points as a crucial matter of concern.
APIs are a means for programs to interact with each other and social media companies provide such interfaces to third party developers to foster the growth of an application ecosystem, thereby enhancing the value of the platform through added functionality and public exposure. As a side effect, APIs provide seemingly robust and convenient access to vast data pools for research purposes. But they are not designed to accommodate the needs of researchers and thus pose a series of specific problems, ranging from opacity to rate limiting or legal uncertainty. While not all of these problems are new, APIs introduce a degree of technicity—“technology considered in its efficacy or operative functioning” (Hoel and van der Tuin, 2013: 187)—into the research process, demanding not only mastery in purely technical terms, but also an appreciation of technical forms and functions on the level of methodology. Moreover, behind every social media API lurks another technical contraption, the platform itself, with its specific feature sets, interfaces, database architectures, and so forth. This raises the thorny question whether we should “understand these devices and platforms as part of our ‘methodology’” or rather as “part of the ‘object’ of our analysis” (Marres and Weltevrede, 2013: 322). Technicity, understood here as the particular operational principles and forms espoused by a platform like Facebook, demands that we treat them as both simultaneously, and suggests a “commitment to research-as-process” (Marres and Weltevrede, 2013: 315) that makes this tension a central concern.
Indeed, before becoming research into a particular case or question, data-driven social media analysis engages—not always in full awareness—in a curious kind of fieldwork that has to deal with technical characteristics, conventions, and peculiarities. This work is rarely considered to be a central part of research design. Since no one really enjoys dealing with subjects as infuriating and time-consuming as character set coherence or connection timeouts, 1 we gladly delegate these matters to the black box of a specialized tool or the hands of a research technician, hoping that they will be able to smooth out the jagged edges of technicity, to make it disappear both practically and epistemologically, leaving us with unadulterated access to social reality. But are the logistics behind computational techniques not as much part of the knowledge production process as the design and distribution of a questionnaire?
The recent debate around Big Data (cf. Ekbia et al., 2015) has begun to address the concerns raised by the technicity of data-driven research by critically discussing issues ranging from sampling to inequality in access, disparity in technological competence, and fundamental ethical dilemmas. But there remains a large gap between research about Big Data and actual Big Data research. On the one side, empirical research projects rarely address these critical questions as central topics, even if they are increasingly acknowledged; on the other side, critical discussion too often remains abstract, overly generalizing, and set in the rhetorical modes of unmasking and admonition. In both cases, the concrete technological fieldwork going into the construction of the data collection and analysis infrastructure remains uninvestigated.
This paper turns to the allied fields of software and platform studies (Fuller, 2008; Gillespie, 2010), albeit more in spirit than in letter, in order to inquire how the technicity of an API intervenes in the practice of an actual empirical research project based on data gleaned from Facebook. While software and platform studies generally consider more far-reaching social and political matters, they have indeed called attention to the specific architectures and logics embedded in digital artifacts. One of the goals, here, is to show that this attention is indispensable for data-driven research, not only to avoid skewed results, but also as a valuable resource when it comes to developing analytical strategies and interpreting findings. How much confidence in a variable should we have and, consequentially, how much explanatory weight can we burden it with? Is a particular variable an indicator for an aspect of the phenomenon under scrutiny or an artifact of the platform’s functional design? And, framed more positively, which methodological opportunities does an API provide in the first place and how can we make them serve our analytical objectives? If “raw data” is indeed an oxymoron (Bowker, 2005: 184), how have ingredients been precooked? How to process them even further? In short, how does an appreciation of the technicity of a platform help us make sense of the data captured from and through it?
To approach these questions in concrete terms, we stay mostly clear of a general discussion of the role of APIs in research and focus instead on the trials and tribulations of a particular social media research tool, Netvizz, which has enabled scholars to export data from Facebook since 2010 (Rieder, 2013). More specifically, we discuss a research project that investigated the role the “We are all Khaled Said” 2 Facebook Page 3 played in the Egyptian revolution of 2011 and beyond. This Page, founded by the Egyptian Google executive Wael Ghonim in June 2010 after the brutal death of a young man in police custody, has been consistently singled out by scholars as a major driver of the political events that led to the resignation and incarceration of president Hosni Mubarak in early 2011 (Abdulla, 2014; Tufekci and Wilson, 2012). Our research project brought together media scholars, political scientists, linguists, and Arabic scholars, who cooperated around a large-scale dataset retrieved from Facebook through its API. While the main findings of this project are reported elsewhere (Poell et al., 2015), we consider the issues we encountered and the methodological strategies we employed to be substantial enough to warrant a separate discussion of these methodological aspects. This decision is further justified by the relative lack of attention paid to data-driven Facebook research, in particular when compared with the much smaller Twitter platform. There are a number of reasons for this imbalance, but the “generally public nature of tweets and replies” (Bruns and Highfield, 2013: 671) certainly contrasts with Facebook’s much more restrictive and complicated architecture, already pulling the technical dimension into the foreground. By addressing both limitations and opportunities for data-driven Facebook research, this paper will hopefully prove useful to other projects and, at the same time, contribute productively to a deepening of the critical debate around API-based social media research.
In order to achieve these goals, our argument proceeds in three main steps: we first discuss the Facebook platform with an emphasis on Pages and briefly summarize previous empirical work; we then examine Facebook’s API from the angle of empirical research; a final section outlines the exploratory approach we adopted in our project and proposes a number of concrete techniques to analyze activity on (very) large Facebook Pages. We conclude by advocating for increased critical attention to technicity in social media research, as a means for both data critique and recognition of analytical opportunities.
Facebook and Facebook Pages
When scrutinizing the technicity of APIs in relation to empirical research, we cannot ignore the technical infrastructures data collection interfaces provide access to. This section therefore outlines the larger research setting we are confronted with, discusses the specific role of Facebook Pages, and summarizes previous efforts to analyze them.
Facebook as infrastructure and research setting
According to Star and Ruhleder (1996: 114) “an infrastructure occurs when local practices are afforded by a larger-scale technology, which can then be used in a natural, ready-to-hand fashion”, and this applies perfectly well to Facebook. Having expanded rapidly beyond its initial domain as a service designed for college campuses, it now counts 1.39 billion monthly active users, 4 and can be considered a general-purpose communication platform that hosts a vast collection of variegated practices. All of these practices are enabled and structured by the same grammars of action (Agre, 1994), the same set of action possibilities and interface features, even if local appropriations can vary significantly.
From a methodological perspective, these infrastructural qualities draw a parallel between social media platforms and social experiments in the sense that interfaces and functionalities establish a controlled environment that users act in, but have little power to change. There is neither a “dislike” button in Facebook’s vocabulary of action possibilities, nor one labeled “interesting”, “sad”, or “strange”. The artificial conditions social experiments submit their subjects to normally serve to isolate a particular aspect of behavior or cognition, with the goal of making it measurable. But the goals of social media services have little to do with academic research and, even if we consider obvious commercial interests, these platforms are significantly more open-ended than research experiments. Nonetheless, the controversy over a recent study (Kramer et al., 2014), where researchers affiliated with Facebook manipulated users’ News Feed to show happier or sadder messages, should not distract from the observation that the whole contraption is a designed environment and the News Feed is already painstakingly optimized to produce more engagement, longer time on site, and, at the end of the day, higher advertisement revenue. When working with data collected from APIs, we engage with a technical infrastructure that reflects the operational goals of a company and is merely inhabited by users.
API-based social media research does not rely on data produced by methodological devices conceived by researchers, such as questionnaires or observational protocols, but on “already formatted” (Marres and Weltevrede, 2013: 315) data retrieved through controlled technical interfaces containing standardized information fields specified by the platform provider. These fields do not simply represent an arbitrary observational grid of categories or variables that captures an otherwise unruly and overflowing external reality into a formalized set of data points. The shape of the data retrieved from APIs closely mirrors the technical infrastructure. A post appearing in a user’s News Feed—the filtered stream of “stories” appearing in the middle of a user’s home page—corresponds to the API entity “/post,” 5 and the various data fields reflect different properties of that item, for example its author, the publishing date, some content, a like count, and so forth. When considering these variables, we are confronted with a semantic bifurcation: on the one side, we can read them as markers of users’ intentional behavior; but on the other side, these properties have meaning as part of a technical system. A post’s like count can be interpreted as a measure of attention, engagement, or resonance—even if such attributions are rarely straightforward—but, at the same time, it functions as a means for the system to decide whether to show a post in certain users’ News Feeds or not. The purely technical meaning of a like, the way it becomes part of chains of technical causation, has consequences for concrete outcomes, such as the contents actually seen by users. And these consequences are independent from any “social” meaning we may want to attribute to a variable. We should therefore recognize that what we are studying when using data collected from APIs is not only a sociotechnical phenomenon, because human practice is channeled through interfaces and data structures, but also because the system itself interprets these practices and responds to them on the level of the interface. Although we cannot easily attribute outcomes to either technical functioning or user agency, we should attempt to describe and delineate the contributions of the technical system as a particular and pervasive actor. This is the first level of technicity we need to take into account when working with data collected from social media platforms.
From campus to public space
The technical characteristics of a platform take shape during a design process where forms and functions are related to use case scenarios embedded in what is generally called a domain. In the case of Facebook, one could say that the initial domain was “life on campus” and designing a system that both fits the domain and adds something appealing to it required both analysis or description (“what are the important aspects of college life?”) and synthesis or prescription (“these functionalities will allow users to have a better college life”). Over the years, Facebook’s domain has widened to include basically any area of human interaction. This broader focus became evident in 2006 when Facebook stopped requiring a university email address to sign up. Nowadays, according to the company, “[p]eople use Facebook to stay connected with friends and family, to discover what’s going on in the world, and to share and express what matters to them”. 6 The aspiration to target a wider set of practices was further realized in November 2007 with the introduction of Facebook Pages, which “are for businesses, brands and organizations to share their stories and connect with people”. 7
Pages thus occupy a distinct place in the larger platform, which mediates expression, exchange, and coordination in a number of different ways. In terms of schematic constellations, Facebook combines symmetric point-to-point networks, group communication (Facebook Groups), and forms of mass media like one-to-many communication (Facebook Pages). These elements are largely arranged around two types of entities: profile entities such as user profiles, Groups, and Pages have basic descriptions attached to them and, most importantly, function as organizing structures for content items such as posts, which are always produced by and attached to a profile entity. Pages are thus essentially streams of content items posted by the Page administrators, who can choose to allow user posts as well. In both cases, users can comment on posts, like or share them, and like (since 2010) or reply to (since 2013) individual comments. As we lay out in more detail below, these features are prone to evolve, affecting both actual use practices and the analytical possibilities available to researchers.
Pages constitute the most public parts of Facebook: “Facebook Pages […] are public spaces”. 8 They can be accessed without signing into an account and are most often used by organizations for presentation, outreach, marketing, and so forth. In contrast to Groups, where visibility and access can be modulated in various ways, Pages provide few means to limit their audience and those that exist target individual users only: an administrator can ban users, unsubscribe them by removing their like, and delete their posts or comments. Everyone can view posts on the Page itself, but an integral part of Facebook’s architecture is dedicated to enabling and managing the flow of content items from profile entities to users’ home pages, where they appear in the News Feed. Since this feed is by default filtered via an opaque combination of metrics and machine learning, academics have critically interrogated this “technical structuring of visibility” (Bucher, 2012: 1171), even if the most virulent debates have been occurring in marketing circles around the apparently shrinking reach of posts.
Compared to other social media platforms, Facebook’s content distribution architecture is quite complex. By friending people, joining Groups, or liking Pages, a user can subscribe to the output of these profile entities, which means that their content items will start appearing in the user’s News Feed. Engaging with content items from a particular profile entity through liking, sharing, or commenting leads to a higher probability that items from that entity will move through the filter in the future. But engaging with a post also grows the probability that it will appear in other people’s News Feed. 9 Once it does appear, users can decide to share the item with their friends, thereby distributing the content beyond those subscribed to the author of the post in question. The significance of these architectural complexities for researchers is considerable. For example, since content items percolate through the network, gauging the actual audience of a post without access to a Page’s administrator interface is very difficult and metrics such as like or share count, while certainly not without merit, are imperfect stand-ins. For lack of a better alternative, most of the existing work on Pages has built on these metrics.
Previous work on Facebook Pages
Despite the strong uptake of Pages by companies and public figures, the research literature on Facebook has been dominated by more “private” aspects and uses. A review article from 2012 surveyed existing literature on Facebook and identified “412 relevant articles, which were sorted into 5 categories: descriptive analysis of users, motivations for using Facebook, identity presentation, the role of Facebook in social interactions, and privacy” (Wilson et al., 2012: 203). This list signals an interesting division in research focus: while those parts of the social sciences that are mainly preoccupied with public communication concentrate on Twitter, psychology—and, in particular, social psychology—has shown a deep interest in the research opportunities afforded by Facebook, a platform that is seen as more conductive to the expression of an authentic self. This bifurcation, in conjunction with Facebook’s more challenging setting for API-based research, is probably the main reason why empirical and computational studies focusing on the public side of Facebook are still rare.
When it comes to investigating the practices developing around Pages, most existing studies examine the activities of political or commercial actors in relation to user engagement, in line with the basic communicative constellation Pages suggest: a rather clear separation between administrators who write posts and users who read and possibly react. A first group of scholars analyzed Pages maintained by government (Alam and Walker, 2011) or political candidates during election campaigns (Gulati and Williams, 2013; Larsson, 2014, 2015). A second group focused on collections of company Pages (Bonsón and Ratkai, 2013) or possible metrics for the analysis of such Pages (Sabate et al., 2014). Finally, a recent paper (van Es et al., 2014) investigated two Pages representing opposing views in a public debate in the Netherlands. In most of these studies, scholars relied on relatively simple frequency counts for posts and engagement metrics based on liking, commenting, and sharing, which are often combined with content classification of posts and/or comments. Only one paper (van Es et al., 2014) analyzed the temporal distribution of user comments. The studies working with data captured from Facebook’s API used ready-made tools and did not reflect further on the status and validity of these data.
While computer scientists have written on the technical design and use possibilities of the Facebook API (Müller and Thiesing, 2011), there has been little critical assessment. Bodle (2011) is one of the few authors having investigated the API critically, but his focus is on the larger commercial logic rather than the issues encountered by empirical research. The rest of this paper is therefore dedicated to an analysis of the API in relation to the data-driven study of Facebook Pages.
Facebook’s API and empirical research
The appealing possibility to easily collect large amounts of potentially interesting data from social media services without the need to “scrape” them from the interface is contrasted by the observation that practical access is governed by APIs that are not only “far from neutral tools” (Bucher, 2013: n.p.), but subject to a company’s fluctuating view of how sharing data and functionality with third-party developers can benefit their platform. Facebook’s API is no exception. In this section, we will thus engage in technical fieldwork and propose a critique of the API based on the numerous issues we encountered during the development and maintenance of the Netvizz application and the Khaled Said research project.
Facebook’s API
APIs are constructed for different purposes, but mainly to make platforms or services more appealing to users by adding functionality, public presence, and so forth. Facebook, in particular, has close relationships with third-party developers, especially with social gaming companies or dating apps like Tinder that require a Facebook account and provide incentives to groom one’s profile. Academic research is certainly not considered a central part of the intended audience for APIs and this shows both in the way these interfaces work and evolve and in the reluctance to provide any special provisions to (external) scholars. But instead of entering further into the debate about the more general questions attached to working with APIs (cf. Lomborg and Bechmann, 2014), we want to focus on the specific case of Facebook and, in particular, Facebook Pages. In this, we follow the call by Lazer et al. (2014) to “study the algorithm”, which we consider the API to be a part of: Twitter, Facebook, Google, and the Internet more generally are constantly changing because of the actions of millions of engineers and consumers. Researchers need a better understanding of how these changes occur over time. (Lazer et al., 2014: 1205)
Back in February 2007, however, Facebook added a second point of access to complement the REST API, facilitating more complex interactions with the data pool. The Facebook Query Language (FQL), a subset of the Structured Query Language (SQL) used by the highly optimized MySQL servers Facebook runs its backend on, allowed for powerful filtering and concatenation, quite uncommon in the web-API space. Retrieving complex compound data such as large friendship networks became considerably easier and much faster. In October 2009, the company finally introduced the so-called Graph API, a redesign of the REST API, which facilitated app development by moving the API interface closer to the entities and relationships Facebook’s architecture and interfaces are organized around. Between 2009 and 2014 many smaller changes or additions were made, but the general setup remained by and large the same. The year 2014, however, marked a turning point. Over the span of merely six months versions v2.0, v2.1, and v2.2 of the Graph API were introduced and older access methods have since been progressively deprecated and shut down. These new interfaces represent a considerable change in philosophy and mark a multilayered move toward much stronger protection of user privacy vis-à-vis third-party apps. This includes the adoption of app-scoped identifiers, making it impossible to combine datasets retrieved through different apps; the removal of FQL in v2.2; the progressive disappearance of friendship relations and News Feed access from all APIs; an obligatory review procedure for all apps that ask for more than the most basic access permissions.
Since we are still in the middle of these changes, it is hard to fully assess their significance for researchers, but it is already clear that they will be far-reaching. During the writing of this paper Netvizz, the app we used to retrieve our Egyptian dataset, was blocked by Facebook and could only be reinstated after all features for personal data export were removed. Although some of these elements are still available through the API, the capacity to export them—crucial for research—is prohibited by the company’s platform policy. Facebook’s differentiation between public (open) and private (closed) has become the structuring element for API access control.
For the moment, Facebook Pages have not been affected by these limitations. Facebook’s decision to render them public to the largest possible degree—one need not even sign into Facebook to access a Page—continues on the level of data capture via the API. Although we will nuance this statement further down, Facebook grants access to all of the content entities on the Page since its inception, to all comments on posts, and to all users that liked or commented on a post. This makes these Pages eminently accessible to computational research. For our project, we were able to retrieve 14,072 posts, as well as 6,810,357 comments in full text and 32,030,731 likes made by 1,892,118 unique users. While profiles are generally well protected, users’ names were available in full. Considering Facebook’s real name policy, the sheer mass of retrievable information through Pages should give us pause.
API fieldwork and data critique
Working with an API is not only bounded by the continuously evolving technical interfaces and the policies that accompany them; to fully investigate the technical fieldwork going into the data collection process one would have to include many different elements. APIs are idiosyncratic objects that vary, for example, in how connections are managed (Twitter allows for persistent near-realtime connections, Facebook only allows for conventional call-response access), how errors are handled (Facebook’s API used to often fail without giving reasons), how call frequency is governed (Facebook has a complicated three level system for rate limiting 11 ), or how far back in time data is made accessible (Facebook has few time limitations, Twitter severely restricts free access to historical data). All of these aspects need to be attended to when working with an API and the chance that any kind of research software can fully deal with a constantly changing set of issues is small. This does not mean that these things cannot be done well; but the blackboxing of an important part of the research chain is a real issue when it comes to assessing the merit of findings.
To compensate for some of these difficulties, companies usually provide different tools to assist developers in their work. These not only include testing or sandbox environments such as the Facebook API Explorer shown in Figure 1, but also Software Development Kits (SDKs) that wrap actual HTTP calls behind language-specific functions or classes, thereby providing a higher level API that sits on top of the actual API. This makes development faster and more convenient, but adds yet another link to the chain. A wider approach to API fieldwork would have to include these tools, as well as sites like Stack Overflow
12
that host communities of practice engaged in mutual assistance and, because questions and answers are visible to everyone, in the accumulation of deep knowledge about the peculiarities of popular APIs. Although such a wider examination is beyond the scope of this paper, a more detailed account of our encounter with Facebook’s API is crucial for our argument.
Facebook’s API Explorer, a helpful tool for developers to test API calls. The image shows the result (in JSON format) of a basic Graph API v2.2 call for the “We are all Khaled Said” Page.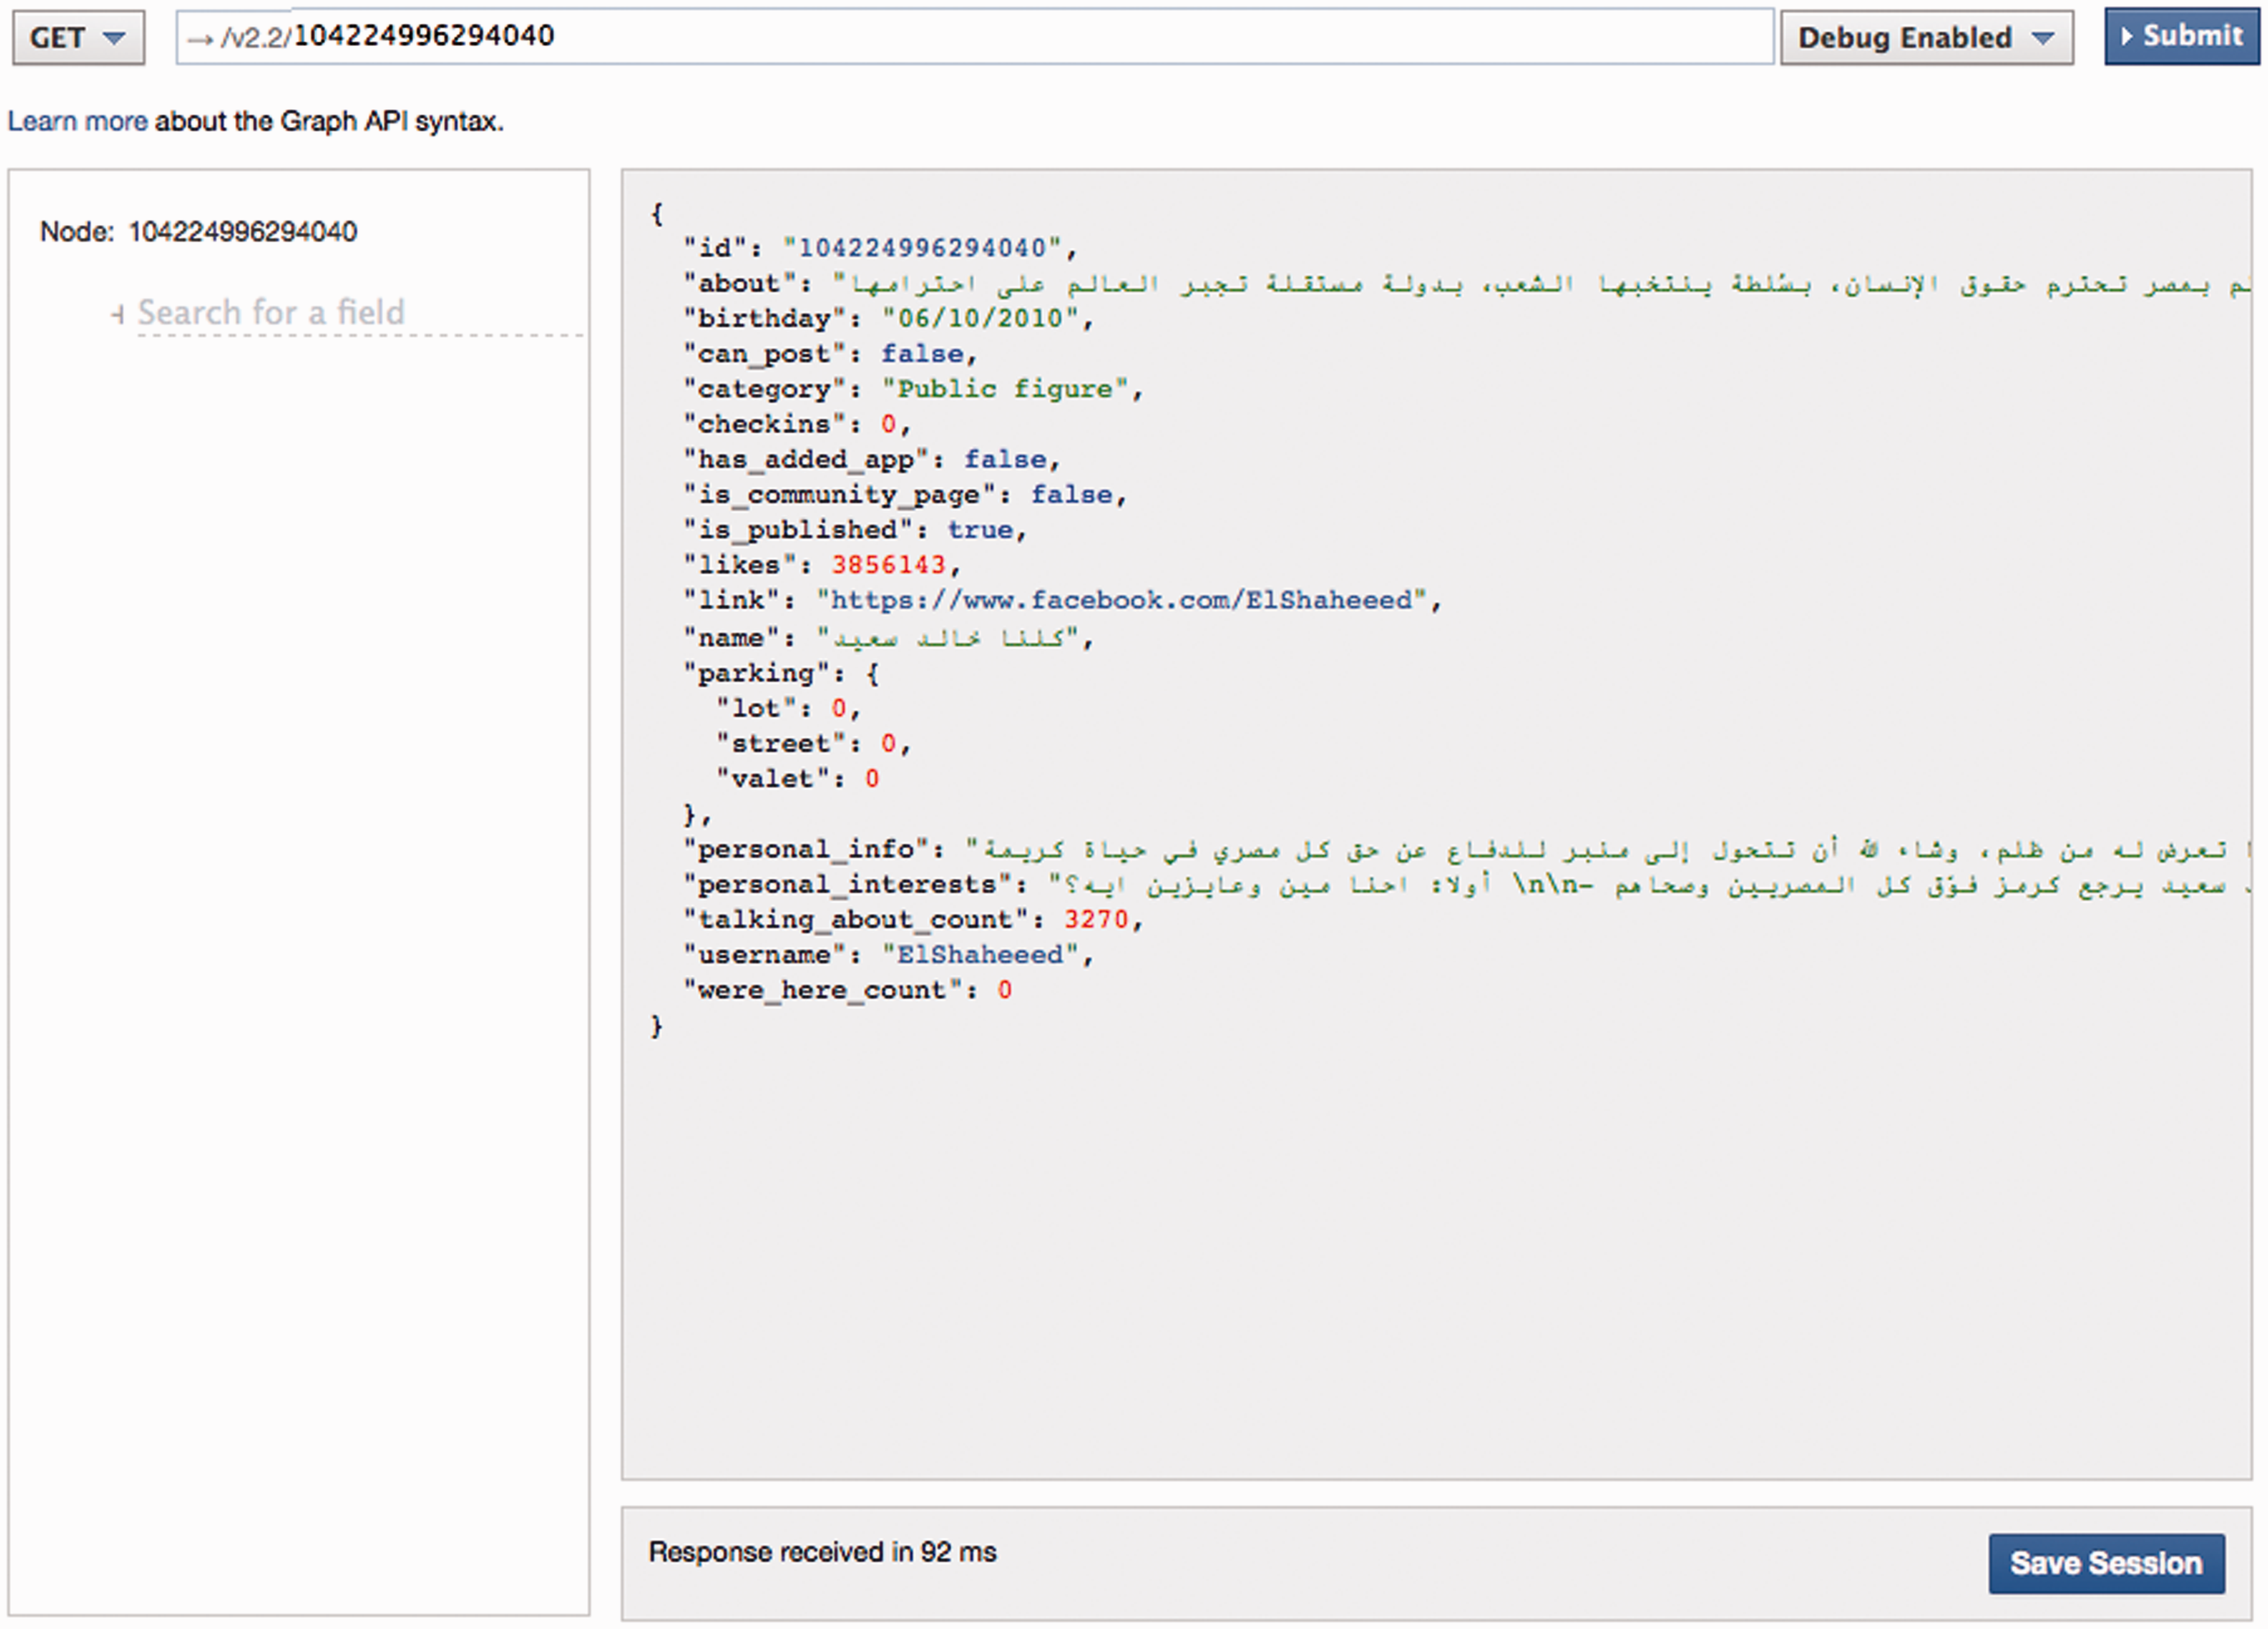
With the help of a modified version of the Netvizz application—the public version is unable to deal with Pages the size of “We are all Khaled Said”—we collected our data in January 2014, covering the full period of posting activity on the Page between 10 June 2010 and 3 July 2013. We retrieved all of the posts from the Page, as well as the comments, likes, and shares these posts received. Researchers usually use counts of these elements as indicators for resonance or engagement, and one can rightfully wonder whether ascribing “a single meaning to any of these behaviors masks the complexities of users’ actual intentions and experiences” (Driscoll and Walker, 2014: 1747). But before we can even begin to connect with this level of interpretation, the mere technical meaning of these variables poses a number of challenges.
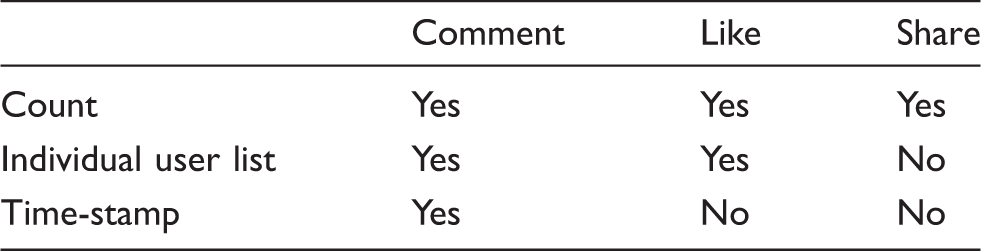
The data facets available for the three actions on posts: commenting, liking, and sharing.
A second issue is completeness. While Facebook seems to provide complete access to data, the question is more complex than it appears at first glance. For each post on a Page, the API indeed provides a list of likes and comments containing user names and identifiers. If explicitly requested, Facebook also provides a simple count for both elements. When comparing this count to the number of elements actually retrieved, we noticed a systematic discrepancy between the two: the number of retrieved likes on posts was on average 7.1% lower than Facebook’s count (a mean of 2,276 likes retrieved vs. 2,451 counted) and that of comments 23.3% (484 vs. 657). While we cannot be sure about the exact reasons behind these discrepancies without confirmation from Facebook, they can be explained in a number of ways: both likes and comments can be retracted, accounts can be deleted, and privacy settings can reduce the elements retrievable through the API. 13 But what explains the disparity in missing elements between likes and comments? These are governed by the same privacy settings. Possible explanations could be that administrators actively deleted an important number of comments or that some heavy commenters deleted their accounts. But this is largely speculation. For our project, we selected Facebook’s counts for quantitative analysis, but textual analysis could obviously only be applied to the retrieved comments. When it comes to share counts, however, an additional caveat applies. Until early 2015, the API only provided a value for public posts if they were shared more than ten times—below that number, the field remained empty. 14 Any descriptive statistic based on Facebook shares should thus be taken with an extra grain of salt, in particular when it comes to comparing results from different studies.
Platform changes constitute a third problem. During the lifetime of the Khaled Said Page, Facebook implemented a number of important new features, for example the introduction of a multiple-choice polling widget in late March 2011 or the possibility to like and reply to comments in March 2013. For our study, the first change in particular is highly relevant. Before and during the “hot” phase of the revolution in January and February 2011, the Page administrators had frequently made use of proto-polling by asking users to write their preference in a comment and counting votes manually. The move to a structured polling feature—which was removed again in June 2013—did thus not only affect the practices on the Page, but upsets the way we have to look at comment counts before and after its introduction. Since there is no simple quantitative solution to this problem, constant awareness when interpreting results is necessary.
A fourth issue is Facebook’s complex architecture. Since certain functionalities cannot be directly embedded into a post, user activity may happen elsewhere. For example, when a Page administrator creates a new Facebook Event—another platform-specific feature—an announcement post is created, but commenting, liking, and sharing mostly happen on the page of the event rather than the main Page, keeping the counts for the post low. Since these event pages provide different functionalities and interaction possibilities, even if there was an easy way to automatically find and include them, could we simply fuse the metrics into the main dataset?
We may be tempted to dismiss these concerns as “noise” or as something that can be “corrected for”, but we would like to advocate prudence and critical attentiveness when it comes to using these seemingly robust data. While none of these issues preclude making interesting and deep findings, when taken together, they force us to fully engage in a form of qualculative assessment (Cochoy, 2002) of the quantities we are presented with, even before we engage in any interpretation concerning user activities. What we encounter when dealing with Facebook’s API is not simply that variables and their values are “constructed”, but that this construction has particular characteristics that need to be interpreted and accounted for. Somewhere in Facebook’s backend lurk a couple of short lines of code that construct the values behind the “total_count” API field for likes and comments, and these lines determine how retracted reactions, removed comments, and deleted accounts are to be counted. Somewhere else a few lines of code are missing that could transfer the like count from an event to the post announcing that event. And these lines could change at any minute. Before we can even begin to interpret a variable in relation to its meaning in the context of human practice, we need to consider its production in the bowels of a server farm. While we usually cannot access the details of these procedures, this section has hopefully shown that we are not completely devoid of means to investigate and understand the peculiarities of the data we receive. API fieldwork cannot make the mentioned problems disappear, but it can contextualize and clarify the status of the data, preparing its use as a set of indicators. The following section further explores Facebook’s API, but moves from technical concerns to the many analytical possibilities it affords.
Analytical possibilities
Despite the various caveats, the data retrieved from Facebook Pages is rich in detail and allows for a variety of analytical techniques to be applied. In this section, we use the Egyptian “We are all Khaled Said” Page as an example to discuss four methodological directions that build on the data structures provided by Facebook’s API in relation to a concrete and complex case. These four directions take an explorative perspective, which we first need to introduce.
Exploration and description
Research on the basis of data gleaned from APIs unfolds in a peculiar analytical setting. There are indeed large amounts of well-structured data to be collected, but researchers have little to no influence on the actual elements made available. As argued above, not only are the parameters of the social experiment defined by Facebook, but the analytical grid of variables is as well. For many projects studying online activity, in particular those following a classic waterfall-type research protocol where the inquiry starts with a precise research question and methods are designed in accordance, data collection through APIs will thus not be a workable option, or at least not without additional data gathered through other means such as questionnaires.
This is one of the reasons why social media data analysis at this stage often deviates from what statistician John Tukey called “confirmatory data analysis”, or basically hypothesis testing, to engage in “exploratory data analysis”. While increasing stabilization of the field has led to a rise in hypothetico-deductive research, the variety and complexity of social media data often calls for more open-ended analysis or “detective work—numerical detective work—or counting detective work—or graphical detective work” (Tukey, 1977: 1). Sharing inductive affinities with methodologies such as grounded theory, “the discovery of theory from data” (Glaser and Strauss, 1967: 1), exploratory data analysis begins with a broader research interest and refrains from applying a hardened theoretical frame that would allow for the formulation of a testable hypothesis. Concepts are certainly brought in at various stages, but mainly through active theorizing in conversation with the data. Exploration, however, does not simply mean plunging into the data or that the data “speak for themselves”; it means iterative probing and systematic construction on both the empirical and the conceptual level. The scope of the inquiry becomes progressively narrower and more refined as understanding increases. But, according to Tukey, “[d]ata analysis must progress by approximate answers, at best, since its knowledge of what the problem really is will at best be approximate” (Tukey, 1962: 14). Exploration recognizes that local social realities are rich and diverse enough to challenge preconceived assumptions and emphasizes learning and flexibility over artificial precision.
Since exploratory data analysis operates mainly through descriptive statistics, often relying on charts and summaries,
15
one can establish a connection with other proponents of the recent “descriptive turn” (Savage, 2009), such as actor-network theory, where attributions of causality are bracketed in favor of meticulous description. Transposed to the issue at hand, Latour’s call to “follow the actors themselves” (Latour, 2005: 12) implies that we trace connections through the data, following “a process of assemblage, where processes of creativity, conceptual innovation, and observation can be used to mobilize novel insights” (Savage, 2009: 170). Sitting at the interstice between social science and humanities disciplines, descriptive approaches challenge traditional demarcations such as qualitative/quantitative. In the context of data-driven social media research, this is practically facilitated when the sample is complete, i.e. when all of the members of a population, for example all posts on a Facebook Page, are included. Researchers can then move with relative ease between micro and macro levels and combine intensive and extensive perspectives. Instead of the usual demarcations, we are then faced with the qualculative dilemmas evoked in previous sections of this paper: The traditional tension between ‘qualitative’ and ‘quantitative,’ therefore, is rendered obsolete with the introduction of Big Data techniques. In its place, we see a tension between the empirics of raw numbers, the algorithmics of mechanical filtering, and the dictates of subjective judgment, playing itself out in the question that Cameron raised more than 50 years ago: what counts and what doesn’t count? (Ekbia et al., 2015: 1531)
In our analysis of the Khaled Said Page, we started out from a specific research interest that mainly concerned the ways the Page served as a means for expression, exchange, debate, coordination, and mobilization in the complex and fast-moving context of a revolution. While the main findings of our project are reported elsewhere (Poell et al., 2015), the following sections outline the four principal methodological perspectives we applied to a remarkable dataset. Since the technical infrastructure is the same, these techniques can be applied to any Facebook Page, regardless of its size. But scale is relevant in other ways: the techniques we describe over the following pages are relying heavily on statistical summaries and data smoothing, both of which become problematic when the number of elements drops. Exploratory data analysis thus needs to maintain its “research-as-process” outlook when it comes to formal techniques, accepting that “relations between subjects, objects, methods and techniques” (Marres and Weltevrede, 2013: 314) will have to be adjusted continuously.
Overview and user analysis
Although the Khaled Said Page is only one Facebook Page among millions, the amount of activity it hosted during the period between 10 June 2010 and 3 July 2013, when the administrators were making posts nearly every day, is staggering.
Relying on API counters, the 14,072 posts the Page administrators published over three years received, on average, 2,451 likes and 657 comments, with numbers going regularly much higher, in particular during the revolutionary period in early 2011 (see Table 2). Interestingly, the most commented on post is one of the proto-polls mentioned above, asking users how the protests should continue on the morning of what would become the “Friday of Departure”, 11 February 2011, the day Hosni Mubarak resigned. The extreme tenacity of the administrators merits particular attention: out of the 1,120 days the Page was active, only 26 passed without a post. This already points towards one of our key findings, worked out in more detail in Poell et al. (2015), namely the important role the administrators played as “connective leaders” (Della Ratta and Valeriani, 2012) that distributed information, coordinated decision-making, and kept up the momentum.
Users can like a Facebook Page, which practically means that they subscribe to its content feed. In early 2015, the Khaled Said Page had received over four million likes, but the API provides no additional detail for this metric. We can neither collect a list of users, nor investigate the count’s evolution over time. What we can say about the audience of a Page thus only concerns the population active on a Page: since no user list is provided for sharing and our Page does not allow user posts, this means active through liking or commenting. We collected 1,892,118 unique accounts from the lists of likes and comments of all posts. The API provides full names and identifiers, which Netvizz anonymizes using the SHA-1 hashing algorithm. 16 Because Facebook did not allow users to block information of gender and the user-chosen interface language without opting out of app use altogether, these two variables were available for nearly all users.
While the dominance of English shown in Figure 2 may indicate a large presence of foreign or even western audiences of the Page, there are good reasons to believe that this is not the case. First, Facebook’s Arabic interface only launched in 2009 and many users may simply not have switched over. Second, virtually all content on the Page is written in Arabic. And third, when Mubarak ordered the Internet in Egypt shut off in January 2011, numbers for both comments and likes dropped dramatically. It is safe to say that this Page really was an Egyptian phenomenon.
Overview of gender and interface language.
Since the API provides lists of users liking or commenting on a post and each user has a unique identifier, we are able to examine the population of users in relation to their activity on their Page. On the most general level, we found that 91.1% of the 1,892,118 active users liked at least one post, whereas 42.9% engaged in commenting. Interestingly, 8.9% commented without liking. Since we can consider commenting to be a more involved gesture than liking, the relatively high prevalence of commenting is a good indicator for users’ strong involvement.
A statistical summary of user reactions around posts.

A statistical summary of user activity.

An overview of the different post types in relation to the likes, comments, and shares they received. Since Facebook’s API only provided a share count for public posts shared more often than ten times, we have greyed out the column to signal the more precarious status of this metric.

Figure 3 shows size–rank distributions for the two subpopulations of likers and commenters, and while we do find the typical long-tail distributions, neither follows a power law.
17
The distribution for liking is certainly somewhat bounded by the fact that users cannot like a post more than once, but commenting follows a similar pattern. As we move up in rank, the number for both comments and likes falls off more slowly than a power law would predict, which indicates that in particular the group of most active users is more “egalitarian” than the many cases found online where power laws do apply. This reinforces the assessment that the Khaled Said Page was dominated by a comparably large group of very active users. An analysis of the activity periods of users could add interesting nuances to this assessment, but is beyond the scope of this paper.
Size–rank plots for the subpopulations of users who liked (n = 1,724,597) and users who commented (n = 810,827).
When looking at the relationship between liking and commenting we find a correlation coefficient of 0.391, which is clearly significant, yet indicates that certain users are more disposed to like and others are more active commenters. Figure 4 shows the relationship graphically. Interestingly, the separation becomes slightly more pronounced (0.378) when looking at the 643,306 users that engaged in both liking and commenting.
Users (n = 1,892,118) and how much they liked and commented; the smoother line is based on a Generalized Additive Model (GAM), provided by R, which shows a slightly more nuanced summary of the relationship between the two variables than the usual least squares method.
Finally, we should not forget that the administrators themselves are part of the Page’s population. And, indeed, because comment users are uniquely identifiable, we found that in addition to the already very high number of posts the Page’s account also contributed 3,421 comments. Since we do not know the identity of all the administrators and our data is anonymized, we cannot say whether they also participated in the discussions with their own user accounts.
The role of post types
A more detailed examination of the administrators’ posts and users’ reactions to them is made possible by Facebook’s built-in classification of post types. When comparing the six types used on the Khalid Said Page, we find a number of significant differences, pointing towards the idea that they indeed played different roles on the Page (see Table 4).
Although share counts need to be considered with prudence, we can observe a clear tendency: photos, a term Facebook uses for any image, have by far the highest share count, which points to the idea that visual content is emotionally rousing and thus particularly “spreadable” (Jenkins et al., 2013). Looking at the actual images, however, suggests a more nuanced interpretation, since the material has clearly been selected for impact. In the earliest period, images showing regime brutality and photos or drawings of Khaled Said dominate. The young man’s face, both before and after his violent death, became a symbol for both the repressive regime and the innocence or innocuousness of its victims. Wael Ghonim, a marketing executive, understood this dynamic very well and, according to his own account, worked strategically to build the Page into a brand (Ghonim, 2012: 112), using images as a key element.
Figure 5 shows posting activity and use of different post types over time. We can clearly see the heavy use of images in the early months, and again in the “hot” phase of the revolution in January 2011, where the administrators post photos not only showing the large-scale street protests, police brutality, and patriotic symbols, but also “average” Egyptians holding up signs in support of the protests.
Both absolute and relative distribution of post types per month.
Status messages, on the other hand, which are often short comments or propositions inviting users to react, have the highest like and comment counts and a much lower share count. The administrators use this post type to “dialogue” with the audience of the Page, either by asking for suggestions and feedback or calling to action. In the revolutionary phase, status items dominate, highlighting the coordination role the Page plays during this time. Interestingly, the phase around the constitutional referendum in March 2011, which is characterized by a more “deliberative” atmosphere, sees a relatively high amount of links, which often point to official documents or contributions to the debate.
While the technical part of our methodology can be easily transposed to other Pages, we caution against fixed interpretations of content types. This is one of the many occasions where quantitative analysis needs to be accompanied by constant qualitative assessment of data items in order to make situated interpretations that consider the particularities of the case.
Temporal analysis of user activity
Another set of techniques allows us to study user activity over time. Here, we investigate the ups and downs of basic elements such as post, like, and comment count, and develop a set of derived metrics that rely on the specifics of Facebook’s API, in particular the ability to distinguish unique users and the timestamps on comments.
Looking at Figure 6, we see that there is a strong connection between posts made by the Page and daily user activity, in particular in the pre-revolutionary phase that lasts roughly until late December 2010. During this period, user activity is almost directly correlated with the Page’s posts frequency. In early January 2011, however, the situation changes dramatically: while post frequency goes down, all other metrics grow very rapidly. Facebook’s architecture suggests an interesting interpretation. When liking a Page, users subscribe to its feed of posts; posting is thus a means for administrators to (potentially) engage users through their News Feed in addition to the Page’s own interface. Posts function as reminders or invitations to participate and increased post frequency heightens the chance that the Page’s contents and concerns will reach users. When user activation on the Khaled Said Page was still low, the administrators served as campaigners, agitators, or even “animators”, like the employees at a holiday resort who appear at your doorstep to invite you to the collective morning run. January 2011, however, marks the beginning of a revolutionary dynamic where the administrators’ role as animators takes a backseat as users reach a level of involvement that no longer requires constant reminding. The administrators continue to fuel the movement, but increasingly serve as “moderators” (van Es et al., 2014) trying to keep the Page inclusive and non-partisan. While we do not have empirical evidence, we can speculate that user engagement moves from the News Feed to the Page itself, as protest planning and coordination become a central issue and users follow the events more directly.
Line graph per day of the number of posts made by the Page, the comments and likes they received as well as the number of new users (users that were not active on the Page before) and unique active users. Because of the large variation between numbers, we use a logarithmic scale. For increased legibility, we use a rolling mean calculation to smooth short-term fluctuation by plotting the moving averages for a 28-day window.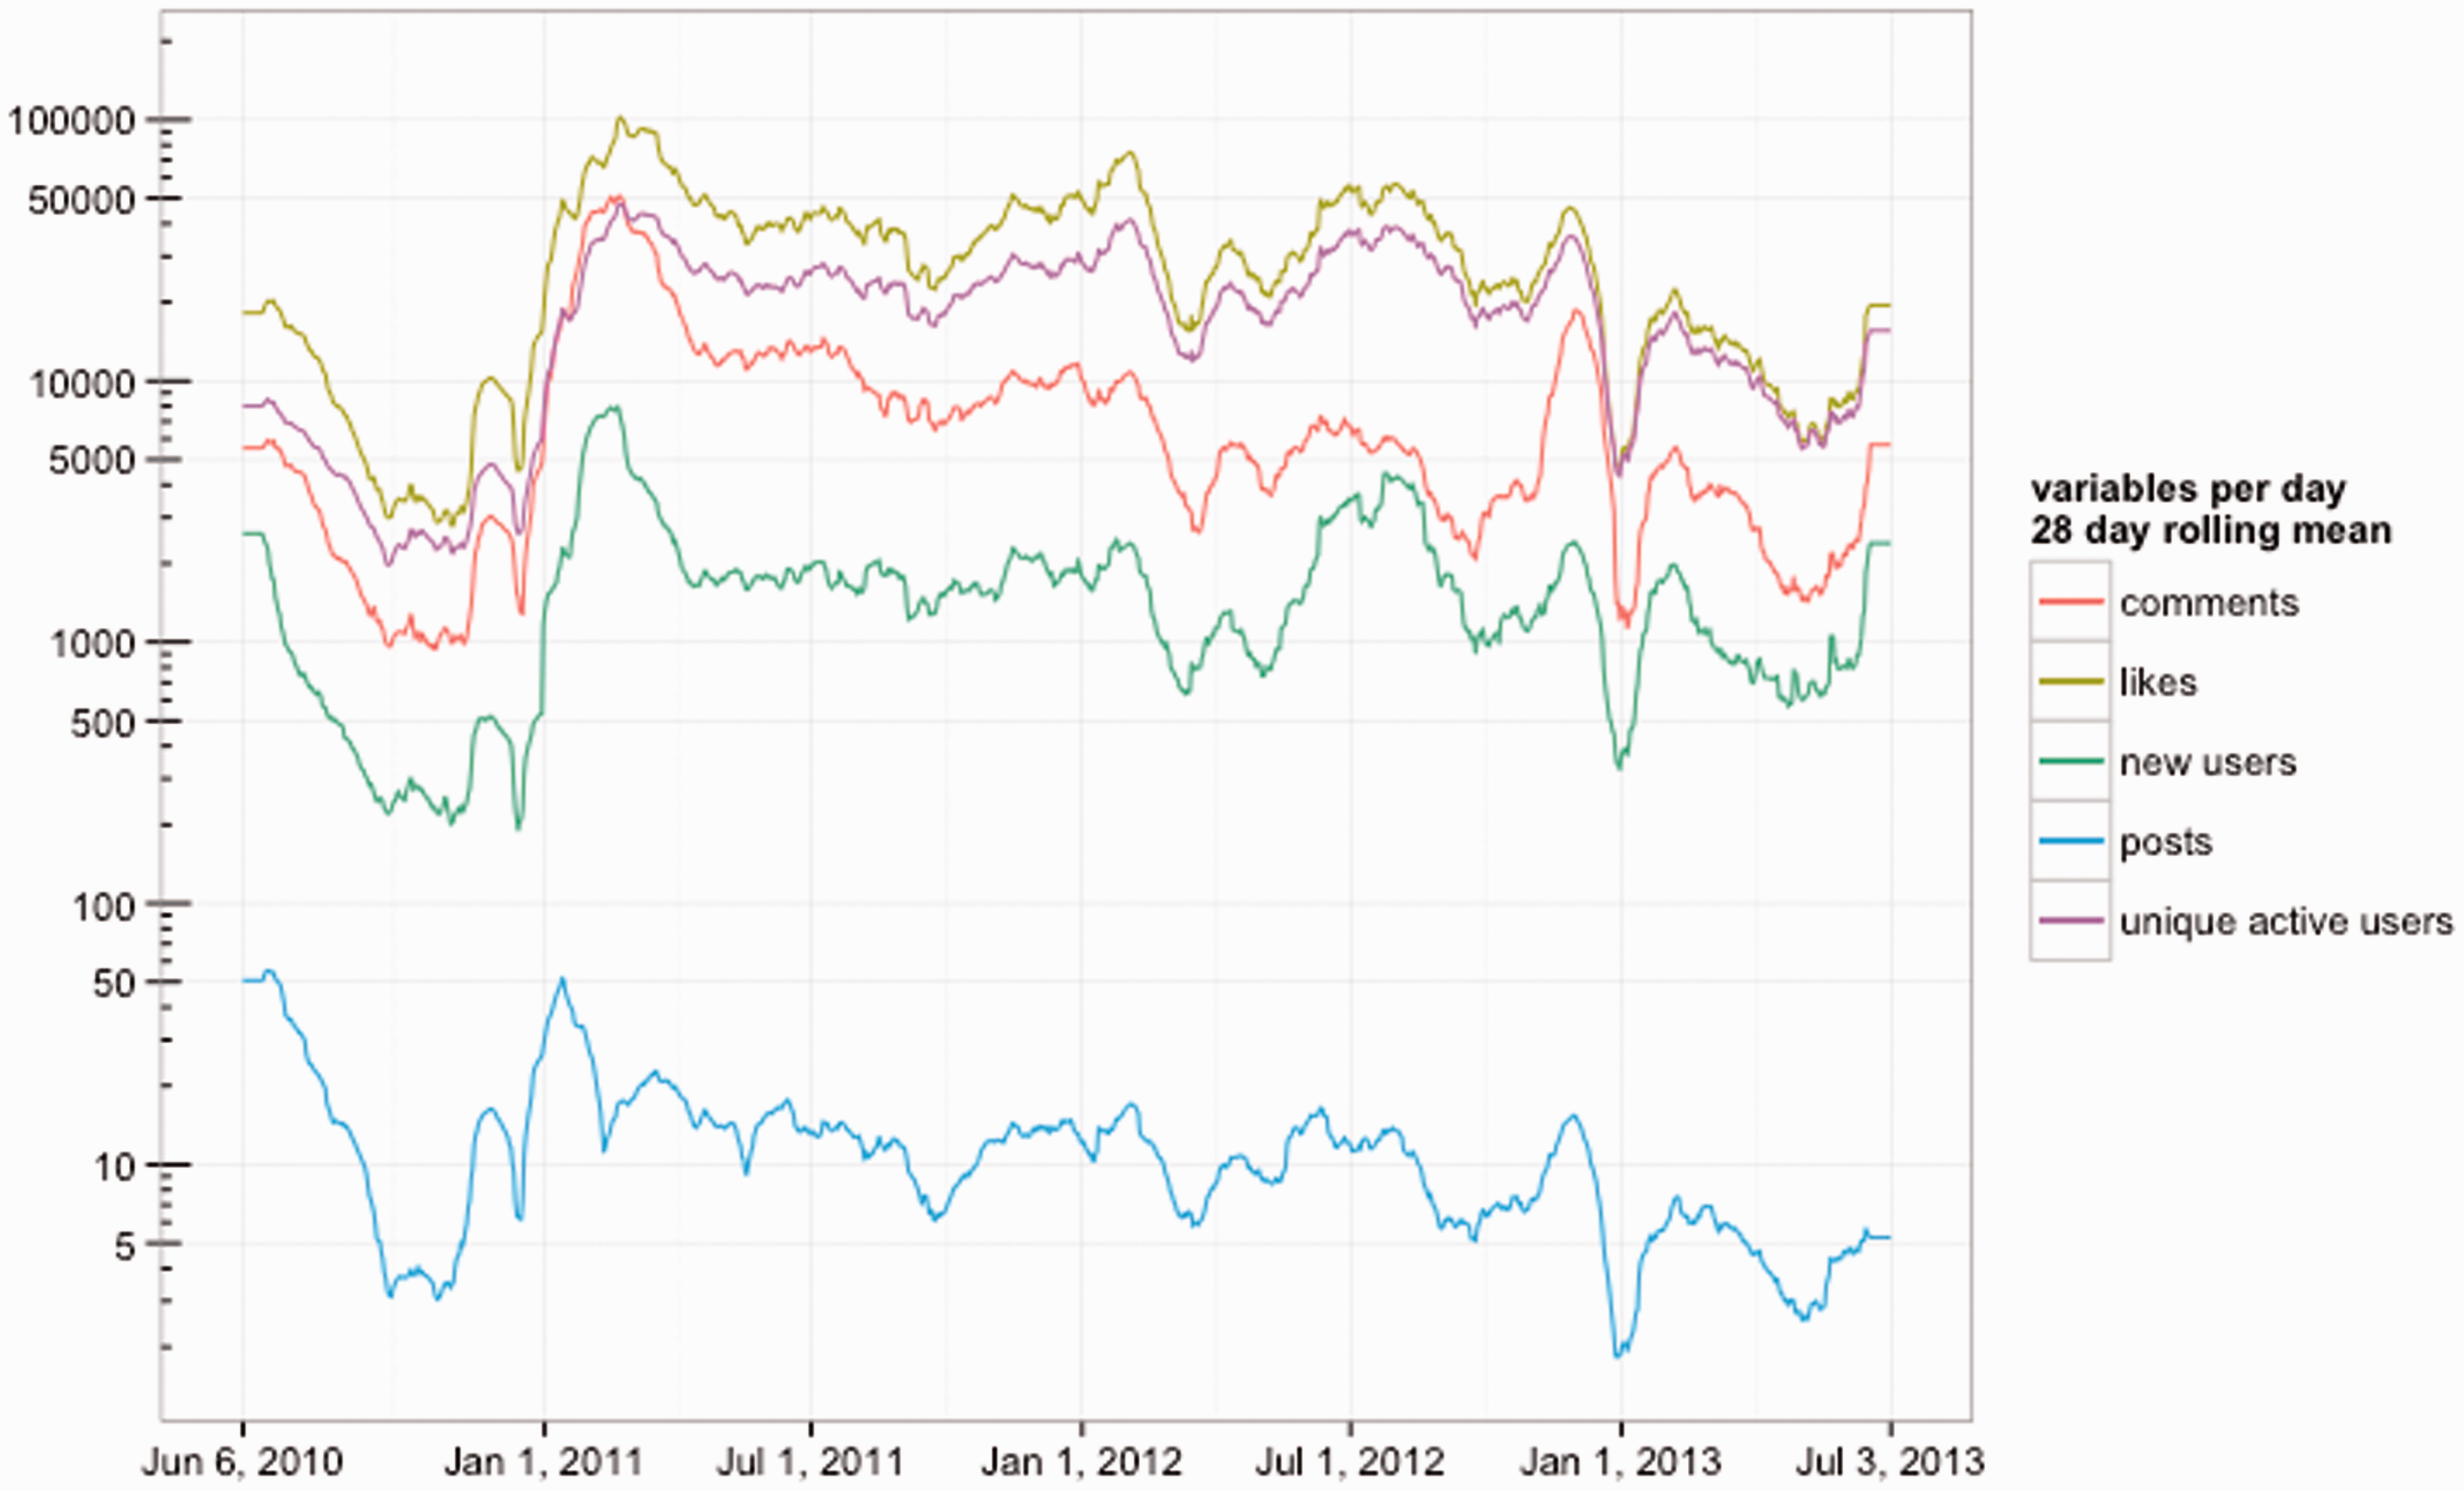
Some nuances become visible when focusing on the shorter period between 15 December 2010 and 1 March 2011, shown in Figure 7. We first notice two dips on days when no single post was made. We do not know why the administrators decided to refrain from posting on 17 December 2010, but the date coincides with the plunge in activity that clearly appears in Figure 6 and separates the flaring-up of protests in Tunisia from the revolutionary period in Egypt. Does this show the administrators hesitating at a moment where the self-immolation of Mohamed Bouazizi in Tunisia (17 December) marks a stark moment of radicalization? The second day without a post, however, can be clearly connected to the arrest of Wael Ghonim (27 January 2011) and the government orchestrated shutdown of various Internet services (25 January–2 February). After that point, the lower post frequency does little to reduce the intense activity on the Page.
Line graph with the same variables as Figure 6, but for a much shorter timespan and without smoothing.
In addition to these basic frequencies, the “new users” metric, which counts first time active users, points toward two interesting points in time. The spike on 14 January 2001, when 17,539 new users appear on the Page in a single day, coincides with the flight of Tunisian President Ben Ali, giving further credence to the idea that the Egyptian revolution was inspired or emboldened by the events in Tunisia. But the highest number of new users comes on 11 February, when 25,941 new users join the celebrations of the “Friday of Departure”, when President Mubarak resigns.
While these metrics already provide an interesting view into the dynamics of the Page, the presence of time-stamps on comments allows for an even deeper view. To investigate variations in the speed of commenting, we decided to plot the percentage of comments that were made in the first hour and day after a post was published.
One could argue that the comment speed variations shown in Figure 8 indicate a changing sense of urgency. The highest peak indeed appears during the “hot” phase of the revolution when 60% of comments are made in the first hour. But we can also observe a close relationship with the Page’s post frequency. Users tend to comment on the latest post and more time between posts generally leads to slower reaction times, for example at end of 2012 when the administrators significantly reduce their output. Outside of the revolutionary phase, some users will continue to comment on older posts, while many others cease their activity as Figure 6 shows. In general, however, commenting is very fast. Considering that the administrators posted, on average, 12.5 posts per day and sometimes over a hundred, it is not surprising that the active life of a post is quite short.
Line graph showing the percentage of comments that were made in either the first hour or first day (24 hours) after the post was made. Lines are smoothed using a 28-day rolling mean.
Since the API makes comments available in full-text, looking at text length is an interesting way to begin distinguishing between different communicative settings, e.g. between more “agitated” or “deliberative” periods.
Looking at the average comment length, shown in Figure 9, we can clearly see a peak around the constitutional referendum held on 19 March 2011. This period is characterized by deliberation and debate concerning Egypt’s political and institutional makeup, with average comment length almost doubling compared to autumn 2010. Comment length is, of course, a very crude variable, but by providing different measures that express different aspects of the length distribution at a given time, the assessment can become more nuanced. Standard deviation, for example, gives us an idea about the dispersion around the mean: a low value indicates that comments are mostly grouped close to the mean, while a high value indicates a combination of shorter and longer messages. However, to truly make sense of comments, additional techniques are required.
Line graph showing the average, standard deviation, median, and 90th percentile for the length of comments on posts; the graph is smoothed with a 28-day rolling mean.
Analyzing comments
With the exception of the disparities mentioned above, Facebook’s API makes all comments on Page posts available and, in contrast to Twitter, without limiting historical access. Whereas one would traditionally create a sample of cases to account for the full population, a situation where n = all not only alleviates certain methodological inconveniences (no confidence intervals!), but also makes it possible to move much more freely between aggregates and individual data points. Instead of inferring the whole from well-chosen parts, we can use views of the whole to select specific cases for more detailed or qualitative forms of analysis. Indeed, for the manual content analysis reported in Poell et al. (2015), we used quantitative indicators to make a selection of posts and comments to translate and analyze. Focusing on the period between 1 January 2011 and 15 February 2011, we selected the three most commented on posts per day and then the ten most liked comments for a subset of these posts.
In addition to qualitative analysis, we built three simple “distant reading” (Moretti, 2013) tools that allowed us to investigate comments more schematically from different perspectives. The main findings are reported in forthcoming publications, but the three approaches are worth mentioning. In order to facilitate fast and interactive exploration of the nearly seven million comments, we developed a tool, shown in Figure 10, that plots the absolute and relative frequencies of the occurrence of specified terms over time. To paint a more accurate picture of how present actors or issues were, we counted the number of comments they appeared in rather than absolute word frequencies. Plotting several queries on a single chart made it easy to compare; and the “widening” of queries through the OR operator (e.g. revolution OR uprising) helped us in dealing with synonyms and language issues.
The interface of our simple text analysis tool, which plots the occurrence of terms over time. The upper line chart shows the absolute number of comments the terms appear in. The area chart below indicates the relative frequency as percentage of comments. Legend: blue, hereditary transmission (of the presidency); red, despotism; orange, corruption; green, torture; purple, unemployment. The tool can show the actual comments for the various terms, providing an easy way to move from the aggregate to individual data points.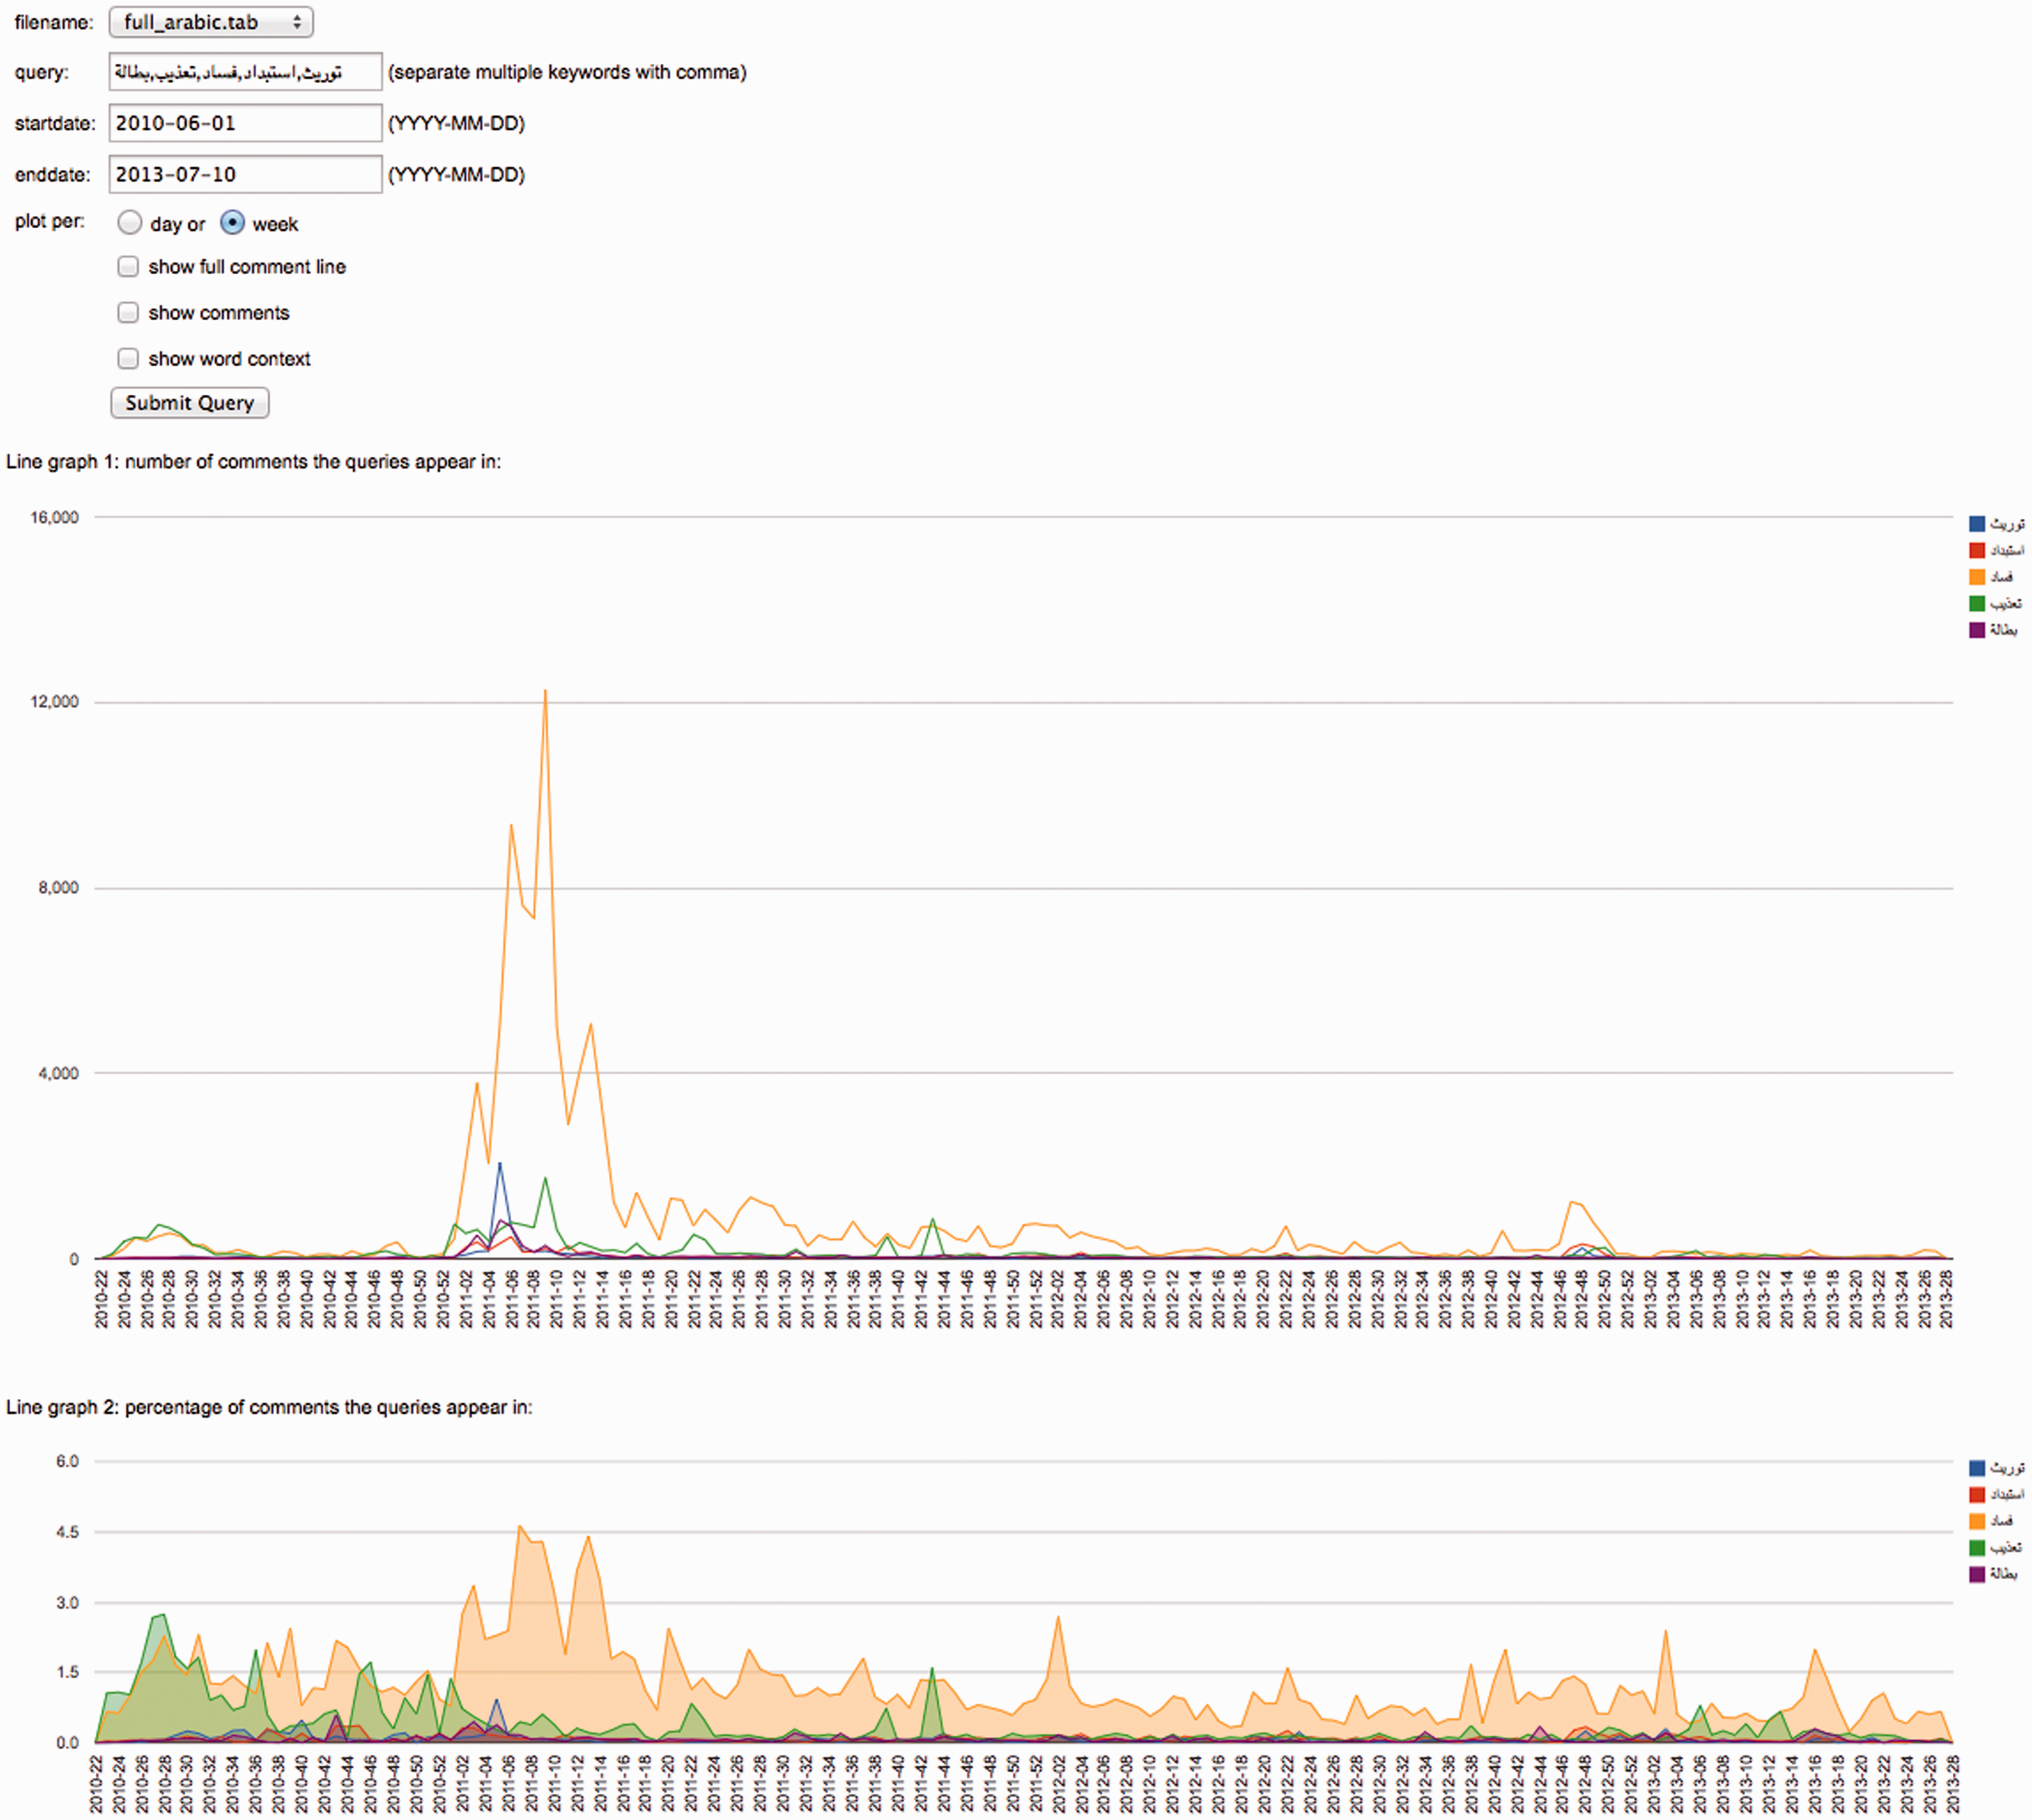
Figure 10 demonstrates that such a simple approach can yield interesting results. One of the questions we brought to the Page was which grievances were addressed and how they changed over time. The screenshot shows that in the initial phase after Khaled Said’s death, torture was the main concern—but as time passed and critique widened, the question of corruption came to dominate. In the revolutionary phase in particular, when protesters demanded President Mubarak’s resignation, and in the months following it, when the country was faced with having to organize the political aftermath, between 2% and 5% of all comments mentioned corruption.
A second tool was built to facilitate the exploration of the comment sections of individual posts. This simple tool produced word clouds, as shown in Figure 11, and was intended as a means to get a quick overview of the issues mentioned, in order to help guide further analytical steps. Outputs were not used as findings in any of the publications coming out of this project, but the tool played a role in mediating our relationship with the dataset, and merits mention as part of the methodological and epistemological infrastructure we were working with.
Word cloud for the over 40,000 messages users wrote on the most commented on post in our dataset.
A third issue we wanted to investigate more thoroughly was comment dynamics. Since Facebook’s comment system did not allow for threaded communication at the time and users rarely mentioned each other, we developed a very basic method to visualize a comment section.
The visualization in Figure 12 follows a simple principle: there are two rows and in both, every one-pixel column represents a comment, starting on the left, moving to the right. In the top row, a black bar signals a comment from a user who is participating for the first time in the thread, a red bar stands for a user that has already commented, and a yellow bar indicates a comment from the Page administrator. While these elements could be easily quantified, the visual inspection allows for the identification of more “dialogical” moments in the conversation, in the absence of a thread structure. The lower bar adds a means to identify repetition, a very common phenomenon on the Khaled Said Page. A bar is red if a near identical comment—calculated via Levenshtein’s (1966) string distance metric
18
—has already been posted. This allows us to identify repetition.
Two-row visualization of user dynamics in the comment section of a post.
Figure 13 clearly shows packets of repeated comments, a common occurrence in our dataset. These can be considered as particular forms of “shouting” and, in some cases, can take the form of hundreds of identical comments in a row. Again, one could simply count repeated comments in a single metric, but closely spaced repetition is an indicator of a different conversational dynamic than more stretched out repetition. Visual representation makes this difference discernible. It is highly doubtful, however, that we can establish strict correspondence between particular patterns and clear types of behavior. The most important function of visualization, here, is the capacity to easily find “abnormal” patterns that can then be examined manually in more detail.
A comment section showing packets of comment repetition.
Conclusions
In this paper, we examined Facebook’s API as a central link in the methodological chain of data-driven empirical research, mediating between a technical platform and our desire to understand. Instead of subscribing to the habitual separation between critical conceptual and applied empirical work, we combined data critique and data analysis to demonstrate that computational social media analysis—and Big Data research in general—can profit from such a more integrated perspective. Since we now base findings on data gleaned from opaque services via complicated technical interfaces, what we have called technical fieldwork needs to take a more important role in empirical research. Without an involved assessment of data in relation to the platform they pertain to and the means by which they were retrieved, results can be highly problematic. But such an assessment of the technical rules, rituals, idioms, and taboos that characterize platforms and their APIs is impractical without the grounding of a concrete case. We were able to detect and document most of the issues with Facebook’s API because we ran into them. It is highly doubtful that a study of the documentation or even technical probing could have led to comparable findings.
But this investigation should not stop at the level of problems and limitations. What makes APIs important for empirical work is not just the way they jeopardize research, but also how they enable or suggest different directions and methods of analysis. In our analysis of the Khaled Said Page, API data allowed us to highlight and nuance the role of the administrators as connective leaders, to measure the size and composition of the participating audience, to engage in various types of periodization, and to investigate the issues that were raised in the comment sections. These approaches were developed by an iterative articulation between our research interest and the possibilities afforded by the API. This again highlights the benefits of an exploratory approach. Here, the oppositions between micro/macro, qualitative/quantitative, and manual/automated fade, but instead of disappearing altogether, they give way to a back-and-forth between different levels: the macro perspective helps in deciding where to dig deeper and provides context; the micro perspective delivers clues and rich resources for the interpretation of larger trends or deviations. But the cycles of iteration also facilitate the coordination between the technicity of platform and API on the one side and the empirical case on the other. We are still far away from a stable and standardized relationship between the two that would allow us to easily ignore the former when analyzing the latter. This is indeed the main reason why we presented and discussed analytical opportunities in close relationship with an empirical case and not as a set of abstract techniques. While the technical part of the analysis can be easily transferred, interpretation is deeply caught up in the particularities of local settings and the massive amounts of data available do not change this in any way.
Looking back at the various difficulties, changes, and obscurities we had to deal with leads us to an ambivalent assessment of social media analysis through APIs, since researchers are put into a position where the promise of high-volume and high-quality data is contradicted by a strongly asymmetric relationship with the platform provider, who shapes informational structures, defines policy, and imposes ever evolving logistics. For this to remain a viable avenue for research, we need more than continuous technical fieldwork. A sustainable setting that keeps our understanding of social media practices from slipping into the obscurity of in-house research will have to include legal expressions of the public’s legitimate interest to know what goes on in these huge sociotechnical structures. Without an equivalent of fair use principles or similar provisions, social media analysis risks becoming impossible for researchers that operate independently from commercial interests, because the work we have outlined in this paper may simply become too burdensome. Only a system of research rights vis-à-vis online platforms can assure that the production and dissemination of knowledge concerning the activities of billions of users does not become privatized entirely.
Footnotes
Declaration of conflicting interests
The author(s) declared no potential conflicts of interest with respect to the research, authorship, and/or publication of this article.
Funding
The author(s) received no financial support for the research, authorship, and/or publication of this article.