
Abstract
The automated parsing of 130,213 news articles about the 2012 US presidential elections produces a network formed by the key political actors and issues, which were linked by relations of support and opposition. The nodes are formed by noun phrases and links by verbs, directly expressing the action of one node upon the other. This network is studied by applying insights from several theories and techniques, and by combining existing tools in an innovative way, including: graph partitioning, centrality, assortativity, hierarchy and structural balance. The analysis yields various patterns. First, we observe that the fundamental split between the Republican and Democrat camps can be easily detected by network partitioning, which provides a strong validation check of the approach adopted, as well as a sound way to assign actors and topics to one of the two camps. Second, we identify the most central nodes of the political camps. We also learnt that Clinton played a more central role than Biden in the Democrat camp; the overall campaign was much focused on economy and rights; the Republican Party (Grand Old Party or GOP) is the most divisive subject in the campaign, and is portrayed more negatively than the Democrats; and, overall, the media reported positive statements more frequently for the Democrats than the Republicans. This is the first study in which political positions are automatically extracted and derived from a very large corpus of online news, generating a network that goes well beyond traditional word-association networks by means of richer linguistic analysis of texts.
Keywords
Introduction
In all mature democracies, political elections are the arena of enormous mobilisation of material and symbolic resources, where the mobilisation of symbolic resources is defined as the strategic use of words, images and concepts to either persuade or influence public opinion. The American presidential elections are among the most interesting campaigns because of the sheer amount of resources deployed and the influence of the United States on global governance.
This study presents a large-scale analysis of mass media coverage of the 2012 US presidential elections, combining automatic corpus linguistics methods and network analysis to obtain a network representation of the entire campaign coverage by the news media. Mapping the full extent to which an electoral campaign is represented by media offline and online constitutes a very difficult challenge for researchers, given the large amount of data and the multitude of sources available in advanced democracies. In addition, whenever the full coverage has been analysed, the core method used so far has been traditional content analysis (in either the automatic or manual coding variant), which allows us to identify the most salient issues in each candidate’s campaign (e.g. Conway et al., 2012).
The traditional lines of investigation of the social sciences, such as the ideological position of candidates, their political communication strategy and the social representations (Moscovici and Duveen, 2000) of the election in the media remain salient, but require new conceptual and methodological approaches. We propose a Big Data approach, based on automated information extraction.
Our study is based on the automated analysis of 130,213 news articles related to the US presidential elections from 719 news outlets, based on state-of-the-art Natural Language Processing (NLP) and Artificial Intelligence (AI) techniques, to extract information about the key actors and their relations in the media narrative of the US elections. These relations are in the form of subject-verb-object (SVO) triplets extracted by a parser, and are organised as a network, or semantic graph, which can then be analysed with mathematical tools. This approach goes well beyond traditional word-association networks, producing not only directed links, but links whose semantic nature is retained and understood. Much of the following analysis would not be possible without these features, which ultimately resulted from the use of a parser to identify noun phrases and verbs to form SVO triplets. An example of one such triplet is ‘Obama criticised Romney’.
This article is divided into different sections: first, we discuss the theoretical framework that informed our study, stating the importance of applying a semantic graph approach to texts; second, we outline the novel methodology employed to automate the analysis of news media content. Third, we present our findings; last, we conclude by reflecting on both theoretical and methodological aspects of studying the network of actors and actions.
Big Data analysis of news coverage
In this study, we analyse texts by an automatic identification of ‘semantic triplets’, formed by key actors, objects and their relationships. In particular, we consider SVO triplets, following the approach developed by Quantitative Narrative Analysis or QNA (Earl et al., 2004; Franzosi, 1987). The core idea of QNA is that SVO triplets form the fundamental units of narration. Our methodological contribution to that literature has been to automate the extraction of triplets, by identifying subjects and objects with noun phrases and using a parser. The set of triplets obtained is naturally organised into a network, which we call a ‘semantic graph’. The semantic graph encodes the relations among all actors in the corpus. Note that sometimes the expression ‘semantic graph’ is used to indicate networks formed by linking co-occurring words, which is a purely statistical approach that makes no use of more detailed linguistic information. Instead, our process of automatically extracting the SVO triplets from the corpus is based on the use of a syntactical parser, and is described in detail in the Appendix.
In the context of a news corpus about a political election, we introduce a slightly different interpretation of SVO triplets based on the observation that candidates define their political positioning through a set of claims or actions through which they either endorse or oppose issues and actors. This interpretation will be discussed in the next section. In this sense, SVO triplets can be used as a source of political positioning information. Extracting triplets and adding them in two coherent semantic graphs provides a map of the candidates’ strategic positioning across a wide range of issues. Manually generated semantic graphs have been applied in several different collections of texts. For example, Moretti (2013) decomposed novels into network structures in which actors are linked by verbs. In this approach, the properties of a text can be revealed by the structural and topological features of the novel network. Similarly, Mac Carron and Kenna (2012) analysed three classical mythological narratives comparing the topological properties of their corresponding narrative networks.
All these studies were necessarily limited in size for being reliant on manual coding. However, some progress has recently been made in the automatic creation of networks, the closest approach to ours being Diesner et al. (2012) where statistical co-occurrence of named entities is used to form networks. Also in this case, however, the semantics of the link in the network is only provided by statistical co-occurrence between words and not by linguistic analysis.
Compared to these previous studies, we introduce several methodological innovations that are characteristic of a beneficial Big Data approach. This is a crucial point: we not only ‘went big’ by increasing the ‘resolution’ of the data collected but this is also the first time such methodology has been applied on a Big Data scale, by making use of syntactical parsers and a fully automated text analysis pipeline. We have increased the quality and resolution of the data obtained by automatic extraction because this method goes well beyond the traditional creation of networks based on word co-occurrences. We have retained semantic information by extracting SVO triplets and classifying relationships in a signed network. It is the first time that noun phrases are used rather than words. Our automated infrastructure produced the network of actors and their relations without human intervention, starting from the corpus of 130,213 articles that we have collected.
The mass media representation of the campaign is decomposed into a signed network structure that reveals relationships between the main actors – e.g. Obama and Romney and the other objects (e.g. the economy, Iraq, etc.). Besides analysing the overall campaign network, we also extract the networks of each of the candidates. The relationships between Obama and Romney and other objects constitute their networks of claims; the sign (positive or negative) of the edge indicates the nature of the relationship.
Ideographs, rhetorical space and issues ownership
In the public sphere (Habermas et al., 1974), there are competing definitions of public issues, within what is a complex game played for semantic control (Gaskell et al., 1998). This is particularly evident during the context of political elections. Candidates define their political positioning through a complex set of claims through which they either endorse or oppose issues and actors (both individuals and/or institutions). To identify and map this multifaceted ideological and political representative space, we start from the notion of ‘ideographs’ introduced by rhetorical theorists (McGee, 1980). Ideographs are ideological stances, expressed in a few words, which define an actor’s political identity. They are the basic structural elements, or building blocks, of ideology. Thus, they may be thought of as ‘ideographs’ for, like Chinese symbols, they signify and contain a unique ideological commitment.
Interestingly, this observation complements the approach commonly taken in QNA, where the emphasis is on detecting ‘who did what to whom’: here, by viewing actions (and claims) as position statements, we can identify SVO triplets with political positioning claims (where we only consider triplets linked by a verb that expresses support or opposition for the object), and provide a rigorous and effective representation of the rhetorical and political space in which the candidates’ positioning takes place – this is achieved by embedding the resulting network of triplets into a space as shown in the ‘Network partitioning and embedding’ section.
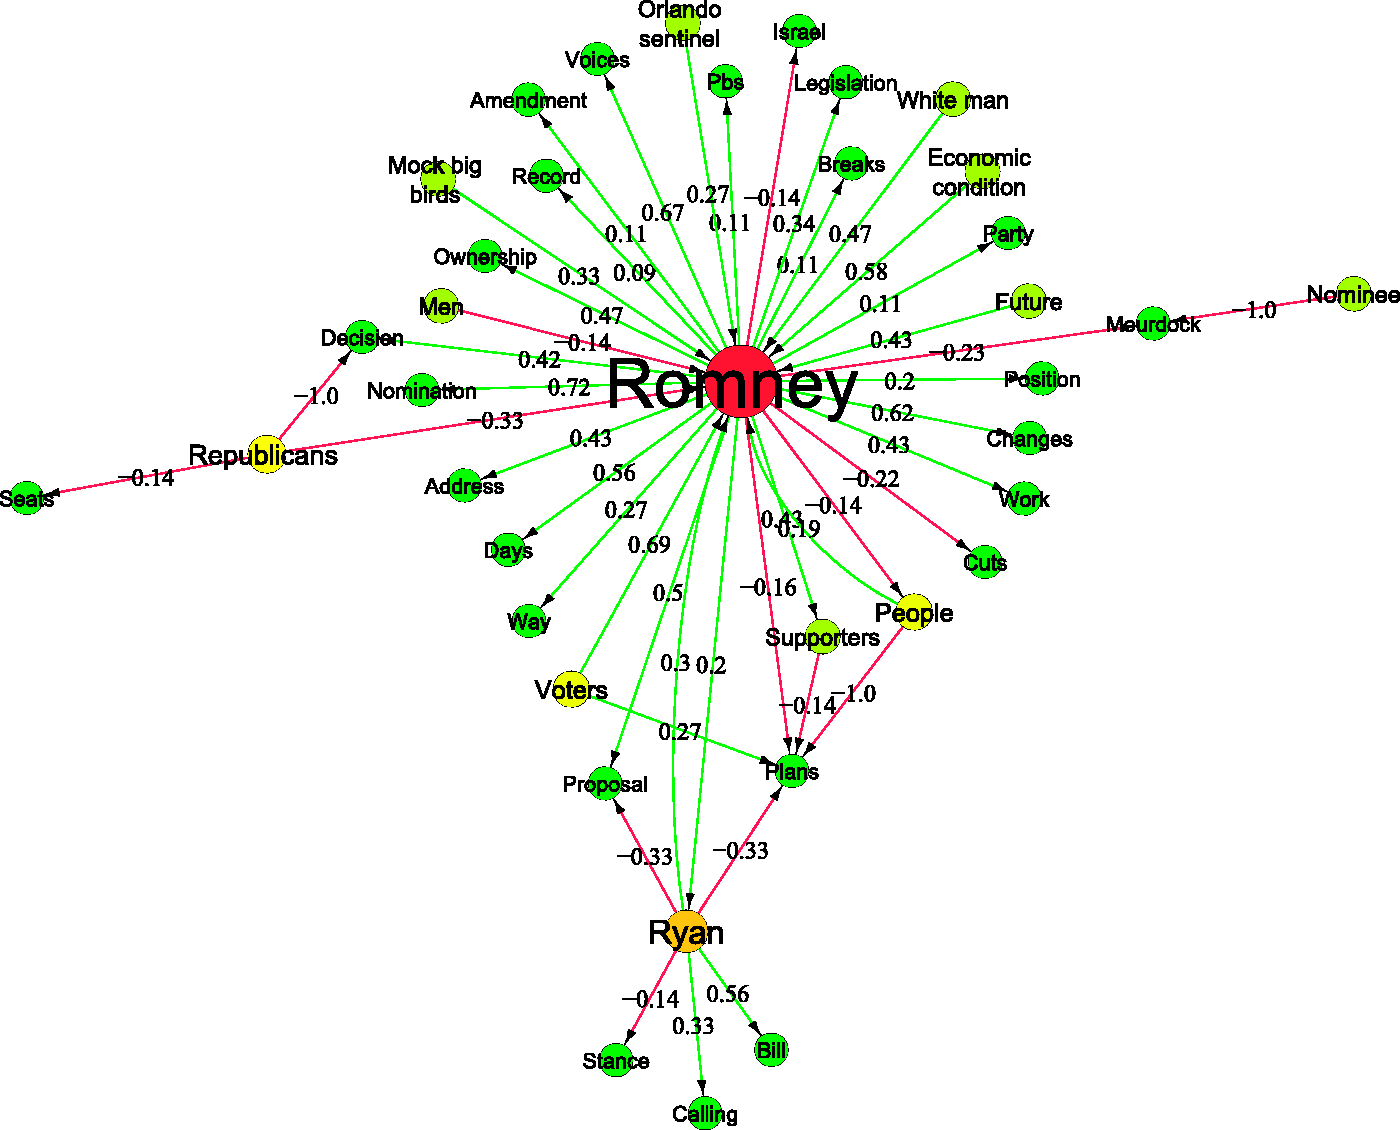
As part of our approach, we can also create graphical descriptions of the overall positioning of an actor, by operationalising and expanding McGee’s notion of ideograph into a network perspective to include any graphs encoding all positive and negative statements made by actors towards objects (i.e. other actors or political issues). In this context, it is an important observation that the decomposition of the network of triplets leads to a meaningful distinction of two sub-networks roughly corresponding to the ‘Democratic Party’ and ‘Republican Party’ (Grand Old Party (GOP)) semantic fields (see Figure 4). The embedding of the network into a space can also be used to visualise the political space in which positioning takes place (see Figure 5). Subsets of the triplets centered on a specific candidate can also be used to create candidate-specific ‘ideographs’, summarising the political position of an actor (as further demonstrated in the Appendix).
The second important point is that our network is constructed out of media reporting rather than from direct quotations from candidates. In that respect, we present how the online news ‘mediascape’ has represented the positioning of Obama and Romney regarding all issues that were deemed newsworthy.
The ideographs constructed on endorsement and opposition claims can reveal if ‘issue ownership’ occurs. The theory of issue ownership rests on the proposition that due to long-standing party reputations, candidates are more likely to be perceived as having credibility over certain issues ‘owned’ by their party (Campbell et al., 1966; Hamill et al., 1985). For instance, voters see Republicans as being better able to handle foreign policy and government management issues, while the Democrats are perceived as more adept on civil rights and social welfare issues. Prior research suggests that these partisan issue associations are consistent and well defined (e.g. Hayes, 2008; Petrocik, 1996). However, candidates do occasionally venture into ‘enemy territory’. Specifically, Downs (1957) argues that to appeal to the largest segment of voters, candidates in a two-party system should cast some policies into the other’s territory in order to convince voters that their net position is closer to them. Thus, instances of issue trespassing should be expected as a function of normal campaign strategy (Hayes, 2008). The construction of a semantic graph, as previously described, which represents the campaign and the two candidates’ issue networks, has the additional benefit of allowing the identification of issue trespassing.
In this study, we formulate a number of typical research questions from a social scientific perspective within the context of our network approach to text and media data. The questions that inform this study are:
How did the media ‘as a whole’ report and represent the campaign and the political positions of Obama and Romney? How are the candidates positioned in a political space by their actions of support and opposition? What do the semantic signed graphs of the two candidates reveal to us about their communication strategies and positioning? What can the structure of an election’s semantic graph reveal to us, both in general and in this particular instance?
Topological properties of a semantic graph
The set of SVO triplets that we have extracted from the news corpus can best be analysed when linked together to form a network, which we call a ‘semantic graph’. Graph partitioning methods can be deployed to embed actors in a political space based on their relations with other actors. The methodology is described in Appendix A8. It is a remarkable observation that the key political fault-lines are readily detected by this approach.
We analyse other global properties, such as structural balance, assortativity and hierarchy, as well as the centrality of nodes. The former provide insights about the structural features of semantic graphs. The latter reveal the roles played in the election by specific actors or issues in the political ‘fields’.
There are a number of well-known measures of centrality of nodes in a network including: betweenness centrality, closeness centrality, out-degree, in-degree, pagerank, hubs and authorities. We select some of these in order to capture certain aspects of narrative centrality. Different measures of centralities help us in identifying nodes and their roles in the candidates’ semantic graphs. For example, degree centrality reveals the most salient issues or actors; betweenness centrality identifies issues or actors that have a bridging function between clusters of issues/actors; and in-closeness centrality helps us identify the nodes that act as ‘contextualisers’. We will discuss the interpretation of centralities in further detail in the section entitled ‘Detecting the central actors in the semantic graphs’.
Methodology and data
Our software pipeline (Sudhahar et al., 2013) detects election-related articles in large corpora, parses them, extracts SVO triplets, and identifies key actors, objects and actions. The triplets are then used to form a network and the network is analysed. A detailed description of the pipeline architecture is available in Appendix A5. The two guiding principles were for us to be able to re-use existing tools where possible, and to build a system that can be scaled up to large corpora. The overall methodology represents an innovative combination of existing techniques and tools applied to a novel research aim that extracts meaningful networks out of large textual datasets.
Dataset
The dataset used for this study is obtained using our infrastructure, which is a media monitoring system (Flaounas et al., 2011) that gathers and analyses news items from the web from a large number of news outlets. English-language news articles related to the 2012 US elections were identified using an automatic text classifier. The classifier was a support vector machine (Cristianini and Shawe-Taylor, 2000) trained and validated using the election news feed from Yahoo!, where it achieved 83.46% precision (correct classification) and 73.29% recall. The dataset comprises 490 US and international media outlets in English for a total of 81,023 articles during the primaries (1 January 2012 to 1 August 2012); and 444 US and international media outlets in English for a total of 49,190 articles during the election (1 August 2012 to 1 November 2012). In total, 130,213 articles were analysed from January to November 2012 using the SVO triplets method.
Figure 1(a) shows the types of outlets and the number of outlets in each type that were captured in our analysis. The types of news outlets captured were newspapers, broadcast media, blogs and online media and magazines. Figure 1(b) shows the number of articles collected from January to November by the 2012 Elections tagger.
Plot (a) shows the number of outlets covered in each type during the 2012 election primaries and main elections. Plot (b) shows the number of articles collected from January to November.
The plot shows peaks of media attention for the elections in January (during the Republican victory in the primary contests in Iowa), September (during the Democrat conventions), October (during the presidential debates) and November (during the election day and Obama’s victory).
Filtering of relevant and reliable entities, actions and triplets
As each step of our pipeline may be subject to error, we rely on the large amount of data we collect in order to maintain a clean dataset and correct classification/extraction. This is done by filtering away uncertain results at various stages of processing and introducing the need to quantify the reliability and relevance of a triplet, as well as that of the entities and their actions. Appendix A4 discusses in detail how this step is performed.
Positive and negative relations between entities
An important part of our study is that the verbs linking entities are classified into those that show a positive or a negative attitude (the remaining triplets are removed as they are not relevant for our goal of detecting political positions). So once we have identified a set of reliable triplets, we can also assign a weight that quantifies the relation of support or opposition between these two entities. These claims or actions can then be interpreted as ‘positioning statements’ and be used to define the political position of the actors involved.
We do this by assembling two lists of verbs, one signalling actions compatible with a positive attitude and the other signalling a negative attitude. Verb lists denoting political support/opposition are manually created by going through actions in triplets that were extracted from the elections corpus. Synonyms of these verbs were then added to the lists using an online thesaurus dictionary. Using the verb lists we could count a triplet as a vote in favour of a positive or negative attitude, and calculate a weight for each of the two possible relations. The verb lists are available in Appendix A9.
In order to define the extent to which one actor a supports/opposes an object or another actor b, we need to combine the number of positive and negative statements observed in the data connecting node a to node b. We model this as the probability of observing a positive or a negative verb, when a is seen as acting on b, therefore reducing this to the estimation of a Bernoulli random variable. Bearing in mind the uncertainty introduced by using finite (and possibly small) samples of observations, we consider also the confidence of our estimation of the parameter of the Bernoulli distribution associated to each oriented pair of actors (a,b). This is done by using the Wilson score coefficient, a standard approach in statistics, as described in Appendix A2.
Once the entities and their relations are quantified with the above methods we assemble them in a network in which nodes represent entities/objects and edges represent positive/negative weights.
Results and discussion: Analysis of networks
At the end of the software pipeline described above, we have obtained 295,164 distinct triplets formed by 41,739 distinct actors and 3677 distinct verbs. After filtering the actors and the triplets to identify the most relevant and reliable ones, we are left with only 2275 distinct triplets (of course, observed multiple times) and we kept only the 406 most significant actors and 609 (positive and negative) links.
The most reliable actors or links are obtained by comparing their relative frequency in a topic-specific corpus with that of a separate, static background corpus or by their absolute number of mentions in the text (explained in Appendix A4). However, this measure of relevance is not appropriate in all domains. When key entities in the topic-specific corpus are also very widely used in the background corpus, the relevance weighting will fail to give greater weighting to the most important entities. In this case, key entities can be identified by their absolute number of mentions in the text as we do for this study. Therefore, we use the top 100 most frequent entities in the 2012 elections corpus as key entities. Triplets containing these key entities are considered reliable if they have been seen in more than k independent documents. The decision on k is explained in Appendix A6. Finally, triplets containing these key entities are used to create the network and this network contained the most significant actors and links.
Figures 2 and 3 illustrate the complete signed and directed networks obtained from our pipeline during the primaries phase (January to August) and the main elections phase (August to November) in 2012. The nodes in the network represent key entities and edges represent positive/negative weights. The green/red colour on the edges indicates positive/negative relations and the size of the node represents the degree of the node.
Network with positive and negative edges between entities (US presidential election data: Primaries 2012). Network with positive and negative edges between entities (US presidential election data: After conventions 2012).

During the primaries we can see many hubs showing different campaigns taking place within the Republican camp (‘Romney’, ‘Santorum’, ‘Gingrich’, ‘Perry’, ‘Cain’) besides the Obama campaign, while after the conventions we see only the two huge campaigns by ‘Obama’ and ‘Romney’, who were the dominant players.
Network partitioning and embedding
As discussed above, candidates define their political positioning through a complex set of claims through which they either endorse or oppose issues and actors, which are captured in the network. Their positioning takes place in the public sphere and is reported by the media. We use this reported ‘political space’ to map such positioning, and the main challenge is whether we can gain insights about this ‘space’ from the network of triplets.
A first analysis that can be performed on the network is its partitioning by means of spectral decomposition (see Appendix A8), which also has the effect of assigning each node a ‘degree of membership’ to one of the two partitions. The results show that the two candidates and the two parties are naturally separated by this method, a finding that provides a powerful sanity check for the entire pipeline, as well as providing an embedding of actors into a ‘political space’ where proximity is correlated to the amount of support (directly and indirectly) linking them (Figures 4 and 5). This also allows us to assign topics to one of the two camps: for example, ‘Israel’ was portrayed as being closer to the Republican camp in 2012, while ‘Abortion’ was closer to the Democratic camp. The sub-networks resulting from the partition are shown in Figures 6 and 7.
A subset of the election network, coloured by partitioning it via the first eigenvalue of the symmetrised adjacency matrix (see Appendix A8). Note that the split captures well the expected distinction between the Republican (red) and Democratic (blue) camps. The orange and green links show negative and positive relations between entities. The embedding of actors in the political space generated by the network of statements. Obama's network after the conventions. Dark colours on nodes indicate high degree and light colours indicate low degree. Romney’s network after the conventions. Dark colours on nodes indicate high degree and light colours indicate low degree.


Assortativity, hierarchy and structural balance
The next step is to analyse the overall topological properties of the entire network. Assortativity refers to a preference for a network's nodes to attach to others that are in some way similar. Though the specific measure of similarity may vary, network theorists often examine assortativity in terms of a node's degree. Correlations between nodes of similar degree are often found in the mixing patterns of many observable networks. For instance, in social networks, highly connected nodes tend to be connected with other high degree nodes. On the other hand, technological and biological networks typically show disassortative mixing, or dissortativity, as high-degree nodes tend to attach to low-degree nodes. We measured assortativity and hierarchy, finding that the network is not assortative but hierarchical. The interpretation of such structural features is open because there are no clear pre-existing studies about semantic networks and their assortative mixing. We further develop this point in the discussion, while the technical steps carried out in our testing are reported in the Appendix.
We also analysed the structural balance of the network (Cartwright and Harary, 1956; Davis, 1967). This notion (defined in more detail in the Appendix) attempts to capture the natural property of networks expressing the attitude (positive or negative) among nodes: reciprocity (if A likes B then B should like A) and transitivity (if A likes B, and if B likes C, we would expect that A likes C).
The results show that while at the level of dyads (pairs of nodes) there is strong balance (or reciprocity), at the level of triads (three nodes) there is significant imbalance. One of the main reasons for this is the presence of many triads where the two candidates profess to support the same issue, while still remaining critical of each other (the technical Appendix reports on the detailed definitions, findings and statistical tests associated with structural balance).
Detecting the central actors in the semantic graphs
The next step is to analyse each of the two candidates’ networks. One of the most important questions is the identification of the ‘central’ issues or actors in each political camp during the campaign as reported by the media data that we have collected. Given the complete network of all actors and their relations, we explored various measures to quantify the centrality of actors.
The transposing and interpreting of centrality measures into semantic graphs is still a work in progress and there is no completely validated way of doing this. This is particularly true in our case, in which we go beyond the use of simple co-occurrences to generate the links between nodes. We selected a number of centralities that have been used before in the context of semantic graphs (Doerfel, 1998; Kim, 2011; Yuan et al., 2013). We used the degree of a node as the basic measure of prominence, as it indicates the number of other actors or issues a given actor directly interacts with (Freeman, 1979). This often – but not necessarily – correlates with the frequency with which the actor is mentioned in the corpus.
Because we have a directed network, we can compute the in-closeness centrality of nodes (Carrington et al., 2005), which measures the degree to which a node can be easily reached ‘from’ other nodes (i.e. using edges coming in towards the node) where ‘easily’ means the shortest distance. In a semantic graph, a node with a high in-closeness positions itself closest to the centre of reference playing a ‘connotative’ role or, in other words, a ‘qualifier’ or ‘contextualiser’. Betweenness has been measured to identify those nodes that are crucial in holding together the network and connecting different clusters of issues or actors (the nodes with high betweenness centrality are translated as active mediators in the communication).
Last, we used the notion of hubs and authorities: a high authority actor receives links from many good hubs (highly connected actors). In the context of our network, we interpret authority as a proxy for an agenda-setting item in both active and passive terms 1 (further technical details are available in the Appendix).
We can also apply the tools described above to analyse the two sub-networks obtained by partitioning the overall election network (see Appendix for the partitioning method). The detailed results of that analysis are presented in the Appendix A10, but the main findings are as follows.
Democratic camp
The highest degree objects in the Democratic campaign are: Obama, President, Clinton, Americans, Economy and Campaign. This indicates that the economy was the most salient issue upon which the campaign focused, with the discussion of a ‘Plan’ to recover the US economy. The objects with the highest betweenness centralities in the Democratic network were: Obama, President, Campaign, Clinton, Americans, Biden and Speech, showing how these entities were the bridges linking the otherwise separate aspects of the electoral narrative. The objects with the highest in-closeness centrality in Obama’s network include: ‘Campaign’, ‘Law’, ‘Redistribution’, ‘Pledge’, ‘Ads’, ‘Overhaul’, ‘Biden’, ‘Investments’, etc. These objects are a mixture of policy and economic tools (law, redistribution, overhaul of a policy, investments) and contexts (Campaign, Ads, Pledge). Objects with high authority can help us to define the agenda-setting efforts of each of the two parties. In the Democratic network, we can find: Obama/President, Economy, Plan, Rights, Proposals, Efforts, Biden/Vice-President, Speech, Remarks, Election, Policies and Campaign. Besides the expected presence of Obama and Biden, the other objects are indicative of a campaign strongly focused on the economy and on actions and tools (plan, proposals, efforts, policies) combined with an emphasis on rights. In the above discussion about issue ownership during US presidential campaigns, the latter topic has traditionally been a Democrat theme. It appears that the 2012 campaign was very much focused on the ‘Economy’ and ‘Rights’ for the Democrats – the agenda-setting effort was directed towards these two issues.
Republican camp
The top two objects in terms of degree centrality in the Republican network are Mitt Romney and Paul Ryan, followed by two nouns: People and Plans, which refer to the Republican initiative of prescriptions for the US economy. In the case of the Republican network, the objects with high betweenness centralities are all actors: ‘Romney’, ‘Ryan’, ‘People’ and ‘Republicans’. It was also the case for the Democratic network that actors were the most bridging objects. However, it appears that for the Republican network there are the two candidates – Romney and Ryan – and then the ‘People’ or the Republican Party. In the Republican network, we find high in-closeness centrality for objects such as: ‘Amendment’, ‘Work’, ‘Proposal’ and ‘Breaks’. Some of them come from the Republican campaigns but others are forced upon them. The highest object in terms of authority is ‘Romney’. This is followed by ‘Plans’, ‘People’, ‘Decision’ and ‘Proposal’, all of which are keywords of Romney’s campaign and language. However, there are two objects suggestive of a reaction rather than an initiative in terms of agenda setting: ‘Mourdock’, ‘Bill’ and ‘Public Broadcasting’. All three objects are related to attacks from Obama’s campaign (see Appendix). ‘Israel’ is also present among the objects with high authority and refers to Romney’s speech in Israel about US foreign policy in the Middle East. The remaining objects with high authority are what now with hindsight appear to be important issues in the 2012 Republican campaign: tax breaks (Breaks), the amendment to the federal marriage law (Amendment) and the work requirements for welfare benefits (Work).
Positive and negative statements, and divisive issues
Actors can choose to signal their position in the political space by either making negative statements about what they do not stand for, or positive statements about what they do stand for. We have considered how often an actor is reported as making positive or negative statements about another actor or issue. Similarly, we have considered how often an actor is the target of positive or negative statements or actions. In other words, we have measured how often actors position themselves by their opposition to or support for something or someone. We also measured the extent to which an object is ‘divisive’ – in that it attracts very different sets of statements – and therefore how important it is for political positioning by both parties.
The most divisive subjects and objects in the network
Since we have positively and negatively signed networks, it is possible to assess the divisiveness of subjects or objects in the network. This will examine the target or source nodes of diverse sign links (positive and negative) or same sign links (positive or negative) in the network. To identify the most divisive objects, for each node we take into account all the incoming edges and count how many were positive (p) and negative (n). Treating this as a Bernoulli random variable, we use its variance to measure how divisive the object is. More details on this are given in the Appendix A3.
Most divisive subjects and objects.
Positive object ratio analysis of the election network
We experiment with positive object ratios (PORs) for Obama and Romney, which could reveal their campaign representations in the media dataset. We also analyse this for the overall network. The POR for a candidate is computed using equation (1). Po refers to the number of positive statements/expressions made by the candidate about an object and No refers to the number of negative statements/expressions made by the candidate towards the same object. The overall POR is computed by taking into account the total number of positive/negative statements towards an object.

From Figure 8, a number of interesting questions can be answered. For example, was the media reportage of the 2012 electoral campaign biased towards one of the two parties? The overall positive objects ratio plot in Figure 8 provides the answer, albeit within the limitations of the methodology applied in this study. This quantity reflects the number of times an actor has been the object in a SVO triplet with a positive verb. The two objects ‘Democrats’ and ‘Republicans’ are present in different quadrants: the ‘Democrats’ are reported as being (slightly) more often the object of positive statements or actions, while the Republicans are more often the object of negative statements or actions.
Overall positive objects ratio vs. frequency.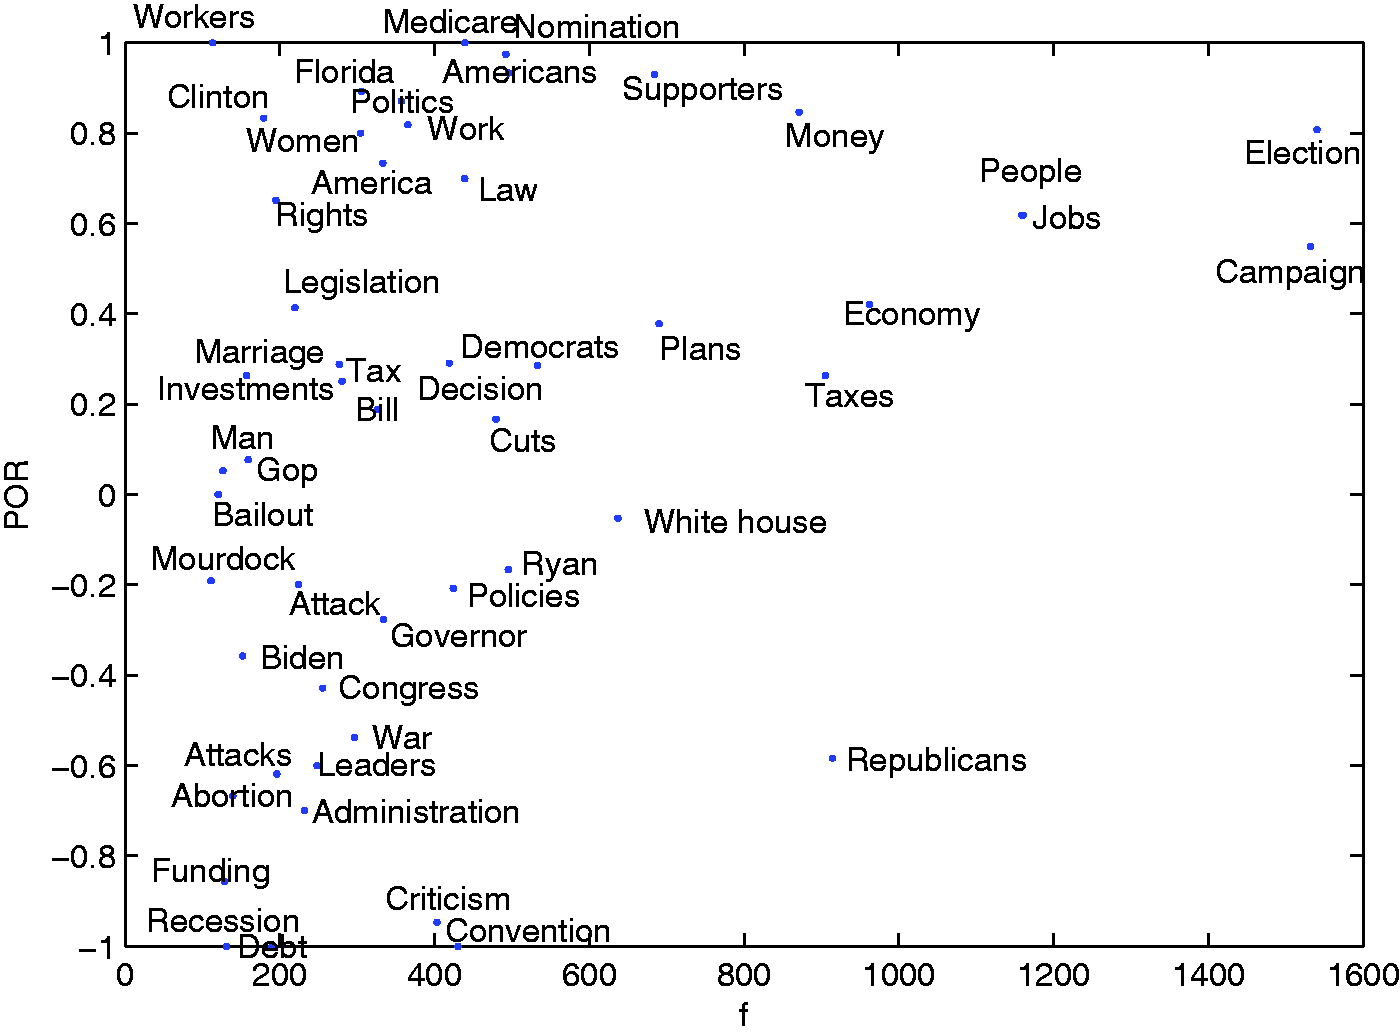
From Figure 8, we also learn that both vice-president candidates, Biden and Ryan, had mildly negative reporting. Above all, the chart confirms the extreme importance played by the status of the US economy as the main issue towards which the campaign gravitated. ‘Economy’, ‘Money’, ‘Jobs’ and ‘Taxes’ are the main focus of the reporting and also of both candidates.
Comparing the two campaigns
Democratic camp
Barack Obama’s ideograph provides us with Figure 9: on the Y axis we have the POR of objects linked to Obama (the weight vector for outgoing links only) and on the X axis their frequency. The two top items that were most positively referred to by Obama are ‘Nomination’ and ‘Supporters’ and this is not particularly surprising. The other objects present in Figure 9 reveal a more interesting picture.
Candidate Obama: overall positive objects ratio vs. frequency.
As discussed previously, issue ownership in US presidential elections traditionally assigns an advantage to the Republican Party in using the economy as a campaign issue (Campbell et al., 1966; Hamill et al., 1985). However, the 2012 elections saw an ‘issue trespassing’ strategy with President Obama taking the initiative on the ‘economy’. This is evident from the fact that objects such as ‘financing’, ‘redistribution’ and ‘investments’ have a high POR.
The other defining issue related to the economy was jobs creation: the object ‘jobs’ has a mildly negative ratio indicating that the media reported Obama outcomes in jobs creation less effectively. Further, two important and defining issues of the campaign, represented in Figure 9, are ‘Rights’ and ‘Law’. ‘Rights’ refer to the legal recognition of same-sex marriage. ‘Law’ also refers to the amendment to the federal marriage law. These issues were important for President Obama but they were also an important focus of Mitt Romney’s representation in the media.
On the negative part of the chart, we found a rather frequent disapproval of ‘plans’. This is due to the topic of the Republican ‘economic plans’. The US economy and economic policy is also highly relevant in the negative part of the chart, with a perhaps obvious negative link to the recession and with the Republican recipe for federal government budget cuts.
Republican camp
The two top positive objects in Romney’s signed network according to Figure 10 are ‘Nomination’ and ‘Supporters’, as is the case for Obama’s signed network. The other very frequent and positive objects are: ‘Work’, ‘Rights’, ‘Legislation’, ‘Ownership’ and ‘Proposal’. ‘Work’ refers to the debate over the work requirements necessary to access welfare benefits: Romney, who strongly supported this measure, accused Obama of wanting to remove such requirements.
‘Changes’ is also a highly positive object linked to Romney in the mass media data. It refers to one of the mottos of Romney’s campaign about changing the current status of the US and trying to re-appropriate the concept of change from Obama that was used as a slogan in his first presidential campaign (‘Change’).
At the opposite end of the chart we find the item most negatively linked to Romney: Taxes. This relationship reflects the great emphasis given by Romney and the Republican Party to tax cuts and breaks as the economic solution to recession, something confirmed by the presence of other relevant objects in Figure 10 (‘Benefits’, ‘Cuts’, etc.).
Candidate Romney: overall positive objects ratio vs. frequency.
Romney is negatively linked to the object ‘Unions’, perhaps unsurprisingly, because of his critical comments about US labour unions and in particular of his opposition to the Employee Free Choice Act. The object ‘Bailout’ refers to Romney’s statements against the car industry federal bailout in Michigan (his home state), which was a major moment during the campaign as his opposition created problems for his own campaign.
The object ‘Amnesty’ refers to the amnesty given to illegal immigrants by the Obama administration. This issue is negative and linked to Romney because his position on this issue was confused during the campaign; from an initial critique he later declared that he would not revoke the amnesty. Media data widely reported his ambivalence on the topic.
Among the non-economic issues, three topics have been identified in the negative quadrant: abortion, the amendment to the marriage law and women. The first two are issues about civil rights and are negatively linked to Romney. The difference between Obama and Romney here is evident: Obama continued the ‘issue ownership’ of the Democrats on rights in addition to his personal history while Romney re-affirmed traditional Republican positions on abortion and marriage.
Conclusions
Analysing the media coverage of the US election using our Big Data approach revealed the strategic positioning of actors around issues in the ‘mediascape’ of online English language news. We used a semantic graph obtained by parsing the text, identifying the noun phrases and the verbs and linking them and used SVO triplets as building blocks for a network. This approach is innovative and has never been applied to a real-world dataset of this scale. Using media data and transposing signed relationships in a graph, we uncovered the unique mixture of endorsements and disapproval that constitute the Republican and Democratic camps. It is a remarkable finding that the spectrum of political positions can be reliably recovered from the set of claims attributed to each actor by the media reporting. The split of the network into the two main camps provides strong evidence that the main political relations can be extracted by this approach.
Results suggest that the 2012 campaign was characterised by Obama’s strategy of defending his record on the economic policy and ‘owning the issue’, by his being ‘on the attack’ about a number of issues and forcing Romney and the Republicans to be defensive about salient issues. The set of triplets show that the 2012 campaign was very much focused on the issues of the US economy and civil rights for the Democrats. The agenda-setting effort was directed towards these two areas. Obama challenged the traditional Republican issue ownership about the economy. Other major actors who played an important role for Obama and Romney were Bill Clinton and Paul Ryan. Overall, media reporting contained more frequently positive statements about the Democrats than the Republicans. Overall, the Republicans were more frequently the object of negative statements either by Democrats or other actors. The Republican Party (GOP) is the most divisive subject in the campaign, and is portrayed in a more negative fashion than the Democrats.
The topological features of these semantic graphs are less straightforward – and perhaps more interesting to interpret. The network’s structurally unbalanced nature marks a difference with social networks. The presence of unclosed triplets indicates that latent and unrealised ties might be common in semantic graphs in which there is less obligation to be ‘coherent’. Most likely, this is because of the specific event under investigation: a political campaign. Another structural characteristic was the disassortative nature of the network, with high-degree nodes connecting with low-degree nodes and vice versa. In disassortative networks, well-connected nodes join a much larger number of less well-connected nodes. This is typical for biological and technological networks. Real-world social networks are usually assortative because in real life 2 everyone in a society would like to connect with elites, while the elites would rather communicate with those who share the same social status. In our case, we studied a political campaign and proposed that a disassortative network might represent the network translation of a mobilisation campaign operated by the candidates.
This study was made possible by the use of a computational infrastructure for the collection and analysis of ‘Big Data’ representing an example of the application of techniques to gain insight about societal phenomena. AI and text mining techniques were used to detect election-related articles, parse their content, extract the key actors in a narration and their relations, forming a network whose topology has then been analysed. We believe that our methodology represents a substantial step forward in the linguistic analysis of texts by means of extracting relational data. The future will include making better use of the information coming from the parser, which can go well beyond the simple SVO structure of sentences and focus also on automating the creation of positive/negative verb lists using the tool OpinionFinder (Wilson et al., 2005).
A network approach to text based on semantic graphs is a promising approach to analysing large corpora of texts and, with a clear application in mapping ‘mediascapes’, in cases of specific events and potentially also longitudinally.
Footnotes
Declaration of conflicting interests
The authors declare that there is no conflict of interest.
Funding
This work was supported by EU-funded research projects CompLACS (FP7-ICT 270327); and ThinkBig (FP7-IDEAS-ERC 339365).