
Abstract
In recent years, there has been an explosion of research looking at the relationship between Big Five personality traits and political behavior. This boom has been driven by the development of brief inventories that can assess subjects’ traits in as few as ten questions. Despite these developments, subjects’ own propensity to complete the surveys may be driven by their personality traits. As a result, key findings in this literature may be plagued by selection bias. Using a new data collection effort, I show that subjects who are more Agreeable or Neurotic have systematically different propensities to complete surveys. This result in hand, I show how relationships between the Big Five and political behavior may change estimated relationships between the traits and behavior. These findings are a significant caution to scholars examining the Big Five and their effects on a variety of phenomena.
Introduction
In recent years, research on the Five Factor model of personality has exploded across multiple fields. Some of the key developments in this domain has focused on examining the relationships between personality traits and political behavior among both ordinary citizens (e.g., Gerber et al., 2010, 2011a,b; Gerber and Dowling, 2012; Mondak and Halperin, 2008; Mondak et al., 2010; Mondak, 2010; Klingler et al., 2018) and political elites (e.g., Caprara and Zimbardo, 2004; Dynes et al., 2018; Ramey et al., 2017; Silvester et al., 2014). This growth has been driven, in large part, by the recent development of brief inventories measuring the Big Five (Gosling et al., 2003; Rammstedt and John, 2007). Since scholars are now able to assess subjects’ personalities with only a handful of survey items, many large scale surveys now include brief Big Five inventories, including several research teams’ samples of the Cooperative Congressional Election Survey (CCES), (since 2012) American National Election Study (ANES), and the most recent wave of the World Values Survey (WVS). 1
While these developments are important for both personality scholars and applied researchers across a number of fields, they are not without their potential drawbacks. In particular, we might have reason to believe that individuals with different personality profiles might themselves be more or less likely to participate in surveys to begin with. If this is indeed the case, then the findings of the literature relying on survey-based measures of Big Five personality traits might be, at best, attenuated and, at worst, spurious. Indeed, evidence of robust relationships between personality and survey participation could produce a form of selection bias (Heckman, 1979); that is, personality traits may influence both subjects inclusion in the sample as well as their behavioral outcomes. Consequently, any second-stage estimate of the relationship between personality behavior might be biased by failing to account for the selection mechanism.
While some recent work has corroborated my contention—namely, that there is a relationship between personality and survey nonresponse(Brüggen and Dholakia, 2010; Cheng et al., 2018; Marcus and Schütz, 2005; Nestler et al., 2015; Porter and Whitcomb, 2005)—to date, no study has systematically examined the implications of this on inferences for second-stage analysis. Part of this is driven by the nature of survey data itself. That is, the data provided by the CCES, ANES, WVS, and countless others only provides results from “good completes”—subjects who completed the entire survey. This, in turn, precludes us from being able to get a sense of the magnitude of the (potential) selection bias.
In this paper, I use a new data collection effort to examine these matters. Using data from subjects who both completed the survey (described below) as well as those who did not, I am able to show that (a) all personality traits save for Openness—but especially Agreeableness and Neuroticism—have a strong impact of subjects’ likelihood to complete the entire instrument and (b) that restricting our attention to only the “good completes” sometimes results in faulty inferences of personality’s impact on political behavior. This results in either false findings of statistical significance (or lack thereof).
These results raise some serious questions about applied personality research from surveys. Taken together with recent working showing that the Big Five are associated with extreme response style (Hibbing et al., 2019), that the distribution of personality traits differs between survey modes (Valentino et al., 2020), and—critically—that self-reported personality may be influenced by affective polarization (Arceneaux et al., 2024; Bakker et al., 2021), we find ourselves with a somewhat grim picture for the survey-based study of personality and political behavior. At the minimum, these collective findings should give us pause and force us to ask what (if anything) we can learn from online surveys of personality and behavior.
Data and results
The data in this study come from a Qualtrics survey conducted in the fall of 2017. The subject pool consists of American adults (18 and older). Qualtrics fielded the survey and sampling was done via its internet panel so as to be, as closely as possible, nationally representative. 2 Like other firms, Qualtrics is a panel aggregator, recruiting subjects from a variety of different sources (e.g., airline miles sites, video games, and social media) and rewarding them monetarily in proportion to the length of the instrument.
At the beginning of our survey, subjects were told that they were participating in a study examining the relationship between personality traits and language. They were informed that the estimated time to complete the survey would be 1 hour (60 minutes). The survey began with a standard battery of demographic questions and other questions exploring subjects’ political attitudes. They were then given a 20-min freeform text writing task in which they were asked to simply write whatever came to mind at that moment (Pennebaker and King, 1999). To break up the monotony of the task, it was broken in to 3–5 minute chunks, interspersed with the 120-item version of the International Personality Item Pool (IPIP-120) personality questionnaire (Johnson, 2014). After this, subjects were asked to complete other psychometric inventories, including the “Dirty Dozen” questionnaire (Jonason and Webster, 2010), the Schwartz’s Value Survey (Schwartz, 1992), the Global Preference Survey (Falk et al., 2018), and the child-rearing measure of authoritarianism (Feldman and Stenner, 1997).
Balance Table for Good versus Bad Completes.

Note: Big Five traits are normalized to the unit interval. *** p < 0.001, ** p < 0.01, * p < 0.05.
We can see that that four of the Big Five traits are predictive of survey completion, three of which—Conscientiousness, Agreeableness, and Neuroticism—at the 0.001 level.
3
More Conscientious, Agreeable, and Emotionally Stable subjects are much more likely to finish the instrument. Compared to the bad completes, those completing the survey took less time, were much more likely to be white, older, better educated, and wealthier. Since these factors are likely correlated together, we can examine the likelihood of completing the survey in a multivariate framework. Figure 1 shows results from a logit model where the dependent variable is whether or not subjects completed the survey. I consider two specifications, one in which only the Big Five are used as covariates (here and henceforth all standardized), as well as one in which a full battery of demographic and socioeconomic controls are included (see the appendix; variables included were done to make the models as close as possible to Gerber et al., 2010).
4
Whether we focus on models with or without covariates, Agreeableness has a strong, positive impacts on subjects’ likelihood of finishing the survey; Neuroticism’s effect is similar in magnitude but negative in direction. To make these coefficients more substantively interpretable, we can also examine predicted probabilities of survey completion. Varying each of these two traits from their 25th to 75th quartiles decreases (for Neuroticism) or increases (for Agreeableness) the subjects’ likelihood of completing the instrument by around seven percentage points; comparing the individuals lowest on these traits with those highest on them increases the gap to almost 40 points for Agreeableness and 20 points for Neuroticism. Personality Traits as a Predictor of Survey Completion. Note: These figures show the effect of each of the Big Five personality trait on the subjects’ propensity to complete the entire survey (logit models). For ease of interpretability, each of the traits is standardized. Point estimates are ordered in decreasing fashion. Dots represent results from models using the full dataset and triangles are from models with only good completes. Other covariates are omitted. Full tables are found in the appendix (see Tables A-3 and A-4).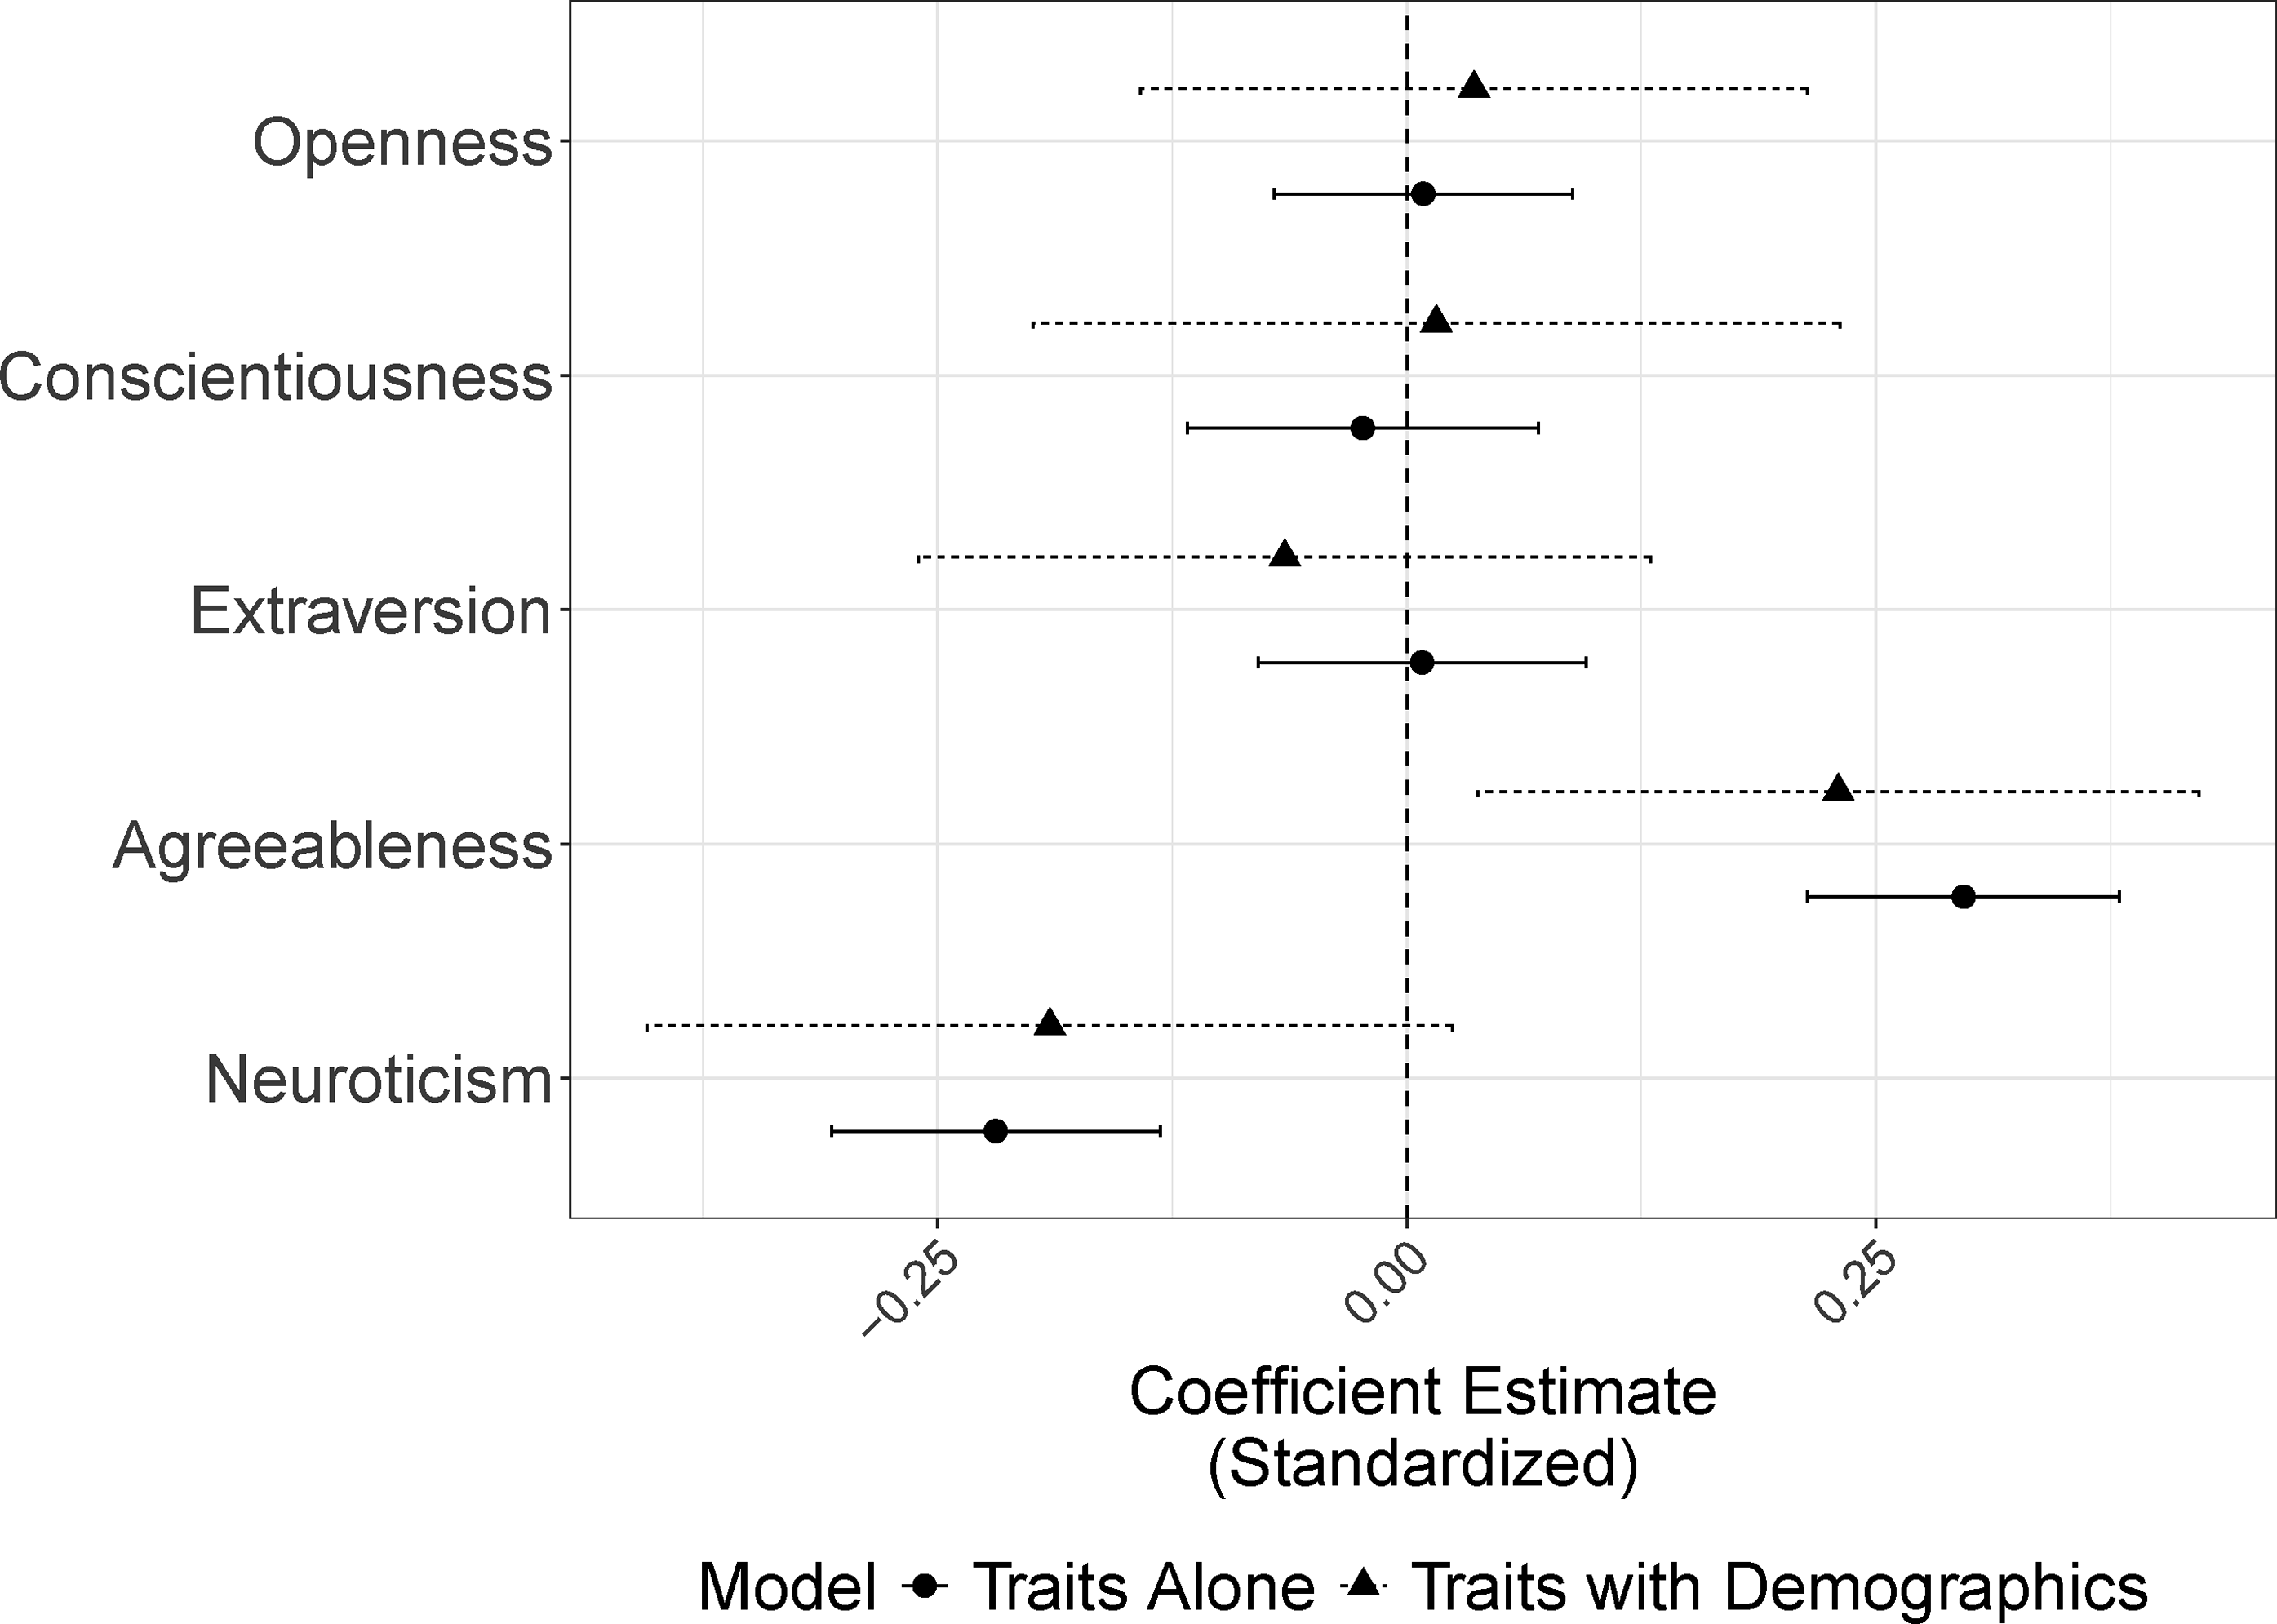
This finding is even more staggering if we examine the hazard rates for each of these traits. Specifically, since we know how far each subject made it through the survey, we can estimate the probability that a subject survives until any given point varying these traits. Figure 2 does just this, breaking subjects in to bins below or above the sample mean for each trait. We see that, while all subjects are less likely to continue with the survey as time goes on, subjects with above-average Agreeableness are almost 10 percentage points more likely to complete the survey than their peers. Similarly, for Neurotics, they are around seven points less likely to make it to the end. Kaplan-Meier Hazard Plots Varying Personality Trait. Note: These figures are predicted hazard rates for completing the full survey. Subjects are binned in to two groups: those with personality traits above the full sample mean and those below. 95% confidence intervals are shaded.
This is surely troubling, but what effect—if any—does it have on second-stage analyses? To tackle this question, I consider ten different survey items frequently measured in survey work on public opinion. These include how much attention subjects pay to politics (scale; 1 = Hardly at All, 4 = Most of the Time), how many days in the last week they talked about politics with family and friends, how often they attend church services (scale; 1 = Never, 6 = More than once a week), their partisan identification (scale; 1 = Strong Democrat, 7 = Strong Republican), their left-right ideology (scale; 1 = Extremely Liberal, 7 = Extremely Conservative), whether they are the kind of person who believes in one true religion (scale; 1 = Very Inaccurate, 5 = Very Accurate), their political knowledge (scale from 0 to 3 based on ability to correctly identify the correct party in control of both chambers of Congress and the correct number of justices on the Supreme Court), whether they describe themselves as the type of person who stands for the national anthem (scale; 1 = Very Inaccurate, 5 = Very Accurate), whether they describe themselves as the sort of person who tends to vote for liberal candidates (scale; 1 = Very Inaccurate, 5 = Very Accurate), and how often they write letters to the editor of a local/national newspaper about politics (scale; 1 = Never, 6 = Very Frequently). 5
For each of these survey questions, I treat each as a dependent variable of interest and regress each on, as before, the Big Five and the full battery of demographic controls. In each case, I run the models on two datasets: the good completes and the bad completes. The former is a fairly good representation of the sort of survey data most scholars use—that is, most scholars, lacking data on the bad completes, only use observed data in the analyses they conduct. The latter is useful for comparison because, if there is a big difference in magnitude and standard error vis-a-vis the good completes, omitting these data points would prove perilous for downstream inference.
Full results of these 20 regressions (10 dependent variables × 2 data sets) are found in Online Appendix Tables A-3 and A-4. We hone in on the coefficient estimates from the Big Five in Figure 3. This figure shows the difference in slopes for the Big Five between the good complete models and the bad complete models, with confidence intervals generated based on the standard error of the difference. Points to the right of zero are cases where the relationship between the trait and outcome is overestimates; those to the left of zero are underestimated. Across 50 different cases (10 dependent variables × 5 traits), about 32% of slopes on Big Five traits are significantly over or understated. The cases most starkly different are related to political ideology and vote choice—Openness’ impact on both liberalism and vote for liberal candidates is overestimated and both Extraversion and Neuroticism are understated. In terms of raw effects (Tables A-3 and A-4), about 20% have a reversal of sign (though not always in significance)
6
,
7
,
8
. What is important to note here is that even though Conscientiousness and Neuroticism were shown to be most closely related to survey completion, the relationship for other traits in downstream analysis is deeply impacted. The reason for this is simple: while the Big Five traits are distinct constructs, survey takers’ trait scores are correlated. For example, Conscientiousness is positively correlated with Extraversion and Agreeableness but negatively correlated with Neuroticism. As such, the effects are interconnected. Mischaracterizing the Relationship Between Traits and Behavior. Note: These figures show the extent to which using only good completes over- (or under-) estimates the relationship between a personality trait and behavior. Each point is the difference in regression slope from the model using good completes and the one using bad completes (see Tables A-3 and A-4). Line segments are the 95% confidence intervals generated from the standard error of the difference in coefficients.
Statistical significance is one, but not the only, way to assess the perils of using one data source over the other. Another useful approach is to examine model fit. If we regress each of the ten outcomes considered on the Big Five (plus controls) using one data source, we can treat the other data source as a test case; this is effectively a train-test split, to use machine learning terminology. To this end, we take our regressions for the 10 outcomes using the good completes as our models of interest, calculate the adjusted R2 for this data, and then calculate the out-of-sample R2 for the bad completes. If the two sets of R2 are close, then we should expect the data generating processes to be about the same. If the bad completes have a worse fit, it suggests that we may have a big problem on our hands. As we see in Figure 4, the latter seems more likely. For some dependent variables (e.g., standing for the national anthem or political knowledge), the differences are relatively small. For others, the gap is substantial. For Liberalism and Democratic Party ID, for example, the model fit is halved. For church attendance and writing letters to the editor, the out-of-sample R2 is actually negative, meaning that the good complete model is worse than the sample mean at explaining variation in subjects’ responses. Relationship Between Traits and Behavior. Note: Different dependent variables appear on the y-axis. The x-axis is the R2 for the various regressions. We first run the model only on the good completes and retain the R2. Using this model, we attempt to predict the out-of-sample R2 for the bad completes. Hence the negative values for some models.
Discussion
In this short paper, I have shown that the Big Five—especially Agreeableness and Neuroticism—have a strong impact on survey participants’ likelihood of completing standard surveys. This finding corroborates Ramey et al. (2019), who find that Neuroticism of American Members of Congress (measured using their speech) is strongly associated with survey nonresponse. Since my findings themselves only focus on subjects who completed the entire personality inventory (which ended around 30% of the way through the survey instrument), my findings are—if anything—an underestimate of any bias. By ignoring this fact and only using data from subjects who completed the full survey instrument leads—in some cases—to biased assessments of the role of Big Five in predicting individual behavior. Though the substantive analysis in this paper focused on political attitudes, I have no reason to believe that similar patterns would not hold in other domains.
That said, a few clear caveats are in order. First, this survey is exceptionally long and, as such, the kind of dropoff we see in this survey might not be representative of other, shorter instruments. That said, major national surveys like the Cooperative Election Survey (CES) take at least 20 minutes per sitting, so while this survey is long, I have no reason to doubt the patterns seen. Second, while we I am able to characterize differences between subjects who finished and did not finish the survey, I cannot say anything about those who refused to take the survey to begin with. In fact, the selection effects may be even worse. As a result of this—as well as a growing body of evidence in the literature (Arceneaux et al., 2024; Bakker et al., 2021; Hibbing et al., 2019; Valentino et al., 2020), scholars should take caution in their assessments of the Big Five’s impact on behavior.
Unfortunately, solving this problem is a more complex matter. A simple remedy to this issue would be for major survey providers to release data on all subjects, irrespective of whether or not they completed the instrument. If Big Five inventories are given relatively early on in the survey instrument, this would enable scholars to more effectively account for the missing data mechanism. While this would be perhaps more satisfying, it is not without its own issues. As I noted at the outset, all of the findings in this paper are predicated on subjects having completed the Big Five inventory. If the traits themselves are predictive of survey participation in general (and this seems to be the case), then even this remedy is plagued by selection bias. Another simple solution—shorter surveys—means less precise personality inventories and fewer questions overall. This is not satisfying, either.
So, what are we to do? Given all of the aforementioned limitations, I recommend a combination of slightly shorter instruments, replications, and multimodal surveying approaches. The first suggestion minimizes dropoff (though at the expense of precision as per above). The second and third approaches, drawing from the findings of Valentino et al. (2020), ensure that the results are minimally consistent. That is, if a series of relatively short surveys conducted using different modes come to the same conclusion about the linkages between personality and behavior, there is a much lower likelihood that those relationships are spurious.
Supplemental Material
Supplemental Material - Don’t answer me? A cautionary tale of personality traits and survey nonresponse
Supplemental Material for Don’t answer me? A cautionary tale of personality traits and survey nonresponse by Adam J. Ramey in Research & Politics
Footnotes
Funding
The author received no financial support for the research, authorship, and/or publication of this article.
Declaration of conflicting interests
The author declared no potential conflicts of interest with respect to the research, authorship, and/or publication of this article.
Carnegie Corporation of New York Grant
This publication was made possible (in part) by a grant from the Carnegie Corporation of New York. The statements made and views expressed are solely the responsibility of the author.
Supplemental Material
Notes
References
Supplementary Material
Please find the following supplemental material available below.
For Open Access articles published under a Creative Commons License, all supplemental material carries the same license as the article it is associated with.
For non-Open Access articles published, all supplemental material carries a non-exclusive license, and permission requests for re-use of supplemental material or any part of supplemental material shall be sent directly to the copyright owner as specified in the copyright notice associated with the article.