
Abstract
Deforestation is highly damaging to the global climate system and biodiversity. It varies strongly across countries and time, and is driven by several idiosyncratic as well as structural factors. Political regime types belong to the latter. Some studies suggest that more democratic countries are associated with lower rates of deforestation, whereas others report that such states might well be related to more clearing of forested land. We contribute to resolving the currently mixed evidence by re-examining, extending, and contextualizing the findings of one of the most recent empirical studies on how democracy affects deforestation. Based on a comprehensive empirical analysis using different data sources and estimation procedures, we show that levels of democracy are linked to deforestation in a U-shaped, curvilinear way: deforestation rates are less strongly pronounced in both the least and the most democratic states, but higher in partial democracies. In this U-shaped curve, however, the most democratic countries have a better forest-conservation record than states with lower democracy scores.
Introduction
Over the past 20 years, global forest cover has decreased by about 12%—more than 400 million hectares worldwide. 1 Deforestation on such a massive scale has detrimental implications not only for biodiversity but also for the global climate system (Artaxo 2023; Giam 2017). While human economic activity is ultimately responsible for most of the observed deforestation, there are also societal boundary conditions that may enable or constrain the clearing of forested land. Political regime types, and levels of democracy in particular, are considered by a large number of studies as a key factor in this context (e.g., Dasgupta and De Cian, 2018; Liu and Wang 2023; Opoku and Sommer 2023; Opoku et al., 2024).
This article contributes to scientific research on whether and how levels of democracy influence deforestation (for overviews, see, e.g., Cary and Bekun 2021; Acheampong and Opoku, 2023; Sandford 2023; Opoku and Sommer 2023; Harding et al., 2024; Opoku et al., 2024). Different forms of government affect how individuals, economic actors, or political intermediaries perceive environmental conditions and they shape their preferences over government policies that are relevant to forests. Hence, levels of democracy determine the opportunities for and constraints on collective action, and they also form the incentives of policymakers with respect to enabling or constraining economic activities that cause deforestation (see Bernauer and Koubi 2009).
However, existing studies have, thus far, produced ambiguous results (e.g., Buitenzorgy and Mol, 2011; Dasgupta and De Cian, 2018; Didia 1997; Ehrhardt-Martinez et al., 2002; Klopp 2012; Morjaria 2012; Opoku et al., 2024; Opoku and Sommer 2023; Pailler 2018; Rudel 2013; Wehkamp et al., 2018). One recent study in this literature (Sanford 2023) analyzes all countries globally and investigates whether democratization (rather than democracy as such) is associated with higher deforestation rates. The argument in Sanford (2023) is inspired by the political-economy literature on political business cycles: at certain points in the electoral process, policymakers may want to relax environmental standards to support economic growth, assuming that better economic conditions are rewarded by voters at the polls. This theoretical mechanism is then narrowed down to the empirical expectation that deforestation rates will be highest in weakly institutionalized (used synonymously with democratizing) countries at times of contested elections run in a majoritarian mode. The core result in Sanford (2023) is that democratization has, over the last three decades, been associated with increased deforestation on a significant scale. Countries undergoing a democratic transition lost, on average, an additional 0.8% of their forest land each year, and deforestation is slightly higher in election years. This finding provides a useful starting point for further research in view of several conceptual and empirical aspects that we seek to address and extend in the following.
Sanford (2023) focuses on partial democracies and democratizing states. This leaves it unclear how his argument relates to the larger literature on the democracy-environment nexus, and the corresponding claim that the most democratic states tend to be better public-good providers (e.g., Bernauer and Koubi 2009; Kashwan 2017; Liu and Wang 2023; Pickering et al., 2020). Empirically, what ultimately matters for global forest cover, and hence the global climate system and biodiversity, is not necessarily the effect of democratization per se, but how deforestation rates across all levels of democracy compare. Shedding light on this “big picture” by using different data sources and a wide range of empirical estimation procedures is the main objective for us.
Empirically, Sanford (2023) emphasizes findings based on disaggregated grid-level data for deforestation rates—his results are less supportive of the key hypotheses when using the country-year as the unit of analysis. We contend that employing the grid cell as the unit of analysis vastly increases the number of observations, but such boosting of statistical power is rather artificial because the key explanatory variables—including the political regime variables—are country-level measures. Moreover, Sanford’s (2023) democratization operationalization restricts the analysis to countries that experienced a transition in their form of government between 1982 and 2016. Hence, the least or the most democratic states that did not change their form of government during that period are excluded from the sample, though this could tell us a great deal about the relationship between democracy levels and deforestation, too.
We build on, extend, and contextualize the findings in Sanford (2023). First, we adopt a broader focus and examine both theoretically and empirically not only democratizing states, but all levels of democracy. Second, we use deforestation data at the country-year level because the main explanatory variable of interest is located at that unit of analysis. We combine these data with different data sources democracy scores (Polity V, V-Dem, and Freedom House) and re-examine the relationship between deforestation and democracy using a range of estimation approaches. We argue that the relationship between forest conservation and democracy follows a U-shaped curve. This claim is, ex-ante, supported by non-parametric cross tabulations of the data (Tables 11–16 in the Supporting Information) and generalized additive models (GAMs; Figures 3–4 in the Supporting Information). Using parametric models, we find that states with medium levels of democracy, which approximates partial democracies, experience higher rates of deforestation than the most and least democratic countries, as observed by Sanford (2023) and others. What is more, however, in this U-shaped curve, the most democratic countries have a far better forest-conservation record than states with lower democracy scores: the most democratic countries have gained a total of about 270 million hectares of forest land area since 1990. This shows that, above all, that the most democratic systems are associated with a far better forest-conservation record than other, less democratic forms of government.
How is democracy related to deforestation?
We view the implications of different levels of democracy for deforestation as emerging from both policymakers’ incentives to facilitate or reduce deforestation (or even to invest in reforestation) and institutional constraints on their ability to change existing policies. In other words, and deriving from existing studies (e.g., Acheampong and Opoku, 2023; Cary and Bekun 2021; Harding et al., 2024; Opoku et al., 2024; Opoku and Sommer 2023; Sandford 2023), we concentrate on actors’ willingness and institutional opportunity. While willingness pertains to the resolve and intention of policymakers to support, accept, or oppose deforestation, opportunity stands for the available possibilities, resources, and abilities to do so. Three general mechanisms seem particularly relevant in this regard that link democracy levels to deforestation.
First, policymakers in the most democratic societies have weaker (relative to less democratic countries) incentives to adopt policies that facilitate deforestation (e.g., Bernauer and Koubi 2009; Deacon 2009; Kashwan 2017; Liu and Wang 2023; Pickering et al., 2020). The main reason, which emerges from selectorate theory (see Mesquita et al., 2005), is that it is more efficient and politically effective for democratic policymakers to provide more public, relative to private, goods. Thus, democratic policymakers will opt for forest conservation or may even consider reforestation, which benefits a comparatively large share of voters. Conversely, in the most democratic systems, deforestation tends to benefit fewer voters via very localized public or private goods. In addition, policymakers in the most democratic countries tend to face more institutional constraints in terms of checks and balances (e.g., through independent courts and civil society) if they seek to weaken existing forest conservation or reforestation policies to obtain short term electoral gains. As a result, we expect highly democratic countries to experience less deforestation or to invest in reforestation, relative to other levels of democracy.
Second, in the least democratic countries, that is, states that are or approximate full autocracies, the government faces only weak institutionalized constraints when considering policy changes that facilitate or limit deforestation. Authoritarian leaders may also want to reward particular parts of the selectorate with private goods (Cao and Ward 2015), including weak forest-conservation standards and privileged access to logging. Weak institutionalized constraints imply that they will find it comparatively easy to do so. Having said that, autocratic policymakers also have, more so than the most democratic policymakers, a larger range of options at their disposal for providing private goods to politically relevant members of the elite (see Mesquita et al., 2005). And some of these alternatives can be supplied more quickly and at a lower overall cost compared to providing deforestation privileges to parts of the selectorate (see Ward et al., 2014). This implies that we should expect the long-term equilibrium to be more deforestation in the least democratic countries, compared to the most democratic countries.
Third, in partial democracies, that is, states with democracy scores between the least and the most democratic countries, we expect stronger incentives for policymakers to adopt or maintain policies that are conducive to deforestation. Incumbents in such states may seek to provide private goods (in our case, e.g., logging rights) to some societal groups that are essential to remaining in power when elections are contested (Sanford 2023). At the same time, institutionalized constraints on the government’s ability to change policies tend to be weaker than in highly democratic countries, notably because checks and balances between government, the legislature, and the courts are less strongly pronounced (Vreeland 2008). Our empirical expectation is, therefore, that deforestation rates should be higher in partial democracies, relative to the least and the most democratic forms of government.
Ultimately, we expect more deforestation in the least democratic states than in the most democratic ones, but more deforestation in semi-democracies than the least and most democratic countries. In essence, and in line with Opoku et al. (2024), this pattern points to a U-shaped relationship between democracy scores and deforestation, where the “left (least democratic) tail” is somewhat smaller than the “right (most democratic) tail,” and deforestation is most strongly pronounced in partial democracies.
Study design
We present the findings from two empirical analyses. Our first analysis is based on Sanford (2023) who uses Hansen’s (2018) forest data. We replicate the main country-level model in Sanford (2023) and then extend it by exploring a curvilinear relationship between democracy levels and deforestation. In a second empirical analysis, we employ alternative data for the dependent variable and use different items for democracy scores, which in turn also leads to a more extensive sample across time and space. The main difference between the first and the second analysis is thus not the unit of analysis—we use the country level also in the first analysis. However, the first analysis is a full replication of Sanford (2023) using his data at the country level, while the second analysis relies on alternative data sources.
In the Supporting Information, we present a large number of additional analyses and robustness checks. First, we provide a descriptive overview of the core variables of interest, paying particular attention to the different forest items. Second, we control for the change in forest cover in the previous year. Third, we incorporate a spatial variable capturing other countries’ forest growth. Additionally, a control variable for trade openness is considered. This robustness check addresses an additional influence for the more democratic countries as they may more actively participate in international organizations of the liberal international order, several of which promote the preservation of nature directly or via clauses attached to trade and investment (see Blümer et al., 2020). Fifth, the ideological position of the government and the electoral system of a country are taken into account. We also estimate a model comprising a country’s number of veto players as a control variable, finding that more veto points can be associated with more forest loss. Seventh, we omit the least democratic countries from our analysis. Finally, we restrict the sample to the post-1995 period and we assess the data via cross tabulations and GAMs. The non-parametric cross tabulations and the GAMs also point to a U-shaped relationship between deforestation and levels of democracy.
Empirical analysis 1
Sanford (2023) uses Hansen’s (2018) disaggregated data on forests, defined as the presence of vegetation with a canopy over five m tall. Sanford (2023) mainly explores the percentage point change in forest cover per 0.05° × 0.05° grid cell. As the theoretical argument focuses on the national (state) level, and to avoid the unnecessary inflation of observations for the analysis, we employ the aggregated, country-level variable. The final item we use constitutes the annual change of a country’s forest cover (in percent). Positive values indicate an inter-annual growth in forested land, while negative values stand for deforestation and, hence, loss in forest cover. The sample based on Sanford’s (2023) dependent variable covers up to 147 countries between 1983 and 2015.
Following Sanford (2023), we use two-way fixed effects OLS regressions. The fixed effects are based on countries and years and, thus, control for unobserved time-invariant unit-level influences, for example, the total forest area of a country in the first year of the sample period, and common temporal shocks, respectively. We do not include a lagged dependent variable in the estimations, but consider an item on the level of forest cover (in % of land area) in the year before a focal year to address unit-specific temporal path dependencies in deforestation. While the two-way fixed effects setup helps obtain a clearer picture of how democracy and deforestation are associated with each other, this approach also has certain shortcomings (see, e.g., Imai and Kim, 2021). We return to this point in the second empirical analysis below.
To capture regime type, Sanford (2023) uses a dichotomous indicator of democracy from Boix et al. (2013) who define a minimum threshold for both contestation and participation to determine whether a country is a democracy in a given year. Models 1–2 are based on that variable. Models 3–4 also rely on a binary democracy variable used in Sanford (2023), but Polity V data set (Marshall and Gurr 2020) is the underlying source here. The revised polity2 score of the Polity V data assumes values between −10 and 10, with lower scores standing for less democratic countries and higher values representing more democratic regimes. The item Democracy in Models 3–4 receives a value of 1 if the polity2 score is larger than 5 (0 otherwise).
Deforestation and Democracy—Replication and Extension of Sanford (2023).
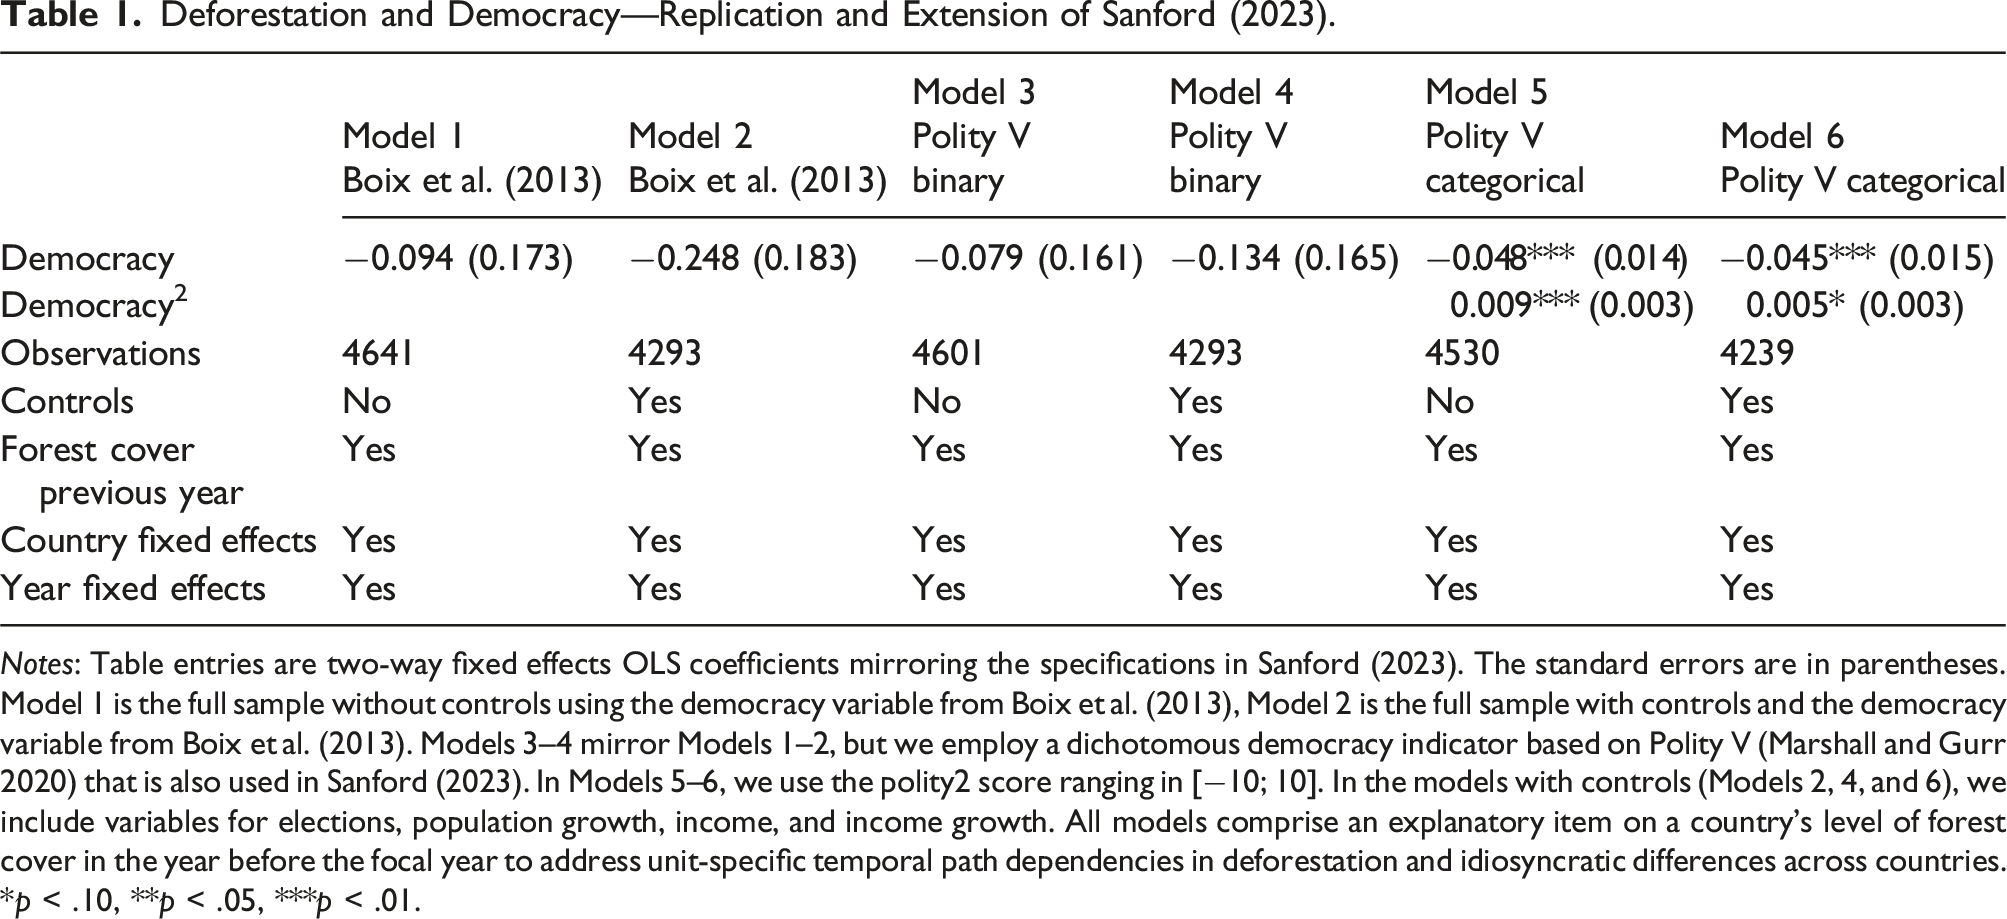
Notes: Table entries are two-way fixed effects OLS coefficients mirroring the specifications in Sanford (2023). The standard errors are in parentheses. Model 1 is the full sample without controls using the democracy variable from Boix et al. (2013), Model 2 is the full sample with controls and the democracy variable from Boix et al. (2013). Models 3–4 mirror Models 1–2, but we employ a dichotomous democracy indicator based on Polity V (Marshall and Gurr 2020) that is also used in Sanford (2023). In Models 5–6, we use the polity2 score ranging in [−10; 10]. In the models with controls (Models 2, 4, and 6), we include variables for elections, population growth, income, and income growth. All models comprise an explanatory item on a country’s level of forest cover in the year before the focal year to address unit-specific temporal path dependencies in deforestation and idiosyncratic differences across countries. *p < .10, **p < .05, ***p < .01.
Table 1 presents the results pertaining to our first empirical analysis. According to Models 1–4, democracy has a negative and statistically insignificant effect. This estimate is robust to changing the sample and the inclusion of controls (Model 2 and Model 4), and it mirrors the results reported in Sanford (2023). As argued above, however, the specification used for the estimations in Table 1 should consider the possibility of a curvilinear relationship between democracy levels and deforestation.
Therefore, we turn to Models 5–6 where we present our revised models that focus on the curvilinear effect of democracy. Democracy is now negatively signed and significant while its square term is positively signed and significant at conventional levels. These estimates indicate that forest-cover growth initially decreases with higher levels of democracy—but only until a turning point is reached. After this turning point, forest-cover growth rises with higher levels of democracy. Correspondingly, the least and the most democratic regimes perform better than partial democracies. The turning point for the Polity V measure is reached at around 3 (on a −10 to 10 scale) in Models 5-6.
Empirical analysis 2
In the first empirical analysis, we follow Sanford (2023) and use his data for the dependent variable as well as the democracy item(s), and we employ a similar two-way fixed effects OLS regression specification. We extend and improve this setup in our second empirical analysis by also presenting the results from random-effects models and estimations that only include temporal fixed effects. Accordingly, we control for the temporal variation (any global or time-specific shocks affecting all countries) in our data and focus on the differences in deforestation between countries. This empirical identification strategy ensures that all forms of government and democracy scores are considered for the analysis, including states that never change their score over time.
Moreover, we now replace both the dependent variable and the democracy item of Sanford (2023). Specifically, the dependent variable for the second analysis is taken from the UN Food and Agriculture Organization (FAO). According to the FAO, forest land is defined as “land spanning more than 0.5 hectares with trees higher than five meters and a canopy cover of more than 10 percent, or trees able to reach these thresholds in situ.” 2 Predominantly agricultural or urban land is not considered for this measure. As before, we focus on the annual growth/decrease in forest land per country. As the original data is at the country level, no aggregation is necessary. The sample based on the FAO data comprises 169 countries between 1991 and 2020.
The explanatory variable in the second analysis is replaced by two alternatives. On one hand, there is the Varieties of Democracy (V-Dem) “electoral democracy” index, which comprises five components based on Dahl’s (1971) polyarchy: an elected executive, free and fair elections, universal suffrage, freedom of association, and freedom of expression. Boese (2019) argues that the variable outperforms other indicators due to the coherence of its definitions, measurement strategies, and aggregation procedures. On the other hand, we use the Freedom House’s political rights index, which ranges in [1; 7] with higher values signifying more limitations in the electoral process, political pluralism and participation, and functioning of government. We take the inverse of this variable so that higher values represent more democratic regimes. For these two democracy items, we also include their squared terms in the models to capture the expected curvilinear relationship between deforestation and democracy.
Deforestation and Democracy—FAO Data and V-Dem Democracy Item.

Notes: Table entries are OLS coefficients. The standard errors are in parentheses. Model 7 is the full V-Dem sample without controls, Model 8 is the full V-Dem sample with controls. Model 9 omits unit-level fixed effects, Model 10 is the full V-Dem sample with controls and random effects. In the models with controls, we include variables for competitive elections, population growth, income, and income growth (as in Sanford 2023). All models comprise an explanatory item on a country’s level of forest cover in the year before the focal year to address unit-specific temporal path dependencies in deforestation and idiosyncratic differences across countries.*p < .10, **p < .05, ***p < .01.

Deforestation and democracy—substantive quantities of interest I. Notes: Figure based on Model 7. Dashed lines pertain to 90% confidence intervals.
Deforestation and Democracy – FAO Data and Freedom House Democracy Item.
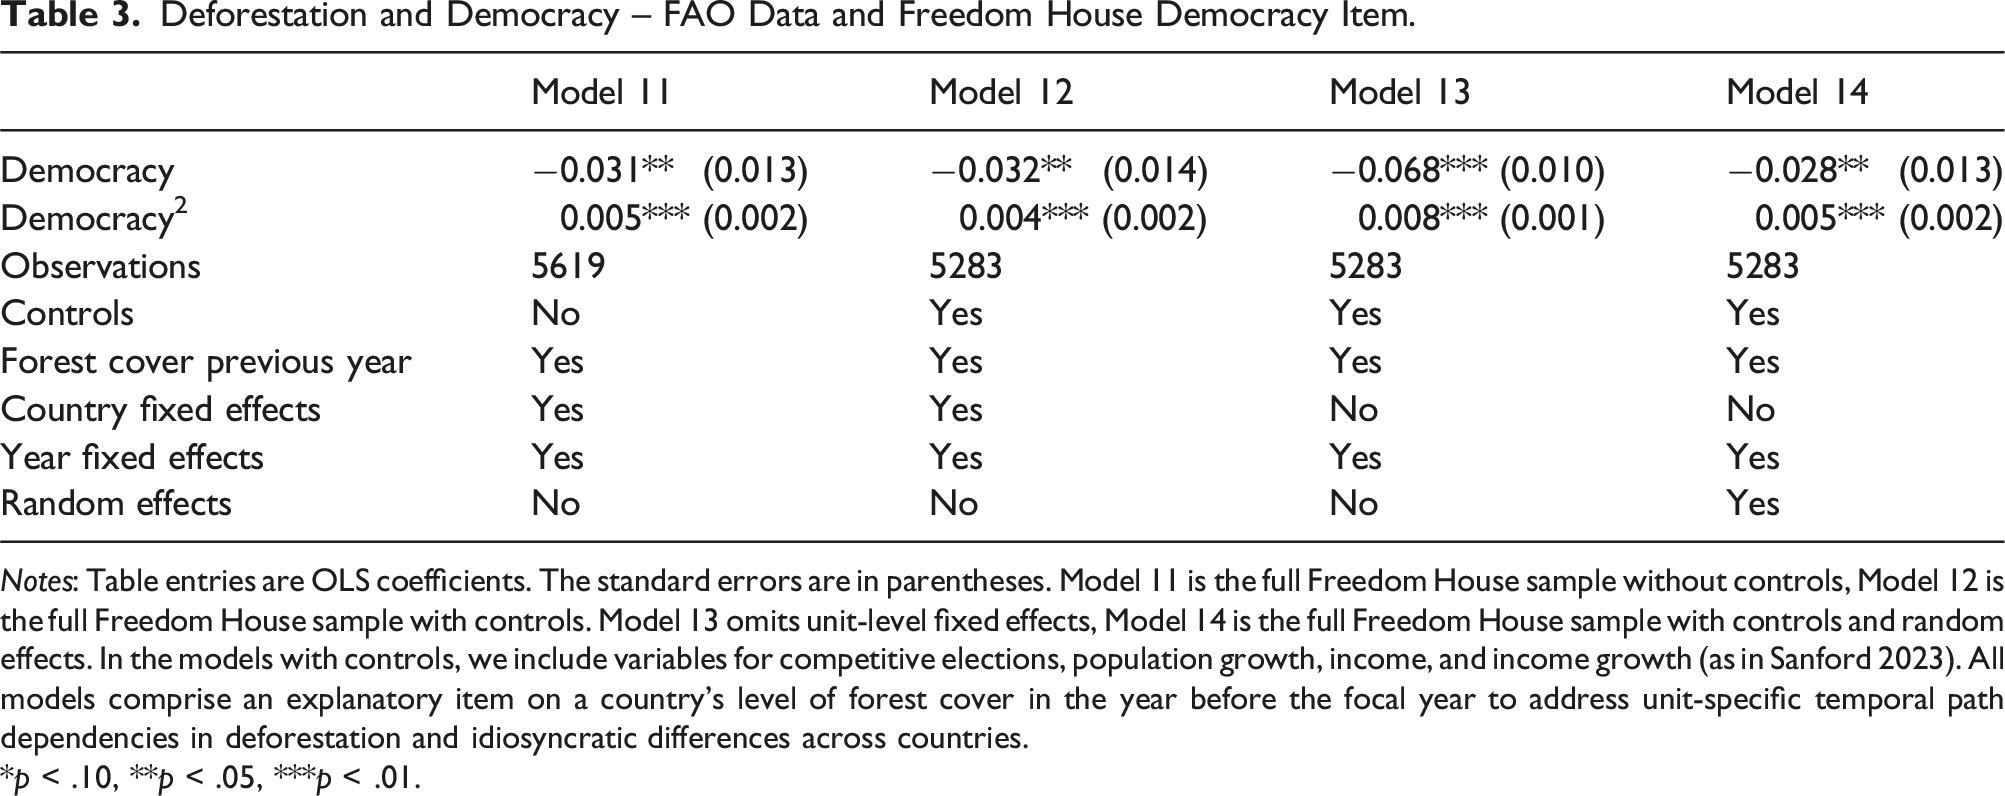
Notes: Table entries are OLS coefficients. The standard errors are in parentheses. Model 11 is the full Freedom House sample without controls, Model 12 is the full Freedom House sample with controls. Model 13 omits unit-level fixed effects, Model 14 is the full Freedom House sample with controls and random effects. In the models with controls, we include variables for competitive elections, population growth, income, and income growth (as in Sanford 2023). All models comprise an explanatory item on a country’s level of forest cover in the year before the focal year to address unit-specific temporal path dependencies in deforestation and idiosyncratic differences across countries.*p < .10, **p < .05, ***p < .01.

Deforestation and Democracy—Substantive Quantities of Interest II. Notes: Figure based on Model 11. Dashed lines pertain to 90% confidence intervals.
Discussion
This article contributes to the literature on deforestation and democracy, and more generally on environmental politics as well as comparative politics. We address existing theoretical as well as empirical ambiguities on how democracy affects ecological outcomes, particularly in the case of deforestation. Based on the different data sources for forest cover and democracy, using a systematic empirical estimation strategy complemented by a large number of additional analyses in the SI, we find robust support for a curvilinear relationship between levels of democracy and deforestation.
Specifically, we have addressed some of the data and methods limitations in the existing literature and find evidence for a positive effect of the most democratic countries on forest growth or a negative/insignificant effect on deforestation rates; at the same time, we identified a negative relationship between forest cover and partial democracies. The least democratic societies perform better than these forms of government, although the least democratic countries do not outperform the most democratic societies in the system.
In fact, the U-shaped relationship we identify above pertains to deforestation rates, though for the world as a whole, the total area of forest land may seem equally important. According to the FAO data, the most democratic states have gained in total more than 270 million hectares in forest cover since 1990. Conversely, the least democratic countries lost nearly 400 million hectares (according to the FAO data). Thus, overall, by far the biggest problem from a global perspective is the forest loss in the least democratic countries, which is not compensated by forest-cover gains in democracies. We conclude that the most democratic countries have a better forest-conservation record than the least democratic states, and partial democracies have been doing worse than both the least and the most democratic countries in the international system. Future work may seek to uncover in greater detail the actual mechanisms behind the relationship between democracy and deforestation, possibly also via mediation analysis (see Iacobucci 2008).
Supplemental Material
Supplemental Material - New evidence reveals curvilinear relationship between levels of democracy and deforestation
Supplemental Material for New evidence reveals curvilinear relationship between levels of democracy and deforestation by Tobias Böhmelt, and Thomas Bernauer in Research & Politics
Footnotes
Declaration of conflicting interests
The author(s) declared no potential conflicts of interest with respect to the research, authorship, and/or publication of this article.
Funding
The author(s) received no financial support for the research, authorship, and/or publication of this article.
Supplemental Material
Carnegie Corporation of New York Grant
This publication was made possible (in part) by a grant from the Carnegie Corporation of New York. The statements made and views expressed are solely the responsibility of the author.
Notes
References
Supplementary Material
Please find the following supplemental material available below.
For Open Access articles published under a Creative Commons License, all supplemental material carries the same license as the article it is associated with.
For non-Open Access articles published, all supplemental material carries a non-exclusive license, and permission requests for re-use of supplemental material or any part of supplemental material shall be sent directly to the copyright owner as specified in the copyright notice associated with the article.