
Abstract
Research on interpersonal political discussion has focused on cross-party interactions. But how much disagreement exists between co-partisans in core networks, and what kinds of differences do we see in the broader acquaintance networks of co-partisans supporting different primary candidates? We use data from a nation-wide survey administered early in the 2020 Democratic nomination contest to examine these questions. In presenting descriptive analyses, we uncover substantial disagreement between Democrats—disagreement that would be missed entirely by traditional measures focused solely on whether individuals share partisanship or general election vote choice. We also find intriguing patterns when looking at the acquaintance networks of Democrats who supported different primary candidates. We discuss how studying intraparty disagreement can not only aid our understanding of how primary nomination contests mobilize distinct constituencies, but also suggest strategies for potentially mitigating interparty disagreement.
Shifting the conversation about disagreement
Scholarly and popular analyses of the public have centered on the extent to which Americans reside in partisan enclaves (e.g., Brown and Enos 2021; Settle 2018; Thompson 2023). And, work on exposure to disagreement in Americans’ core social networks (Marsden 1987) has long followed this same tack, focusing almost exclusively on cross-party exposures—where core networks are typically operationalized using the first 3–5 individuals respondents name when prompted to report on their discussions with people about “important matters” (see McClurg et al., 2017). Some voices have emphasized the partisan agreement found in these social circles (Mutz 2006), while others have argued that partisan disagreement is more common in these environments than we might think (e.g., Huckfeldt et al. 2004), and still others have considered how distinct measures of interpersonal political disagreement can yield different conclusions (e.g., Klofstad et al., 2013). At the same time, researchers have given careful attention to the drivers and consequences of individuals avoiding interpersonal disagreement (e.g., Carlson and Settle 2022), and have examined how common methods for studying core networks underestimate exposure to partisan differences (e.g., Eveland et al., 2018; Sokhey and Djupe 2014).
Though previous efforts have revealed much, a large portion of disagreeable interactions are potentially ignored when focusing primarily (or exclusively) on cross-partisan disagreement. Accordingly, we turn to heretofore unaddressed questions: How much disagreement exists in the core networks of co-partisans, and what kinds of differences do we see in the broader acquaintance networks of co-partisans who support different primary candidates? What can intraparty interactions tell us about the potential for informal deliberation in the public (Mutz 2006)? And, if we expand our gaze to also look at the broader acquaintance networks of co-partisans, what might it reveal about how primary candidates mobilize distinct constituencies (Popkin 1991)?
In this paper we focus on a particular party in an election cycle. We make this move because if exposure to disagreement in social networks can promote tolerance (Mutz 2006), studying intraparty disagreement—which would seem to be a regular thing for many Americans, given higher rates of contact among co-partisans versus out-partisans—may help us understand how everyday interactions can yield democratic goods like strengthened perceptions of legitimacy and increased respect for opposing rationales.
Empirical strategy: Networks and the 2020 democratic primary
To look at interpersonal disagreement among co-partisans, we designed a study around the 2020 Democratic presidential primaries. 1 Many Democratic candidates made a run for the nomination in 2020; the voting records and issue positions of those who declared their candidacy reflected the diversity of interests others have noted in the Democratic Party (e.g., Grossman and Hopkins 2015, 2016). At the same time, the public also had its own perceptions of these candidates. For example, Broockman and Kalla (2020) illustrate that members of the mass public were able to array the field ideologically, classifying some candidates as more liberal (e.g., Sanders, Warren), and others as more moderate (e.g., Bloomberg, Biden).
Of course, individuals supporting different candidates in the 2020 Democratic primary also differed in their social and political characteristics. For example, people who supported Elizabeth Warren and Bernie Sanders were more liberal, while those who professed support for Biden tended to be older and more religious (Pew Research Report 2020). Given these documented differences between many self-identified Democrats, it’s reasonable to assume that individuals may have experienced quite a bit of disagreement when talking to their co-partisans during the primaries, 2 and that they may have existed in distinct acquaintance networks, knowing more (fewer) people from groups associated with the different candidates.
Using Lucid’s Fulcrum Exchange, we contacted a nation-wide sample of Americans (18+) during the early primary stage (i.e., February 2020—when most primary candidates were still in the race, and before the COVID-19 shut-downs). Our survey featured an over-sample of Democrats, due to fact that only the 2020 Democratic presidential primary was contested, and here we focus solely on Democratic respondents for the aforementioned reasons. Democrats are defined as those who identified as strong Democrats, not very strong Democrats, or Democratic “leaners” on the traditional seven-point scale (we also examined patterns within different “cut-points,” separating out leaning Democrats; please see Appendix B). This classification yields 1,035 self-identified Democrats (68% strong Democrats, 25% Democrats, 7% leaning Democrats). We exclude those who did not report their partisanship. The survey included questions specially designed to yield information on respondents’ core and acquaintance networks; we discuss these items when presenting their corresponding results. Further information about the data collection process and sample is available in Appendix A.
Results: Core discussion networks contain disagreement
Our survey asked respondents about a wide range of political attitudes and behaviors. Importantly, it also included a name generator to gauge core discussion networks (Marsden 1987)—specifically, we asked respondents to list up to four individuals with whom they “discuss important matters.” Core networks are often characterized by close relationships (family members, friends) and regular offline interactions (vs solely online exchanges). These names were solicited one at a time (separate pages) to avoid suggesting that respondents had to provide the maximum. After a respondent thought of an individual, they were asked several follow-up questions about the person (e.g., What is that person’s party identification?). This process repeated for all provided names. Of our sample’s Democrats, 1,010 (98%) listed at least one discussant, while 175 (17%) listed the maximum (four). Overall, Democratic respondents listed 2,030 discussants (an average of ∼2).
Democrats’ core networks contain democrats…
We begin by assessing the extent to which Democrats reported Democrats in their core networks. We code reports of “Strong,” “Democrat,” and “Leaning” as Democratic; discussants are excluded if no partisanship was reported for them. Democratic respondents listed other Democrats as core discussants 76% of the time (1,474 of 1,938 discussants). Thus, to start, we find more partisan agreement than partisan disagreement in these core discussion networks of Democrats, which is consistent with findings of canonical network studies (e.g., Huckfeldt et al. 2004; Mutz 2006). 3
But democrats disagree—regularly—with their Co-partisans
Given the emphasis on cross-party exposure, analyses of core networks typically stop at the initial measure of disagreement, whether based on partisanship or general election candidate support; disagreement is registered when a respondent reports she voted for the Democrat, but her discussant the Republican. But what happens when we look for disagreement between fellow partisans?
We added an item to our name generator to address just this—that is, in addition to asking respondents about their discussants’ partisanship, we asked them how often they disagreed with each of their named discussants about politics (Never “1” to Very Often “5”). Fifty-four percent—the majority—of our Democratic respondents indicated disagreeing with their Democratic discussants either “sometimes,” “often,” or “very often.” This simple cut at the data suggests that disagreement is a feature of interaction in core networks of like-minded partisans. Little, if any, existing research on interpersonal discussion has documented this frequency of disagreeable interaction among co-partisan discussants.
To further illustrate this co-partisan disagreement, we take a respondent’s report on her discussants and calculate a mean for her network. Figure 1 plots these averages by the number of discussants (top) and the number of Democratic discussants (bottom); this ranges from 1 to 4 discussants, and 0 to 4 Democratic discussants. The ridgeline plots tell a clear story: regardless of the number of names given (top), and even in core networks mostly or entirely comprised of fellow Democrats (bottom), we see a good amount of perceived disagreement and a lot of variance. Clearly, an absence of cross-partisanship does not mean an absence of disagreement.
4
Average Frequency of Disagreement by Discussants (Democratic Respondents Only). Note: Average frequency of disagreement in core networks (N = 970) by the number of discussants (top) and number of Democratic discussants (bottom). Means plotted. Scale runs 1–5, per the labels; plots are extended beyond these points for visual appeal only.
Opinions vary between Co-partisans
To begin to get at the type/form of co-partisan disagreement, we asked: “Would you say this person’s opinions on political issues are similar or different from yours?” Answers could range from Extremely Different “1” to Extremely Similar “6”. Here again we see a range of social experiences in the network averages. Figure 2 presents ridgeline plots by network size (top) and the number of Democratic discussants (bottom)—larger values on the x-axis indicate higher average perceived opinion similarity. There is considerable variance across the range of network size. And, in core networks where respondents find themselves surrounded by opposing partisans (0 or 1 Democratic discussants), there is quite a bit of variance in network averages; this shrinks and shifts rightward (towards similarity) as more fellow Democrats populate the core network. Notably, even in core networks characterized by near or complete partisan agreement, we see quite a bit of reported dissimilarity in average opinion. Average Opinion Similarity by Discussants. (Democratic Respondents Only). Note: Average network opinion similarity (N = 970) by the number of discussants (top) and the number of Democratic discussants (bottom). Means plotted. Scale runs 1–6, per the labels; plots are extended beyond these points for visual appeal only.
Core networks and primary candidate support
“…Sanders appeals to lower-income and less-educated people; Warren beats Sanders among those with postgraduate degrees. Sanders performs better with men, Warren with women. Younger people who vote less frequently are more often in Sanders’ camp; seniors who follow politics closely generally prefer Warren.” -- Holly Otterbein, Politico,
5
Summer, 2019.
Observers regularly craft and repeat narratives about primary candidates’ bases. But while we often hear about the demographic correlates of different supporters (e.g., the Politico quote), we rarely hear anything about potential differences in the networks of said supporters.
To pursue this, we return to the same network features to assess whether respondents’ network characteristics vary based on their candidate support. That is, we look at whether individuals who supported Biden, Sanders, Warren, or Bloomberg—the “frontrunners” in February 2020—were located in distinctive core networks of co-partisans.
To start, we note that (on average) Biden supporters listed more Democratic co-partisans (μOther − μBiden = −0.16, (−0.33, 0.00), ptwo-tailed = 0.05). Figure 3 reproduces the familiar plots of core network average frequency of disagreement (top) and core average opinion similarity (bottom), here broken out by respondent candidate support. Several things are notable: first, we again observe a lot of variance in these core networks. Second, while average frequency of disagreement is roughly normally distributed for Sanders, Bloomberg, and Biden supporters, Warren supporters’ networks have masses of data on the lower and higher sides of the measure—a distinctiveness mirrored in the opinion similarity plots, despite all four having a negative skew. Average Frequency of Disagreement and Average Opinion Similarity by Primary Candidate Support. Note: Average frequency of disagreement (top) and average perceived opinion similarity (bottom) by candidate supported (N = 792, as analysis limited to supporters of the “top 4” candidates in the field). Means plotted.
Acquaintance networks reveal broader patterns of exposure
We have used novel data to document disagreement in the core social networks of co-partisans during the 2020 Democratic presidential primary. However, we know that individuals’ social contact extends beyond the 3–5 individuals that are typically reported via name generator techniques (Eveland et al., 2018; Sokhey and Djupe 2014). Thus, what might we be able to say about our Democratic respondents’ patterns of broader exposure to individuals with different political and demographics characteristics? Do supporters of different candidates differ from their co-partisans in their exposure to different groups in society?
To address these questions, we included an aggregate relational data (ARD) battery alongside the name generator. While name generators provide detailed information on core discussants, ARD batteries are designed to measure the number of people an individual knows who hold a particular attribute—they are used to gauge exposure and potential interaction in populations (see, e.g., McCormick et al., 2013). Specifically, we asked respondents to think about the people they are acquainted with, and to provide the approximate number of these acquaintances possessing different attributes (in bucketed responses of 0, 1, 2–5, 6–10, or 10+ acquaintances): “Think of all the people that you are acquainted with (meaning that you know their name and would stop and talk at least for a moment if you ran into the person on the street or in a shopping mall). How many of these people are you pretty certain have the following attributes?”
Acquaintance attributes presented to respondents in the aggregate relational data (ARD) battery.

A first look at patterns of exposure for supporters of different primary candidates
As an initial way of looking at these data, we consider whether individuals had some exposure to individuals from certain groups, or little to no exposure—that is, we collapse the categories of 0 and 1 (to 0), and the categories 2–5, 6–10, and 10+ (to 1). Figure 4 shows the proportion of Democratic respondents, by the primary candidate they supported (for the four frontrunners), that reported knowing two or more acquaintances with certain traits. Examining the portion of respondents reporting two + Clinton-voting acquaintances versus two + Trump voting acquaintances, we see some face validity for the ARD approach: regardless of primary candidate supported, a higher portion of our Democratic respondents reported knowing two + Clinton voters relative to the portions reported for Trump voters. This pattern makes sense given that we are focused on self-identified Democrats. Acquaintance Networks by Candidate Supported (Portion Knowing 2+ Acquaintances with Traits). Note: 95% CIs on means. (NSanders = 286; NWarren = 108; NBiden = 207; NBloomberg = 191).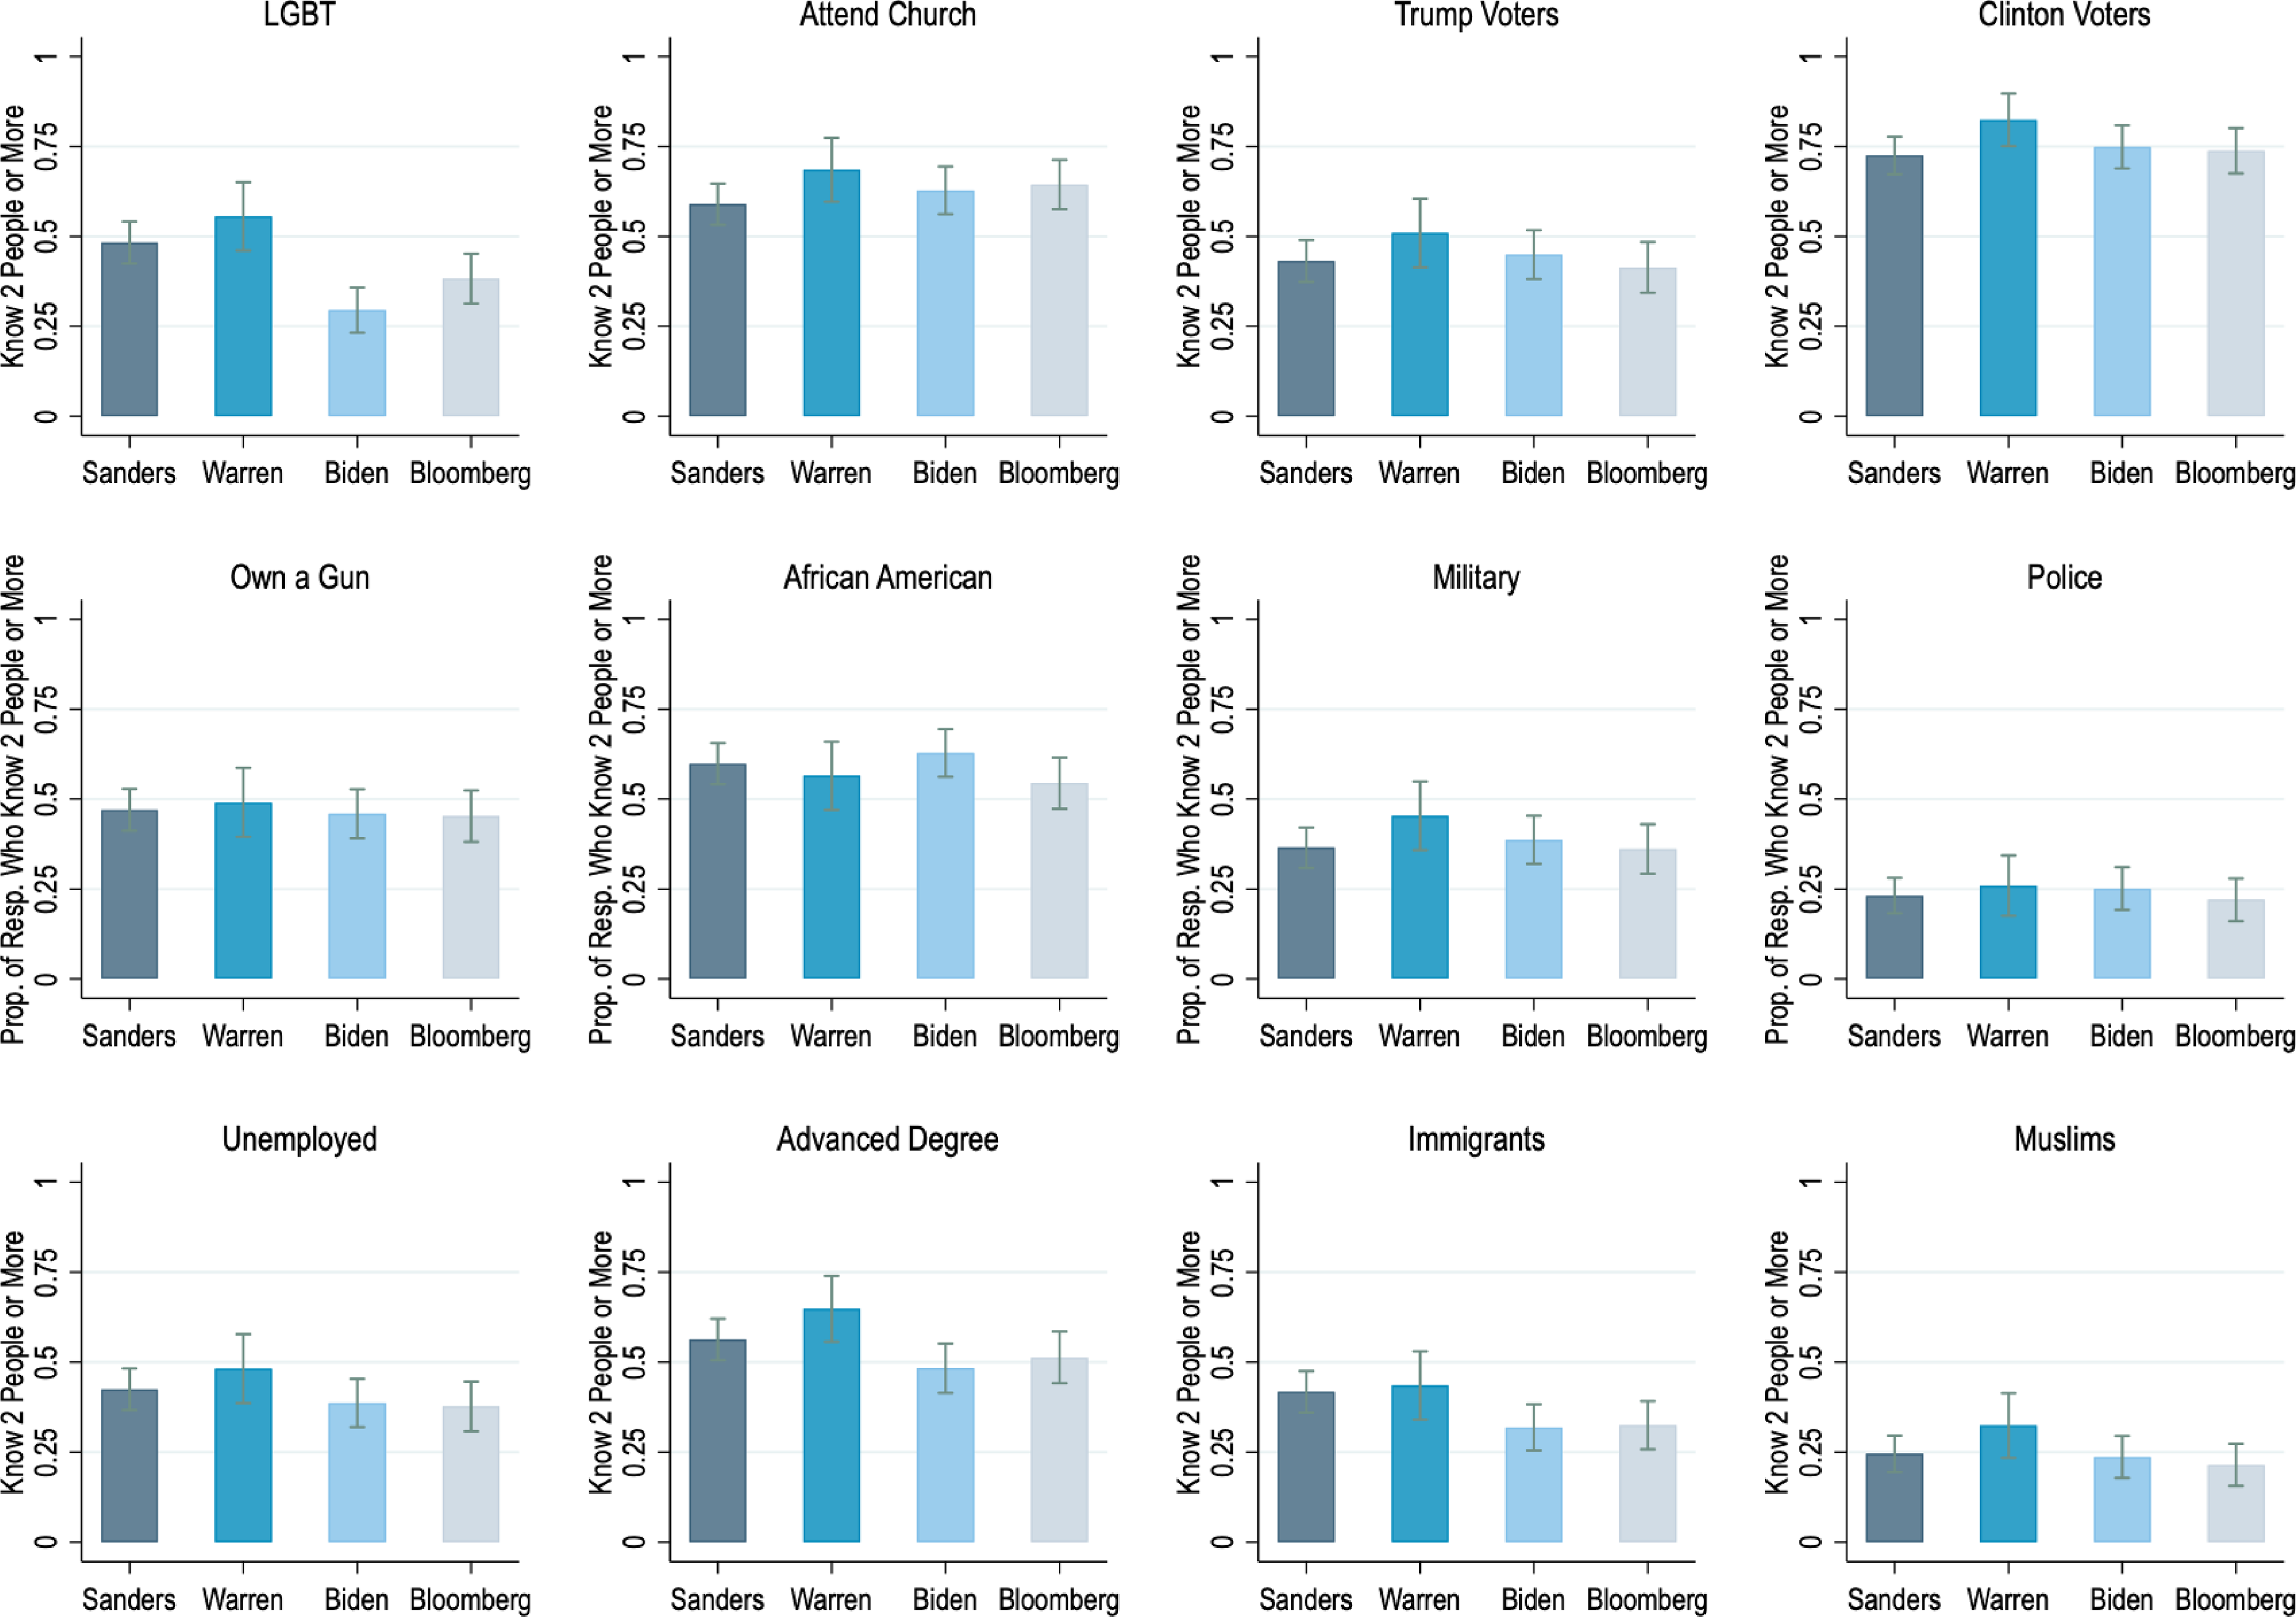
The differences between supporters’ reports are consistent with conventional wisdom about the candidates’ bases of support. For example, Warren supporters reported in the highest numbers knowing two or more acquaintances with advanced degrees (μOther − μWarren = −0.13, (−0.23, −0.03), ptwo-tailed = 0.01)—this jells with narratives about her strong support among educated white voters, particularly educated white women (Pew Research Report 2020). Likewise, Biden supporters provided the highest rates of knowing 2+ Black acquaintances, though this result is not significant at conventional levels (p = .15), as well as the lowest rates of knowing 2+ LGBTQ acquaintances (μOther − μBiden = 0.18, (0.10, 0.25), ptwo-tailed = 0.00). These are consistent with polling showing him as being buoyed by his ties to Obama and more conservative portions of the Democratic electorate (Pew Research Report 2020). Overall, Figure 4 communicates the kinds of individuals our respondents had more (e.g., churchgoers) versus less contact with (e.g., Muslims), and suggests some ways in which co-partisans are embedded in different social worlds.
A second take: The co-occurrence of groups in acquaintance networks
If “[p]rimary candidates create and mobilize constituencies within parties” (Popkin 1991: 19), we might expect different candidates’ supporters to have different societal groups in their acquaintance networks. Figure 4 provides some evidence of this (i.e., differential exposure to people with certain traits), but does not tell us about the potential proximities between categories. For example, if Biden was drawing from more conservative parts of the Democratic electorate, we might expect his supporters’ acquaintance networks to be populated by more African Americans, but also more churchgoers. Put differently, we would expect to see clustering in the responses across different traits/groups, and that these clusters would differ by supported primary candidate. Fortunately, we can examine exactly this using the same ARD battery.
Following McCormick et al. (2013), we treat the responses as bipartite—the data structure is respondents on the rows, and the groups they report contact with on the columns. We calculate (Kendall’s τ) measures of association between the groups (columns), which are used to calculate measures of Euclidian distance between the groups in individuals’ acquaintance networks. 6 These measures of distance—generated from the ARD responses—permit us to examine the proximity of different societal groups for our Democratic respondents. For example, do we see evidence that Biden supporters inhabit acquaintance networks characterized by the presence of both Black Americans and the religious? Do we see separation from Clinton voters in Sanders supporters’ acquaintance networks?
Figure 5’s dendrograms are created from the same ARD responses gathered from Biden, Bloomberg, Sanders and Warren supporters (February 2020). The dendrograms visualize hierarchical clustering in the data, and here should be read from left to right—groups are more proximate to one another in an acquaintance network if they appear on the same “branches” to the right of a diagram; the further left groups branch off the more socially distant they are from one another. The colors are used to help denote the branching (i.e., proximity) between groups. Another way to think about the results is as follows: Do individuals who report contact with more individuals from certain groups also report contact with more individuals from other groups? That is, how much do answers on the ARD battery cluster together, and how does this clustering differ between Democrats who support different candidates? Dendrograms of group proximity; acquaintance networks of supporters of Biden, Bloomberg, Sanders, and Warren. Note: (NSanders = 286; NWarren = 108; NBiden = 207; NBloomberg = 191).
The dendrograms help reveal real differences in the acquaintance networks of Biden, Bloomberg, Sanders, and Warren voters. In all four cases, “Clinton voters” branch off immediately, indicating larger social distance between this group and others in most Democrats’ acquaintance networks. That is, our respondents’ reports of knowing Clinton voters tend to be distinct from their reports of knowing people from other groups. If we scrutinize this result a bit more, we see intriguing variation across different candidate camps—for Sanders and Bloomberg supporters, Clinton voters are never “branched” with any other groups; they remain more socially distant from other groups. For Biden supporters, Clinton voters are placed in proximity with church goers and African Americans (same branch, on the right), suggesting closeness between these sub-populations in these acquaintance networks. Put differently, reports of knowing churchgoers, African Americans, and Clinton voters cluster for Biden supporters—when they know more individuals with one trait, they tend to know more individuals with the others. This is not the case for Sanders and Bloomberg supporters.
Interesting patterns also emerge when we look at the positioning of other groups. For Biden, Bloomberg and Sanders supporters, Trump voters appear closer to gun owners, meaning that when individuals report knowing more people with one trait, they tend to report similar numbers for the other. This does not appear to be the case for Warren supporters—in her supporters’ acquaintance networks gun owners are more socially proximate to those in the military, while Trump voters are fairly isolated (but if anything, are actually more proximate to individuals who have run for office, Muslims, and people in law enforcement). Warren supporters’ exposure to Trump voters does not track in the same ways with their exposure to individuals with other traits.
This picture of differences in the acquaintance networks of co-partisans becomes even clearer if we look at other groups: for Warren supporters, LGBT individuals are closer to African Americans and immigrants. For Bloomberg supporters, reports of LGBT acquaintances match up more closely with reports of exposure to Trump voters and gun owners. At the same time, for Biden supporters, knowing LGBT individuals tracks more closely with exposure to people who are recently unemployed and those with substance abuse problems (the same patterns emerge for Sanders’ supporters).
Conclusion: The disagreement we overlook matters
Using data gathered around the 2020 presidential primaries, we document variation in Democrats’ exposure to disagreement via their co-partisan discussion networks. Disagreement among Democrats emerges in frequency, opinion similarity, and vote choice. Likewise, we also find evidence that individuals sharing partisanship but differing in primary candidate support are embedded in differing (broader) acquaintance networks.
Most work on interpersonal disagreement in the American public has emphasized cross-partisan exposure; this makes sense given many literatures’ focus on general elections, and certainly resonates in an era characterized by affective polarization (e.g., Iyengar et al., 2019). However, given our findings among Democrats we urge scholars to (1) rethink what interpersonal disagreement means beyond partisanship, (2) measure and evaluate interpersonal disagreement during primary elections specifically, and (3) assess the role of networks in intraparty dynamics more generally. Specifically, future work should explore other elections, contexts, and methods to better operationalize intrapartisan disagreement.
We suspect that studying the nuances, precursors to, and dissipation of intraparty disagreement may help us better understand how and when interpersonal disagreement facilitates democratic functioning. In turn, this may open paths for more effectively addressing—and potentially mitigating—the interparty conflict and extreme affective polarization that plagues contemporary American politics. And, knowing more about the degree to which social networks matter in primary vs. general election contexts may advance our understanding of voter decision-making and of how candidate mobilization works across different corners of society.
Supplemental Material
Supplemental Material - The disagreement we overlook: Examining core and acquaintance networks in a presidential primary
Supplemental Material for The disagreement we overlook: Examining core and acquaintance networks in a presidential primary by Lauren Ratliff Santoro and Anand Edward in Research & Politics
Footnotes
Acknowledgments
We would like to thank participants at the University of Texas at Dallas’ Working Paper Series for their helpful feedback along with Curtis Bram, Sivaram Cheruvu, and Matthew Pietryka for their comments on earlier drafts.
Declaration of conflicting interests
The author(s) declared no potential conflicts of interest with respect to the research, authorship, and/or publication of this article.
Funding
The author(s) disclosed receipt of the following financial support for the research, authorship, and/or publication of this article: This work was supported by the University of Texas at Dallas and the University of Colorado Boulder.
Carnegie Corporation of New York Grant
This publication was made possible (in part) by a grant from the Carnegie Corporation of New York. The statements made and views expressed are solely the responsibility of the author.
Ethical statement
Supplemental Material
Notes
References
Supplementary Material
Please find the following supplemental material available below.
For Open Access articles published under a Creative Commons License, all supplemental material carries the same license as the article it is associated with.
For non-Open Access articles published, all supplemental material carries a non-exclusive license, and permission requests for re-use of supplemental material or any part of supplemental material shall be sent directly to the copyright owner as specified in the copyright notice associated with the article.