
Abstract
Numerous polls show most Republicans view the 2020 election as illegitimate, but we know relatively little about legitimacy perceptions among losing candidates’ supporters in past elections. I analyze 76 polls asking about the legitimacy of the 2000, 2016, and 2020 presidential elections. Even before 2020, the losing candidate’s supporters are much less likely to view the outcome as legitimate. Losers are about 60 percentage points less likely to accept the election in 2000, about 40 points less likely in 2016, and about 70 points less likely in 2020. Perceptions of legitimacy are typically higher than confidence in election results, and many voters express doubts about the vote count while still accepting the legitimacy of the result.
Introduction
Do Americans view the electoral system as legitimate? While the public’s views toward the legitimacy of political systems have long been a topic of interest to political scientists (Easton, 1965), studying legitimacy has become all the more important in the wake of the January 6th, 2021 attack on the US Capitol. Numerous polls show majorities of Republicans agree with Donald Trump’s claims that Joe Biden’s election was illegitimate. However, several questions remain about how the public perceives the legitimacy of presidential election outcomes.
First, are Republicans’ doubts about 2020 unusual relative to past elections? Although the Republican party has become synonymous with “the big lie,” it is important to understand if Democrats are also prone to questioning election results they dislike. Indeed, studies of related constructs such as trust in government (Anderson and Lo Tempio, 2002) and confidence in the vote count (Sances and Stewart, 2015) find members of both parties reacting to disappointing election results in a parallel fashion. If Democratic voters also see disappointing elections as illegitimate, there is a risk of Democratic candidates engaging in similarly demagogic behavior in future elections. And if losers have been questioning legitimacy for many years, we might question the need for electoral reforms meant to address a supposed legitimacy crisis. 1
Second, how do perceptions of legitimacy relate to confidence that votes were counted as intended? While several studies measure legitimacy using questions about the vote count, I argue voters could in theory accept the legitimacy of the result while still believing there were some issues with the vote count. If so, then voter confidence questions are an imprecise measure of legitimacy, and researchers interested in studying legitimacy should use more direct measures whenever possible.
Third, while Republicans’ survey responses echo Trump's rhetoric, it is not clear if losers’ rhetoric is a necessary cause of voters’ rejection of legitimacy (Reller et al., 2022). To show such rhetoric is not necessary, we would want to observe how perceptions of legitimacy change among losing candidates when the losing candidate does not deny the legitimacy of the results.
I assemble and analyze all available opinion polls asking about the legitimacy of presidential election results. Using the Roper Center’s iPoll archive, I identify 76 polls around the 2000, 2016, and 2020 elections asking about the legitimacy of the election outcome. Averaging across polls in each election cycle, I find legitimacy perceptions among the general public are high, with around 60% of the population viewing the election result as legitimate. Legitimacy perceptions are highest after the 2016 election, and in the single poll fielded after the 2004 election. I also find large partisan gaps in legitimacy perceptions after elections, with supporters of the losing candidate always less likely to view outcomes as legitimate. Partisan gaps are largest in 2020, at about 70 percentage points, but are also large in 2016 (40 points) and 2000 (60 points). Legitimacy perceptions are almost always higher than voter confidence, and responses to questions about legitimacy and confidence are imperfectly correlated.
The winner-loser gap in voter confidence
Analyzing all polls about perceptions of the vote count between 2000 and 2012, Sances and Stewart (2015) find a consistent “winner effect” whereby supporters of the losing (winning) candidate are much less (more) trusting in election results. Daniller and Mutz (2019) find similar results using panel surveys from the 2008, 2012, and 2016 elections. Also using panel surveys; Sinclair et al. (2018) and Levy (2021) both find significant “winner effects” in the 2016 election.
Not all studies have found such effects, however. Using the 2016 American National Election Study, Norris et al. (2020) conclude that conspiratorial attitudes and populist beliefs are key for understanding voter confidence, while the “often-found influence of partisanship and the winner-loser gap...are not supported” (119). And using a survey experiment prior to the 2020 presidential election, Carey et al. (2022) find that electoral “inversions”—cases where the popular vote and the electoral college outcomes diverge—depress Democrats’ trust even if a Democratic candidate wins.
Existing legitimacy measures are imprecise
Polls about the legitimacy of elections ask whether respondents agree or disagree that the outcome of a specific election was legitimate. For example, an October, 2020 Associated Press/NORC poll asks, “Do you think Joe Biden was legitimately elected president, or not?” Likewise, an October, 2004 CBS/New York Times poll asks, “Regardless of what you think of George W. Bush now, looking back to 2000, would you say George W. Bush legitimately won the 2000 presidential election, or not?” In contrast, many academic studies use questions asking if respondents believe votes were counted as intended. However, one could believe there were problems with the vote, without also believing that the problems were so great as to cast doubt on the outcome. Alternatively, one could reject the legitimacy of the result for reasons other than the accuracy of the vote count, such as the unfairness of electoral college system or biased media coverage. Partisans might also reject legitimacy for ideological reasons, viewing any ideologically distant candidate as illegitimate. Similarly, they might do so for strategic reasons if they believe such responses, in the aggregate, make it more difficult for the winner to govern and achieve their policy goals.
A handful of existing studies use more direct measures. Albertson and Guiler (2020) ask respondents if they will accept the election as legitimate if their preferred candidate loses. Similarly, Carey et al. (2022) ask respondents to imagine the 2020 election when the electoral college and popular vote do and do not align; they then ask respondents if they would view the winning candidate’s presidency to be legitimate. However, and as I show below, voter expectations of their legitimacy perceptions often diverge substantially from their actual post-election perceptions. Similarly, in their index of perceived electoral integrity, Clayton et al. (2021) include an item asking if respondents agree that “Elections in the United States are rigged in favor of [other party (randomized for pure independents)].” A drawback to this measure is that it asks about elections on average, and not any particular election.
Is losers’ rhetoric necessary for the winner-loser gap?
Prior to 2016, scholars largely overlooked the question of whether elite rhetoric undermines perceptions of electoral legitimacy, focusing instead on the role of individual-level factors (Bowler et al. 2015) and election results (Sances and Stewart 2015). This changed after the nomination of Donald Trump, who frequently raised doubts about election results. Sinclair et al. (2018) find a pre-election difference in confidence in election results between Clinton and Trump supporters, attributing this gap to the conflicting cues sent by each candidate during the campaign. Using a survey experiment fielded on the eve of the 2016 election, Albertson and Guiler (2020) show Democrats become less trusting when told that Russians might interfere in the election, while Republicans become less trusting when told Democrats might interfere.
In a multi-wave survey experiment during the 2020 campaign, Clayton et al. (2021) show that exposing voters to Trump's election-skeptical tweets decreases trust in the electoral system, while not undermining support for democracy or increasing support for political violence. Using a similar design fielded in the 2018 midterms, Berlinski et al. (2021) find messages about fraud decrease trust in elections, though not support for democracy more broadly.
Notably, trust in elections tends to differ significantly between partisans in the surveys examined above, even in the control group. One interpretation of these baseline differences is that elite cues are only a small part of the reason why partisans differ in their perceptions of electoral integrity. Testing the causal effect of elite cues is difficult using observational data, but it is possible to test whether cues are necessary by examining elections in which elite cues are absent. In a study that does just this, Reller et al. (2022) study perceptions of electoral integrity before and after the 2021 gubernatorial recall election in California. They find supporters of the failed recall effort did become less trusting, even though the leading replacement candidate immediately conceded without crying fraud. However, it is unclear whether these results would extend to presidential elections. Additionally, while Reller et al. measure voters’ beliefs about fraud and their satisfaction with the recall process, they do not directly measure whether voters view the outcome as legitimate.
Polls about the legitimacy of election outcomes
Polls used in the analysis by polling house and election cycle.

Questions along these lines continue to be fielded up until the Supreme Court's December 12, 2000 decision in Bush v. Gore determined the ultimate outcome, at which point polls shift to asking about actual rather than hypothetical perceptions. A December 15, 2000 ABC/Washington Post poll asks, “Do you consider (George W.) Bush to have been legitimately elected as president (in 2000), or not?” Pollsters continue to ask about the legitimacy of Bush's legitimacy throughout his first term, with a CBS/New York Times poll of October 30, 2004 asking: “Regardless of what you think of George W. Bush now, looking back to 2000, would you say George W. Bush legitimately won the 2000 presidential election, or not?” All in all, 38 polls ask about the legitimacy of the 2000 election either before or after the Court’s decision.
Only one poll, fielded in late November 2004 by CBS and The New York Times, asks if voters saw Bush’s 2004 re-election as legitimate. As shown below, the vast majority did, and with Bush’s winning of the popular vote, pollsters apparently concluded there was no longer any controversy worth asking about. Likewise, pollsters never ask about the legitimacy of the 2008 or 2012 elections. Only when Trump begins questioning the legitimacy of the forthcoming election is the public again asked this question. A September 13, 2016 Quinnipiac poll asks, “If your (presidential) candidate loses in November (2016), would you think that the outcome was legitimate or would you think that the election was rigged?” Six other polls ask similar questions prior to the election, and four afterward.
A total of 26 polls ask about the legitimacy of the 2020 election outcome. The first is an October 9, 2020 ABC/Washington Post poll, which asks “Regardless of whom you support, are you prepared to accept the outcome of the (2020) election as legitimate, or are you not prepared to do that at this time?” Two other polls are fielded prior to the election, and the remaining 23 are asked after. The most recent poll in my data is fielded by the Associated Press/NORC on October 10, 2022, and asks “Do you think Joe Biden was legitimately elected president, or not?”
Legitimacy perceptions among all Americans
Figure 1 plots the proportion of respondents answering that they would (if asked before the election) or do (if asked after) accept the result as legitimate. The horizontal axis is recoded to represent the number of days until/since the election outcome (for 2000, this is the December 12 Supreme Court decision). For each survey, I either compute the average using pollster-provided survey weights, or I report the weighted average from the publicly available tabulation.
3
Perceptions of the legitimacy of election outcomes among all Americans. Each point represents the proportion of respondents agreeing the election was legitimate in a particular poll. Lines are moving averages generated using linear regressions estimated separately for prior and after the election outcome. For 2000, “Days since election” is the days since the Supreme Court’s December 12, 2000 decision in Bush v. Gore.
Averaging across polls, about 70% of Americans anticipate they would accept the result of the election as legitimate prior to the Court’s decision in 2000. Immediately after the election, this drops to about 60%, and declines slightly over Bush's first term. Note the last point in this panel is the single poll asked about the 2004 election outcome in late November 2004. 4 With the issue of the electoral college removed, perceptions of legitimacy returned to about 80%.
In 2016, anticipated legitimacy was around 60%–70% prior to the election, and increased to 80% afterward. While there are only four post-election polls asking about legitimacy, there is a decline in perceived legitimacy over Trump’s term. In 2020, there are only three pre-election polls, but they suggest a decline in anticipated legitimacy as the election draws nearer. After the election, legitimacy perceptions increase to about 60%, with no noticeable decline over Biden’s term.
Partisan differences
Figure 2 plots these proportions for partisan subsamples. When available, I present proportions among both those identifying with a party, as well as those reporting voting for a party’s candidate.
5
There are typically large partisan gaps both before and after each election, and the gaps often flip after the outcome is known. In 2000, for example, about 50% of Democrats say they would accept the outcome as legitimate, and this declines to about 30% afterward. In contrast, about 90% of Republicans say they would or do accept the outcome both before and after. Thus, the “winner-loser gap” after the election is about 60 percentage points. Notably, this gap emerges even though the losing candidate, former Vice President Al Gore, conceded the election after the Court’s decision and did not question its legitimacy. Perceptions of the legitimacy of election outcomes among partisans. Filled circles rep-resent proportions among partisan identifiers; hollow circles represent proportions among those voting for the party’s candidate.
Prior to the 2016 election, about 80% of Democrats anticipate accepting the election results, versus about 50% of Republicans. After the election, Democrats’ perceived legitimacy drops by about 20 points, and is as low as about 40 points in the two polls conducted in 2017. Virtually all Republicans accept Trump’s election as legitimate, so the winner-loser gap after the 2016 election is about 40 points. Again, this gap emerges even though Hillary Clinton emphasized the importance of accepting the result prior to the election and then immediately conceded. 6
Democrats are more likely than Republicans to anticipate accepting the results prior to the 2020 election, though both groups appear to become less trusting as the election draws nearer. Immediately after the election, almost all Democrats accept the result, while only about 20% of Republicans do. As Biden’s term goes on, the winner-loser gap narrows somewhat, and it is more common to see 30% or more of Republicans accept the result into late 2021 and 2022. 7 Thus, the winner-loser gap after the 2020 election is about 70 points. This is certainly larger than the gaps observed in 2000 and 2016. However, it is notable that gaps of 40 to 60 points were observed in prior elections in which the losing candidate did not cry fraud.
To estimate whether these differences in winner-loser gaps across elections could arise by chance, I estimate a regression of the form
I estimate this regression on a data set of post-election polls, where for each poll I observe the proportion accepting the election as legitimate among different partisan subgroups. The unit of observation in this regression is the poll-partisan subgroup. 8 For the 2000 election, I code Democrats and those voting for Gore as voting for the loser, and Republicans and those voting for Bush as not voting for the loser; I code respondents in 2016 and 2020 similarly. To avoid overstating the sample size, for polls where I observe proportions by both partisanship and vote choice, I average the two proportions. I use heteroskedasticity-robust standard error estimates.
Regression results.
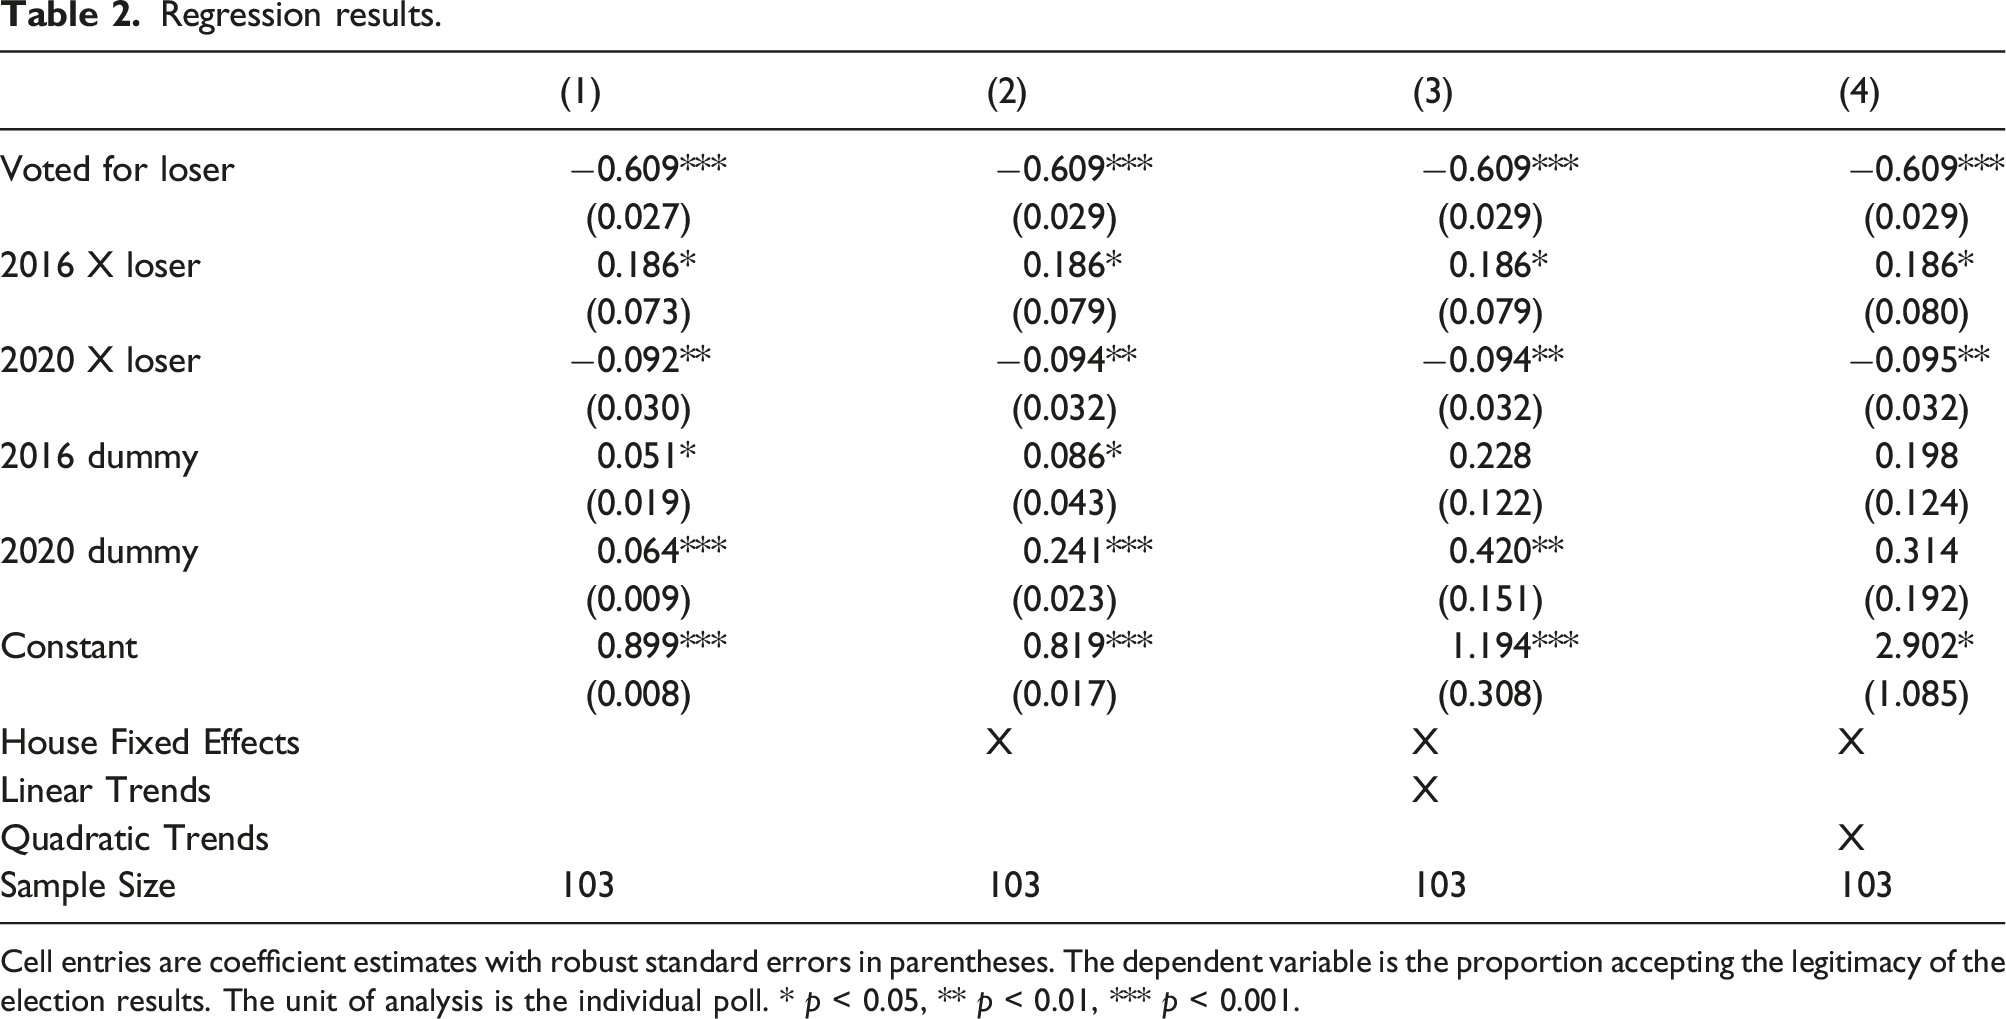
Cell entries are coefficient estimates with robust standard errors in parentheses. The dependent variable is the proportion accepting the legitimacy of the election results. The unit of analysis is the individual poll. * p < 0.05, ** p < 0.01, *** p < 0.001.
Comparison to voter confidence
Perceptions of legitimacy tend to be much higher than confidence in the vote count. According to data reported in Sances and Stewart (2015) and Stewart (2022), in the 2000 election, about 50% of Americans say they were “very confident” that votes around the country were counted as intended, compared to the roughly 60% (in Figure 1) who say the election outcome was legitimate. In 2004, the proportion saying they were very confident is 40%, but the proportion saying the election is legitimate is 80%. In 2016 and 2020, the proportions saying they were very confident are 20%, while the respective proportions accepting the election’s legitimacy are around 40–60 points higher. Respondents may believe there were issues with the counting of the vote, but this does mean that they reject the election outcome wholesale.
Cross-tabulation of individual responses to legitimacy (rows) and voter confidence questions (columns).

Cell entries are frequencies with table percentages in parentheses.
In the Supplementary Material (Section 3), I also compare trends in legitimacy versus trust in the vote count in subset of my polls where both questions are asked. In the 16 polls (13 in 2000 and three in 2016), legitimacy perceptions are higher in almost all cases, though the gap between the two is smaller in 2016 compared to 2000. In the 13 polls with microdata available, the correlations range from 0 to 0.6 with an average of 0.22.
Why don’t voters see elections as legitimate?
The losing candidate in 2020 made claims about voter fraud to justify their rejection of legitimacy. While the losing candidates in 2000 and 2016 did not challenge legitimacy, it is interesting to consider the drivers of voters’ rejection. To do so, I focus on the 20 polls that ask about possible determinants: beliefs in voter fraud (16 polls); support for reforming the electoral college (8); and beliefs in election hacking (2). In the Supplementary Material (Section 4), I show Democrats are more likely to believe in voter fraud after the 2000 election, while Republicans are more likely to believe in fraud before the 2016 election and before and after the 2020 election. Democrats are more likely to endorse reforming the electoral college in 2000 than they are to believe in fraud; questions about the electoral college are not asked in any of my polls for 2016 or 2020. Only two of my polls ask about concerns regarding election hacking, both before the 2016 election; Democrats are more concerned in one, and Republicans more concerned in another.
I also examine bivariate correlations between these items and legitimacy perceptions in the 14 polls with microdata available. While Democrats are highly supportive of reforming the electoral college, beliefs in voter fraud in 2000 are more highly correlated with legitimacy perceptions in that election (r = 0.19 vs r = 0.29). This suggests beliefs about fraud, rather than concerns about the electoral college, have historically driven rejections of legitimacy for losers in both parties. Given the observational nature of these data, however, these results should been as tentative.
Conclusion
Many observers worry Americans are becoming more skeptical of election results, yet there is little systematic data on this question. I have shown that doubts about the legitimacy of elections also existed in the 2000 and 2016 elections. Moreover, while legitimacy is often measured using questions about the vote count and the broader electoral system, explicitly asking voters whether they accept particular election results as legitimate can yield different results. In particular, perceptions of electoral legitimacy tend to be much higher than perceptions of voter confidence. Finally, and consistent with the findings of Reller et al. (2022), doubts about legitimacy emerge even when the losing candidate does not question the result.
Large portions of survey respondents will say an election is illegitimate, but only much smaller portions go on to engage in protests or acts of political violence. Future work should explore whether and how legitimacy perceptions translate into future political behavior. Additionally, past research has shown Americans’ confidence in the state and local vote count is much higher than confidence in the national vote. As all the polls examined in this paper ask about the legitimacy of national elections, future work could study perceptions of legitimacy in subnational elections.
Footnotes
Declaration of conflicting interests
The author(s) declared no potential conflicts of interest with respect to the research, authorship, and/or publication of this article.
Funding
The author(s) received no financial support for the research, authorship, and/or publication of this article.