
Abstract
We ascertain whether citizens want to have smart ballots, that is, whether they appreciate having the possibility to express some support for more than one option (expression across options) and to indicate different levels of support for these options (expression within options). We conducted two independent yet complementary survey experiments at the time of the Super Tuesday Democratic primaries to examine which voting method citizens prefer, one with the real candidates in the states holding Democratic primaries and one with fictitious candidates in the whole country. In both surveys, respondents were asked to vote using four different voting rules: single, approval, rank, and point (score). After they cast their vote, respondents were asked how satisfied they were using each voting method. The findings are consistent in both studies: the single vote is the most preferred voting method. We show that this is a reflection of a status quo bias, as citizens’ views are strongly correlated with age.
Introduction
Electoral systems are a crucial component of representative democracy as they determine how voters can express their preferences, how ballots are counted and whether their outcomes are accepted or not. Electoral reform and in particular, the ballot type, is a recurring issue in the United States with 22 jurisdictions that have already adopted ranked choice voting (RCV) in recent elections and 53 jurisdictions expected to use RCV in an upcoming election. 1 Given that voting methods are on the political agenda and increasingly changing, understanding citizens preferences for different types of ballots is increasingly important. This study builds on existing work that examines citizens views on electoral rules (Heller, 2021; Banducci and Karp, 1999; McCarthy and Santucci, 2021; Nielson, 2017; Plescia et al., 2020; Renwick, 2010) and whether the ballot structure has an impact on citizens’ satisfaction with democracy (Farrell and McAllister., 2006). Yet, our study is the first to systematically analyze citizens’ attitudes towards different voting methods, based on two separate surveys, one with real candidates in the context of a real election in the states holding the Super Tuesday Democratic primaries and one with fictitious candidates in the whole country. In both surveys, respondents were asked to directly vote for candidates of their choice. We examine whether Americans appreciate having the opportunity to vote using “smarter ballots,” “making room for registering more than one judgment per voter per contest” (Maloy, 2019, 19).
Electoral systems have three components dealing, respectively, with the type of constituency, the type of ballot, and the electoral formula to transform votes into seats (Blais, 1988). In this research note, we focus exclusively on the ballot by examining citizens’ views about four ways of casting their vote: single, approval, rank, and point (or score). The reference point is the single vote where citizens are invited to vote for one single candidate. In the American context, plurality is the voting method that Americans are most used to.
The other three options entail that voters have multiple votes. Under approval voting, voters are invited to vote for as many candidates as they wish, that is, all those that they “approve.” This rule gives people more freedom in the sense that they still have the opportunity to vote for a single candidate if they choose to, but they are allowed to convey their “approval” of all the candidates that they like or trust. Approval voting has been proposed by political scientist Brams and Peter (1978). It has been adopted by learned societies such as the Social Choice and Welfare and the Mathematical Association of America and for internal elections in some parties like the Green Parties of Texas and Ohio and the German Pirate Party. It is now used for local elections in the city of Fargo, North Dakota. Approval voting allows voters greater freedom and flexibility.
The third option is ranked choice voting. Voters are invited to rank the candidates on an ordinal scale from their first, second, third…preferences. 2 The obvious advantage of ranked voting is that it allows people to express their full set of preferences. Ranked voting also allows greater freedom than approval voting. Both systems allow voters to distinguish between the candidates they do and do not approve. With ranked voting the person can additionally indicate which candidates they (dis)approve more or less. 3
The last option is point or score voting. Under such a rule, voters give each candidate a score (or points) and the candidate with the highest number of points (or average score) is elected. The specific system that we use in our study is one where voters can give 0/1/2/3/4/5 votes to each candidate. This ballot gives voters maximum flexibility. Not only can they rank the candidates, but they can indicate the intensity of their preferences by giving very low or high scores, and they can also reveal their indifference by giving the same number of points to different candidates. Some form of point voting was used for the multi-round election of the Doge in the Republic of Venice. It is widely used in sports such as gymnastics and skating where judges are asked to provide a 0 to 10 score for each performance.
There is a clear pecking order between these four voting methods. The option that allows the greatest freedom of expression is the point system, followed by ranked choice, approval voting, and the single vote. If people value superior expression across and within options (Maloy, 2019, 82), they should give the highest rating to point voting and the lowest to single vote.
Our first goal is thus to determine whether citizens want to have smart ballots, that is, whether they appreciate having the possibility to express some support for more than one option (expression across options) and to indicate different levels of support for these options (expression within options). Whether people really want to have that possibility is an open question. On the one hand, it makes sense to assume that people want to have smarter ballots, which give them the opportunity to express their views about the candidates in a richer fashion. On the other hand, it is well established that many voters prefer simple decision rules to obviate the need for arduous processing of information (Sniderman et al., 1991). Therefore, we cannot rule out the possibility that most citizens do not really care about whether they have smarter ballots or not. They just want the ballot to be as simple as possible. If that is the case, they would like the single vote the most and the point vote the least.
People may also have a status quo bias. They may come to believe that the voting method that they know and are familiar with is the best, simply treating existence and longevity as prime facie evidence of goodness (Eidelman and Crandall, 2012). The status quo bias has been examined most specifically in the case of referenda (Christin et al., 2002; Hessami and Resnjanskij, 2019; Nadeau et al., 1999). Indeed, research shows that voters are more likely to reject propositions that are more complex and to opt for the status quo (Hessami and Resnjanskij, 2019). If people have a status quo bias, they should, then, prefer the single vote, which is the most common voting method in the United States, and they should reject all other options.
In short, different theories lead to different predictions about which voting method will be preferred by most citizens. If people value free and rich expression, they should support the point system (and dislike the single vote). If people value simplicity, the order of preferences should be reversed. If they have a status quo bias, they should prefer the single vote over each of the other options. These theories also have different predictions about which groups should be most favorable to the various options. If it is basically a choice between freedom of expression and simplicity, we would expect the better educated to prefer smart ballots and the less educated to prefer simple ones. Education is a crucial characteristic that should mitigate the effort to understand complex tasks (Gerber and Lupia, 1999). 4 If there is a status quo bias, we should observe a stronger preference for the single vote among older citizens, who have developed greater familiarity with the existing way of voting. 5 That status quo bias among older citizens would be consistent with the finding that conservatism tends to increase with age (Truett, 1993).
The predictions that we wish to test are the following: H1: Voters value richness of expression. As a consequence, the point system is the preferred voting method and the single vote is the least liked. H2: Voters value simplicity. As a consequence, the single vote is the most popular way of voting and the point system is the least popular. H3: Voters value the status quo. As a consequence, the single vote is preferred over all other options. H4: The choice is between freedom of expression versus simplicity. As a consequence, the better educated prefer the point system and the less educated the single vote. H5: There is a status quo bias. As a consequence, preference for the single vote is strongest among the elderly.
Data and methods
We conducted two separate but complementary survey experiments in the United States, with two independent samples, during the Democratic primaries between February 14 and 23 February 2020. In each study, we asked citizens to vote using four different voting methods (single, approval, rank, point) and to indicate how much they like each system.
Study 1 refers to real candidates during a real election, the Super Tuesday Democratic primary; only citizens eligible to vote in the Democratic primaries were able to participate. The candidates on the ballot were the six most prominent ones at the time of the survey: Joseph Biden, Michael Bloomberg, Pete Buttigieg, Amy Klobuchar, Bernie Sanders and Elizabeth Warren.
In study 2, we use hypothetical candidates which allow us to measure the views of the entire US population. The names of the candidates are fictional and were chosen to vary in both gender and ethnicity. Respondents were given information on the candidates’ age and policy priority (see Appendix A). 6 Doing the survey with both real candidates in the context of a real election and hypothetical candidates in the whole country is important as it also allows us to ascertain the robustness of our findings.
The questionnaire and design are exactly the same for both studies. The two surveys were administered online, at the same time though independently, on quota samples representative of the US population by gender, age, level of education and State. 7 For study 1, only voters in the 14 states that held a primary during Super Tuesday were eligible to participate. The sample size was 2390 for study 1 and 2541 for study 2.
In both studies, people are asked to vote successively four times, with the same candidates, using each of the four voting methods. The order in which the voting methods appeared is randomized. Evaluations of the four voting methods were tapped in two different ways. First, respondents were invited to indicate how satisfied, on a 0 to 10 scale, they were with that way of voting right after casting their vote with a given system. Second, after they had cast their vote four times with all four systems, they were asked which way of voting they prefer.
Results
Figure 1 presents the distribution of responses to the questions asked immediately after voters cast their vote for each system. Ratings are normalized to take into account the fact that some respondents systematically use higher (or lower) scores. Each score given by a respondent to a given system is divided by the total scores given to the four systems and multiplied by 10. For instance, for a person giving ratings of 8, 8, 4, 0, her normalized scores are 4, 4, 2, 0 (each rating being divided by the total of 20 and then multiplied by 10). In this way, the sum of ratings for the four systems equals 10 for each respondent, and the average rating is 2.5.
8
Mean ratings of the four voting methods.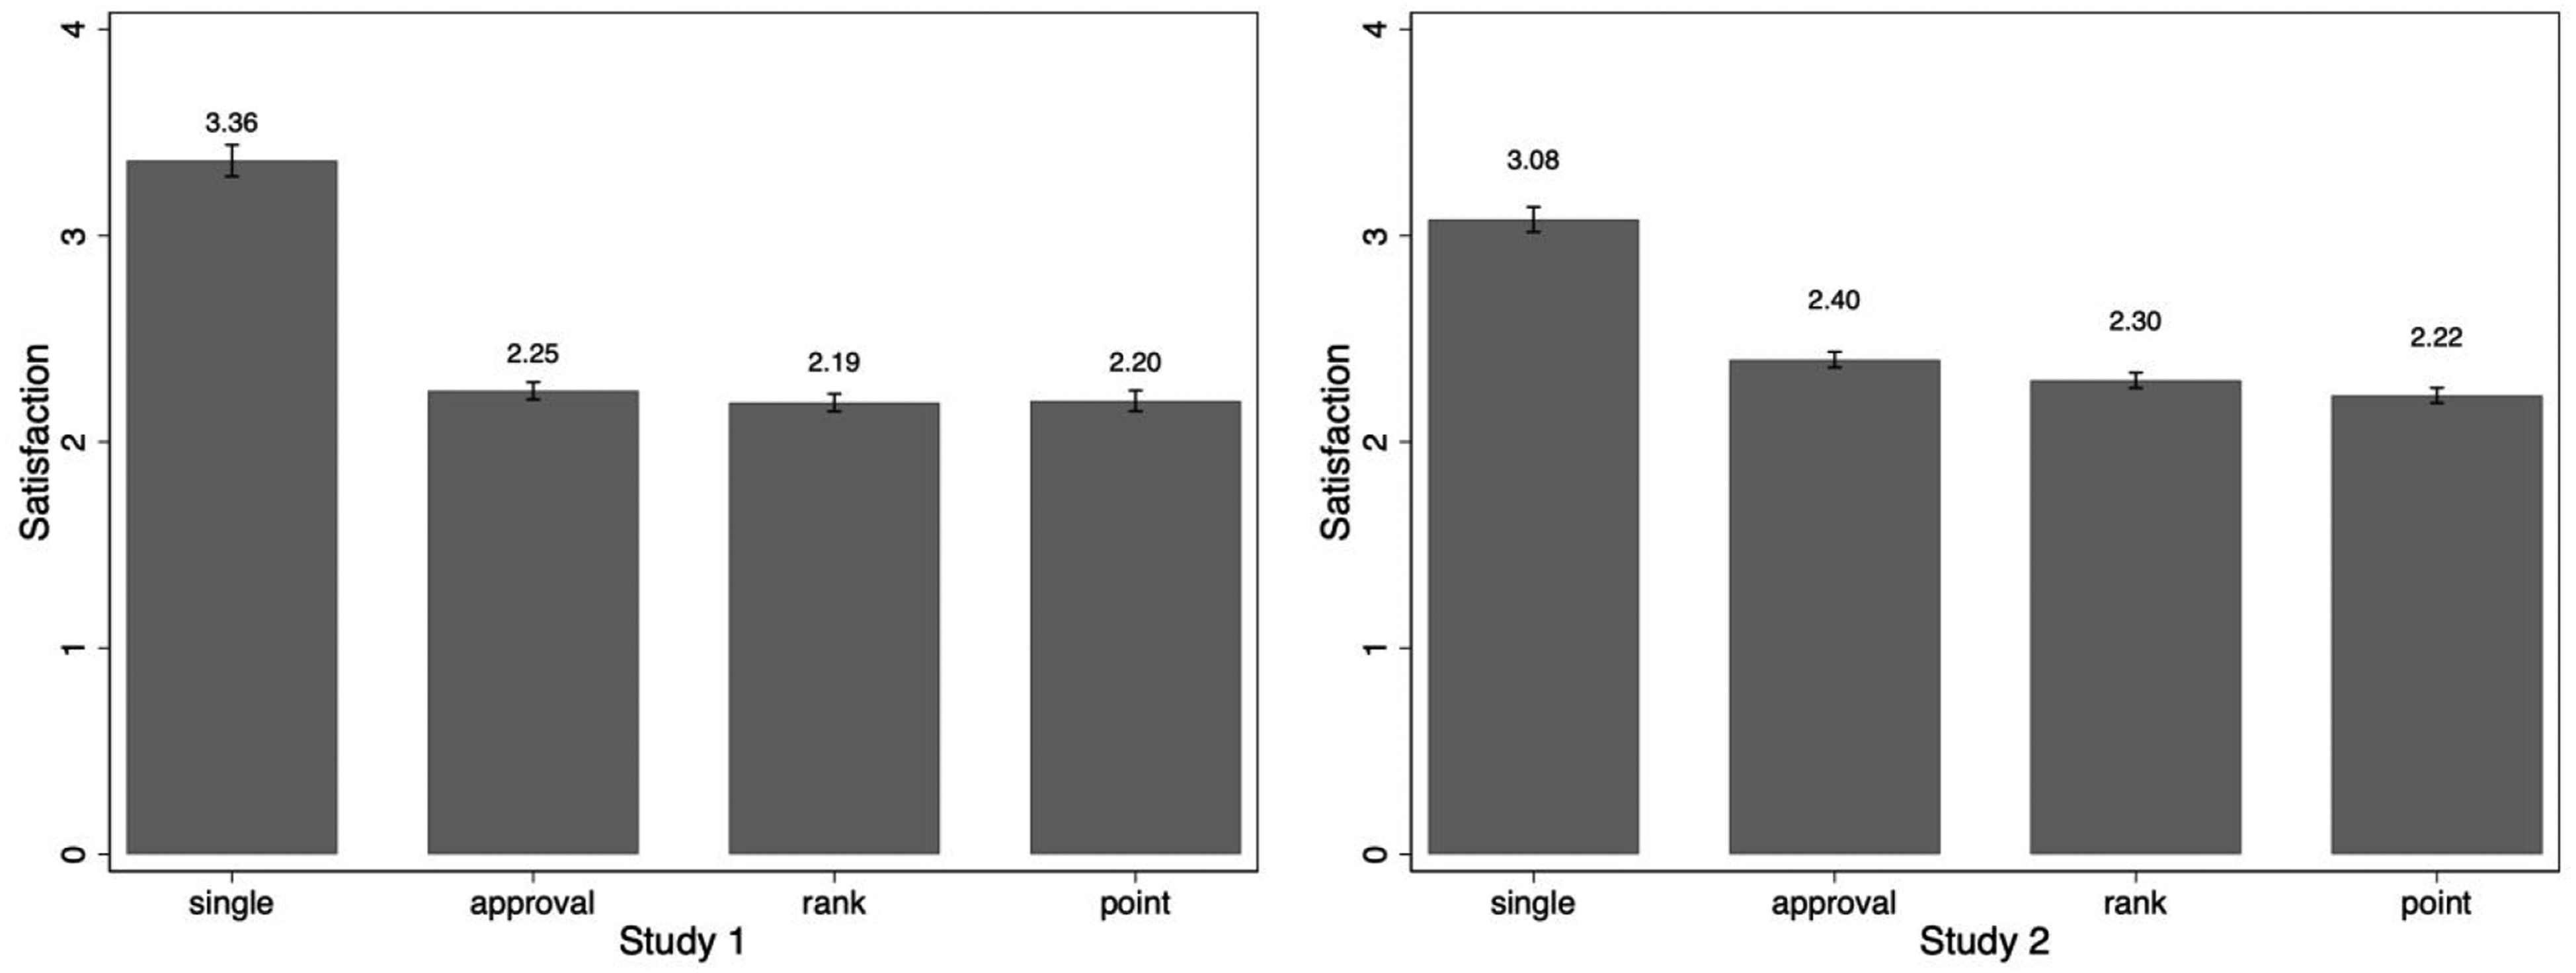
Mean rating is 3.36 and 3.08 for the single vote in study 1 and 2, respectively, compared to between 2.19 and 2.40 for the three other options, with little difference between these three for both study 1 and study 2. In line with both hypotheses 2 and 3, the single vote is the most popular way of voting. Clearly, however, the contrast is between the single vote and the three “new” systems, not between “simple” and “complex” methods, which supports hypothesis 3, not hypothesis 2.
Figure 2 shows the percentage of voters choosing each voting method at the end of the survey. In both cases, more than 60% of the respondents select the single vote and less than 20% each of the three new options. The pattern of preferences is the same as shown in Figure 1 but the contrast between the single vote and the new voting methods is starker. This reflects the fact that many respondents give similar ratings to the various options; 46% in study 1 and 47% in study 2 have tied first preferences, that is, they give their highest ratings to at least two options. Furthermore, these ties usually include the single vote and most of the time people choose the one they are familiar with, that is, the single vote. Which voting method is preferred?
Let us now consider the respondents’ characteristics that are associated with their ratings of the four systems. The dependent variables are the normalized ratings given to the four voting methods. The key independent variables are age and education and both are continuous. Age is measured in years from 18 to 98 and education is measured in levels of education, from least educated to most (See Appendix B for the full list of levels). Our models also include gender (1 = female), race (a set of dummy variables for each race), party identification (from strong Democrat to strong Republican), ideology (from very liberal to very conservative), and finally whether the individual personally had experience with ranked voting, that is, had they ever voted with a ranked ballot. 9 Some states in the United States use ranked choice voting for local or state-level elections and the single vote in Congressional elections giving voters experience with different rules. We control for prior experience with rank choice voting because this may inform citizen preferences for elections. All independent variables are rescaled from 0 to 1. We include state fixed effects. Appendix B shows descriptive information about all variables.
Figure 3 presents the coefficients of the linear regression models for evaluations of the single vote with respect to our two central variables, age and education. Full results are shown in Appendix C.1.
10
The findings are easy to summarize. Evaluations are unrelated to education in both studies. Hypothesis 4 is not confirmed. We therefore conclude that people’s judgments about voting methods are not shaped by the importance they attach to freedom of expression versus simplicity. Normalized evaluations of the single vote.
Mean rating given to the four voting methods by those aged 18 to 24 and 65 and over.

These findings strongly suggest that the single vote is the most liked system because of a status quo bias and not because it is perceived to be the simplest. The fact is that age is a powerful factor while education is not, which is consistent with that interpretation. So is the fact that the dominant contrast is between the single vote and the three “new” options. The status quo is preferred by about everyone except the youngest, who are more open to other ways of voting, and those who have already used another voting method (ranked ballot).
We also examined, as robustness checks, whether respondents’ evaluations are influenced by their ratings of the various candidates (see Appendix E), whether they may have experienced fatigue during the survey experiment (which motivated us to control for order effects in Appendix F) and whether the very first system that each respondent was exposed to was evaluated differently (see Appendix G). Republican identifiers evaluate the single vote more positively while disliking the other systems, there is some evidence that the impact of age is more important among Republicans but there is no evidence of an interaction between partisanship and prior use (see Appendix H). In all these robustness checks, the results for the variables of interest (age and education) do not change.
Conclusion
In most American elections, people are asked to indicate which one candidate they wish to support. This is the single vote. However, there are other ways of voting: people may indicate which candidates they approve, they may rank order the candidates or they may indicate how much they like each candidate by giving points. In this study, we examine whether citizens would like to express their opinions in a richer fashion than through the existing single vote. To that effect we conducted two independent surveys, one with real candidates in a real U.S. primary and one with fictitious candidates in the whole country.
Our main finding is that there is no strong demand for changing the existing way of voting. At the same time, resistance is not very strong either. More importantly, resistance does not appear to stem from a taste for simplicity, as ratings of the various voting methods are not related to education. Support for the single vote is rather the reflection of a status quo bias, as it is strongly correlated with age. A strong preference for the single vote is to be found among older respondents. Younger Americans are more open to new approaches. This might also be because younger Americans are less satisfied with politics and democracy, leading them to be more open to electoral reform (McCarthy and Santucci, 2021).
The implication is that support for reform of the voting method is unlikely to be based on frustration not to be able to express one’s views in a more fine-grained fashion. This does not mean that the reform movement has no future. On the one hand, many more Americans are likely to become familiar with ranked voting in the years to come, which is bound to weaken the status quo bias. On the other hand, some of the arguments in favor of reform pertain to its effects on the supply of candidates and polarization. It remains to be seen how people react to these arguments. Further research is needed to take into account these other considerations.
Supplemental Material
sj-pdf-1-rap-10.1177_20531680211062668 – Supplemental Material for Do people want smarter ballots?
Supplemental Material, sj-pdf-1-rap-10.1177_20531680211062668 for Do people want smarter ballots? by André Blais, Carolina Plescia and Semra Sevi in Research & Politics
Footnotes
Acknowledgements
The authors thank New America, the Electoral Reform Research Group, and Arnold Ventures for their generous financial support that enabled the data collection in this research. They also thank the participants at the Electoral Reform Research Group Research Development Conference for their helpful comments.
Authors Note
The authorship order is alphabetical. All authors share first authorship.
Declaration of conflicting interests
The author(s) declared no potential conflicts of interest with respect to the research, authorship, and/or publication of this article.
Funding
The author(s) received no financial support for the research, authorship, and/or publication of this article.
Correction (March 2025):
Supplemental material
Notes
References
Supplementary Material
Please find the following supplemental material available below.
For Open Access articles published under a Creative Commons License, all supplemental material carries the same license as the article it is associated with.
For non-Open Access articles published, all supplemental material carries a non-exclusive license, and permission requests for re-use of supplemental material or any part of supplemental material shall be sent directly to the copyright owner as specified in the copyright notice associated with the article.