
Abstract
Do Republican and Democratic politicians hold the same perceptions about the demographic composition of their district? We test this question by asking state legislators about the size of five key demographic groups in their district and compare their responses to the actual measures. We find that legislators hold misperceptions about some of their district demographics, but not those related to race and ethnicity. Significantly, legislators’ perceptions of their district’s demographics are not polarized along party lines. Misperceptions exist but these are not explained by party affiliation. On a positive note, these results suggest there can be a basis for common ground among politicians on factual matters.
Introduction
Do Republican and Democratic legislators hold the same perceptions of what their constituents look like, or do partisan biases also influence legislators’ beliefs about their districts’ demographics? Although political scientists have focused on measuring officials’ knowledge about constituents’ preferences (Miller and Stokes, 1963; Broockman and Skovron, 2018; Hertel-Fernandez et al., 2018), Fenno (1978) reports that legislators regularly view their districts in terms of demographic groups, such as race, religion, homeownership, and employment. For example, one legislator that Fenno interviewed described their district as being “far-flung and culturally rural—not blue-collar like Dayton or Akron or Gary. It has very few blacks. . .” (p. 4). Another described their district as follows: “It’s all white. There are few blacks, maybe 2%. Spanish surnamed make up about 10 percent. Traditionally, it’s been a district with a high percentage of home ownership. . . Economically, it’s above the national average in employment. . .” (pp. 4–5).
Politicians’ perceptions about the size of the groups in their district may play an important role in how they represent their constituents (as Fenno argues) because these views can be a shortcut to overcome the many information limitations they face in office (Kingdon, 1981). Legislators likely benefit from knowing what their constituents think about specific issues that are under consideration but lack the resources to constantly conduct public opinion polls given their high costs in terms of both time and money (Butler and Nickerson, 2011). However, knowledge about district demographics, which can be gained through many means including for free from the United States (US) Census, may allow politicians to make an informed guess as to what constituents want and to vote in ways that promote the interest of their constituents (Adler et al., 2018).
Given the potential importance of politicians’ views of their district, we asked state legislators from both parties to estimate the size of five groups in their own district: blue-collar workers, homeowners, African Americans, Latinos, and low-income residents. These groups are among those that legislators mentioned to Fenno when describing their districts (1977, ch. 1), and they continue to be politically salient today – for example, on homeowners and poverty, see Ansell (2014); on race, see Hutchings and Valentino (2004); and on blue collar workers and low-income individuals, see Manza and Brooks (1999). We then compared legislators’ perceptions to the actual census data.
We find that Republicans and Democrats do not systematically differ in how they perceive the demographics of their district. These results even hold if we limit the analysis to the demographic characteristics of voters in their district. Though we fail to find partisan divergence in state legislators’ perceptions of their district, we do find that some legislators hold inaccurate perceptions about the size of some groups in their districts. On average, legislators are generally accurate in their estimates of the size of minority populations, but they overestimate the percent of blue-collar workers and people below the poverty line while exhibiting a regression towards the mean pattern in their perception of homeownership rates.
Should we anticipate partisan differences?
Ex-ante, it is not clear whether we should anticipate Republican and Democratic state legislators to hold different views about the demographic composition of their constituents. There are at least three reasons why we might expect to see partisan differences in their perceptions. First, Democrats and Republicans in the mass public disagree about politically relevant facts (Bartels, 2002; Jerit and Barabas, 2012) due to motivated reasoning (Taber and Lodge, 2006; Gaines et al., 2007) and the “perceptual screen” of partisanship (Campbell et al., 1960). Because politicians are not above psychological biases (Sheffer et al., 2018), including biases that can lead to partisan differences in views about their constituents (Butler and Dynes, 2016; Butler et al., 2017), it could reasonably follow that state legislators will exhibit similar biases as the general public about politically relevant facts such as the demographic characteristics of their constituents.
Second, politicians may be (mis-)using informational shortcuts in ways that lead Republicans and Democrats to hold different perceptions about their districts. Just as voters use informational shortcuts to make complex voting decisions (Popkin, 1991; Lupia, 1994), legislators also use shortcuts on decisions involving legislative proposals (Kingdon, 1981). However, cues can lead people to reach the wrong conclusion (Dancey and Sheagley, 2012), and prior research shows that politicians regularly rely on biased cues to learn about their constituents, including information from interest groups (Hertel-Fernandez et al., 2018) and communication from constituents who may not be representative of their district at large (Broockman and Ryan, 2016). These cues can be strong enough to change politicians’ votes (Bergan and Cole, 2015) and could affect their perceptions about their district’s demographics, leading officials to believe their district is more like the non-representative sample of constituents who contact them.
Election results are another cue that could lead politicians to overestimate the size of groups that form their electoral coalition. Though many factors influence state legislative elections (Rogers, 2016), it is possible that elected officials assume their victory is largely based on the size of groups in their electoral coalition and that the groups in their coalition are larger than those of the opposition. Thus, winning an election may lead office holders to overestimate the size of groups that are part of their natural electoral coalition.
Third, the finding that Democratic and Republican officials and candidates disagree about the policy preferences of their constituents (Broockman and Skovron, 2018; Hertel-Fernandez et al., 2018) could be a symptom of systematic differences in politicians’ views of their constituents’ demographics. Though scholars have identified some mechanisms that contribute to these partisan misperceptions, an important but unexamined explanation is that these officials diverge in their perceptions about the demographic composition of their district, leading Republicans to believe their constituents hold more conservative issue positions than they actually do.
In contrast, there are several arguments for why Democratic and Republican state legislators’ views of their districts may not diverge along partisan lines. First, politicians’ reelection motivation may provide incentives to learn the demographics of their district because this knowledge can help legislators make informed inferences on a broad range of issues. Though nationwide and statewide polls are common, officials representing local governments and districts smaller than states, such as the state legislators examined in this study, rarely have accurate public opinion data to rely on (Butler and Nickerson, 2011). This makes knowledge about district characteristics all the more important for gauging public opinion and identifying “inattentive publics” that may be electorally activated (Arnold, 1990, 68). This same logic is part of what undergirds the use of Multi-level Regression and Poststratification models in political science to estimate district opinion (e.g., Lax and Phillips, 2009; Tausanovitch and Warshaw, 2013).
Additionally, demographic data are much easier to obtain than public opinion data. Just as we were able to find this information through the US Census Bureau, state legislators can do so as well. Finally, though partisans often disagree about politically relevant facts, these differences may not reflect sincere beliefs but, rather, opportunities for partisans to “cheerlead” for their favored party through their survey responses (Bullock et al., 2015; Prior et al., 2015). We suspect that state legislators did not have the same incentives to cheerlead in their responses to our survey.
Measuring state legislators’ perceptions
In March 2012, we emailed US state legislators, inviting them to complete an online survey. The survey had an overall response rate of 15% (over 1,000 responses total), but we asked the longer survey questions presented in the paper to only a subsample of the legislators taking the survey. 2 We present the results using the 714 self-identified state legislators in the sample who completed the questions about the demographic composition of their district. 3
For our study, we focus on legislators who were serving in office because of their central role in representing constituents in the policymaking process. This contrasts with Broockman and Skovron (2018) who looked at all candidates running for state legislative seats, both incumbents and new challengers. As a robustness test, Broockman and Skovron show their main results—that candidates for state legislative office believe their constituents have more conservative policy positions than they actually do—persist when looking only at incumbents who were running for reelection (see Table 4, Column 4 of Broockman and Skovron, 2018). That group is most similar to our sample; however, it is not the same sample. In particular, our sample includes the legislators who were not running for election either because they were retiring or because they were not up for re-election in 2012. Although we think useful comparisons can be made between our results and those from Broockman and Skovron, readers should be aware that they are not exactly the same populations. Additional details about the survey are given in the Online Appendix.
In the survey, we asked legislators to estimate the percentage of their district that belonged to five different groups: blue-collar workers, those living in poverty, Latinos, blacks, and home owners (see Figure 1 for a screenshot of the question). For the analysis, we compare legislators’ responses about the percentage of their district in each of five different demographic groups with the census estimates for their district (which are based on the 5-year samples of the American Community Household Survey). 4 Because the survey was administered during the spring of 2012, the survey question emphasized that they were being asked about the district they had been representing (i.e., the district prior to any changes occurring as a result of redistricting). The question also stressed that they should think about their district “as a whole and not just voters.” This wording ensures legislators had the same benchmark.

Question about legislators’ perceptions of district characteristics.
If legislators overestimate the size of groups that are part of their electoral coalition, then we would expect Democrats (relative to Republicans) to overestimate the number of minorities, blue-collar workers, and low-income families in their district because these groups are generally part of the Democrats’ electoral coalition (Manza and Brooks, 1999). Predictions regarding the homeownership rate in the district are less clear. However, to the extent that home ownership is a sign of wealth, the expectation is that Republicans will estimate larger rates of homeownership than Democrats. Similarly, if legislators’ belief that their constituents hold more conservative positions than they actually do (Broockman and Skovron, 2018) is caused by or correlated with their views of district demographics, then we would anticipate that state legislators would underestimate the number of constituents who are low-income, racial minorities, or blue-collar workers. This would be even more the case among Republicans, whose misperceptions of constituents’ preferences are larger (Broockman and Skovron, 2018).
Legislators’ perceptions of district demographics
Figure 2 plots the legislators’ estimates of the percentage of blue-collar workers in their district (the y-axis) against the census information on the percentage of blue-collar workers in the district (the x-axis). If legislators’ perceptions were perfectly accurate, then all of the observations would rest on the black 45-degree line. Instead, the bulk of the observations lie above the 45-degree line, indicating that the majority of legislators overestimate the number of blue-collar workers in their district. Some of this overestimation may be due to idiosyncratic differences in how legislators define “blue-collar worker;” its definition is more ambiguous than the other characteristics we asked about. However, the more important observation for this study is the lack of a partisan difference. The Lowess lines for Democratic (blue, dashed line) and Republican (red, solid line) legislators are nearly identical, which indicates that Democrats and Republicans are not polarized in their perceptions of the number of blue-collar workers in their district.

Legislator’s estimates versus census data: blue-collar workers.
Figure 3 displays the relationship between legislators’ estimates and the Census data for the other demographic characteristics. 5 Again, the two Lowess lines in each plot closely mirror each other, suggesting that legislators’ partisanship does not bias their perceptions of their district.
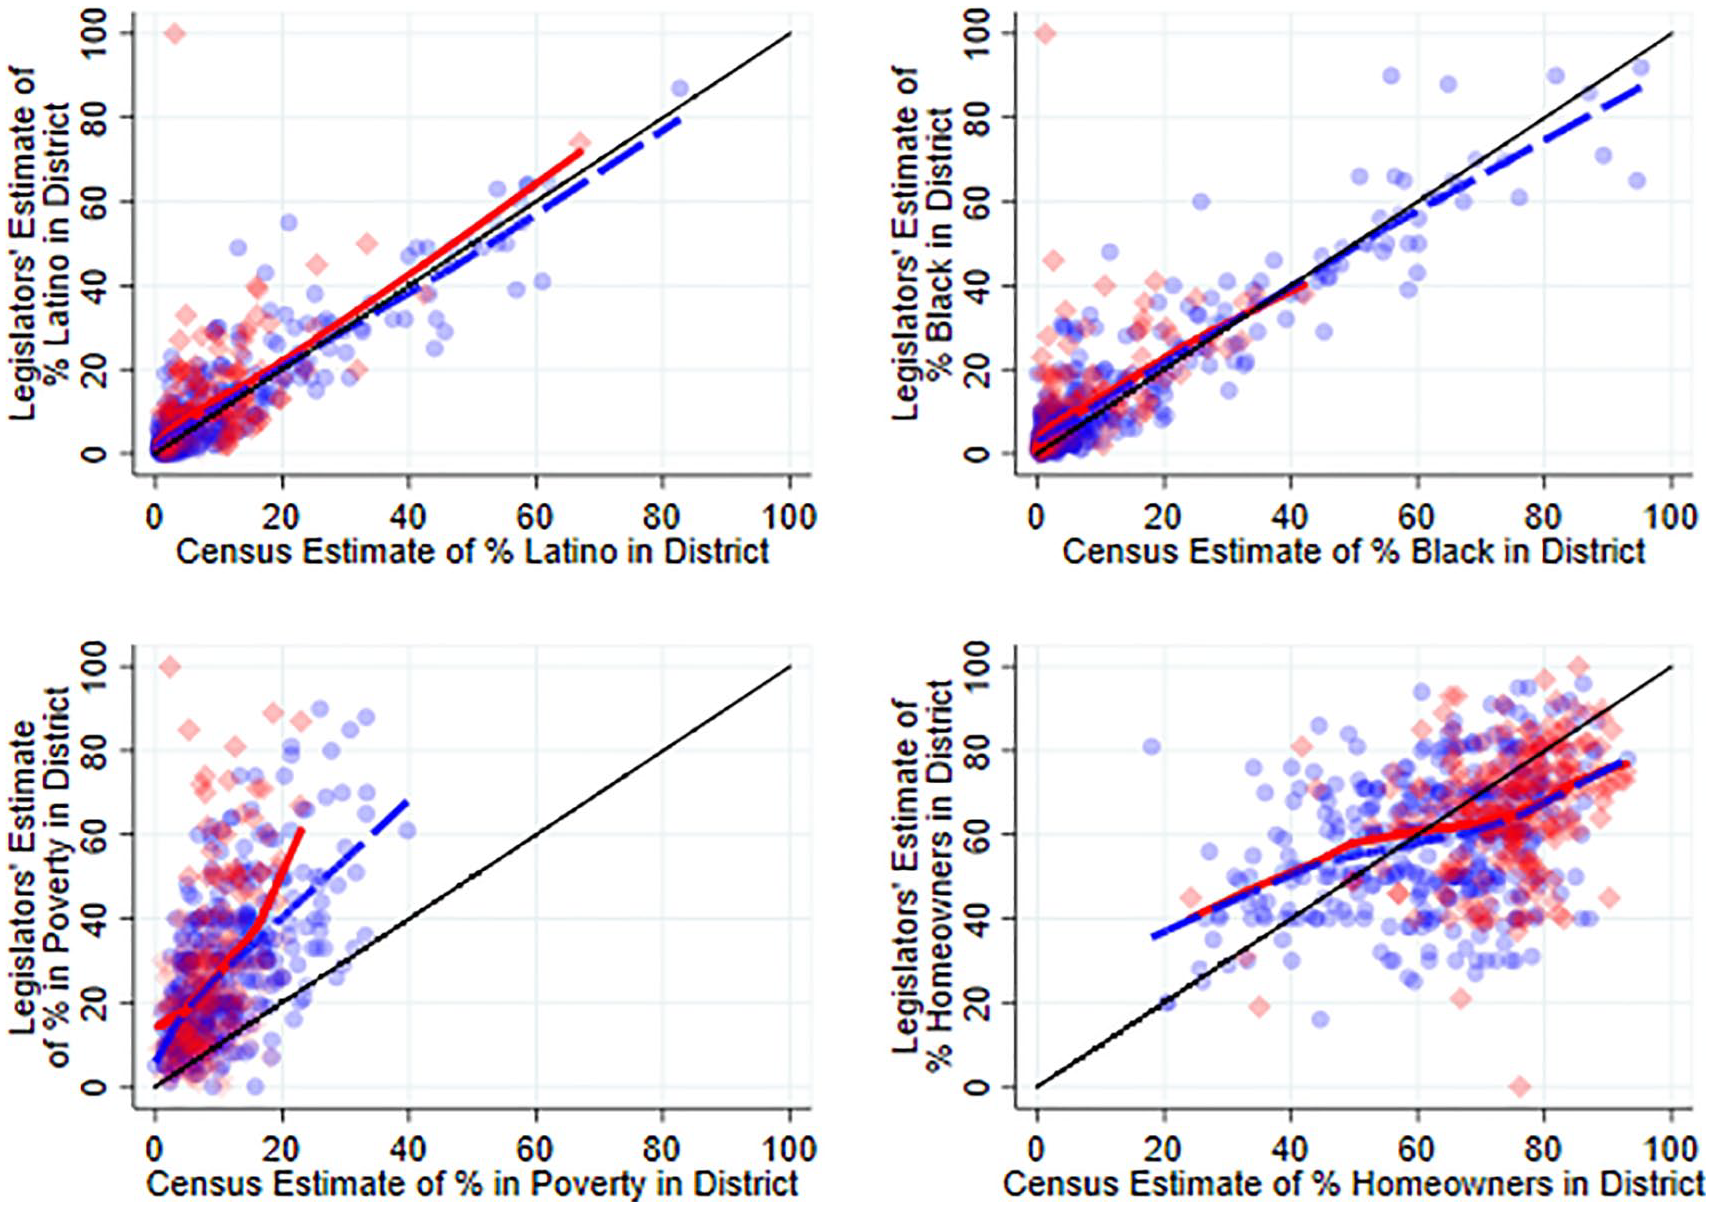
Race/ethnicity, poverty, and homeownership rates.
Turning to other patterns in the data, the Lowess lines have positive slopes (as they do in Figure 2), indicating legislators’ knowledge correlates with the actual data. Legislators are knowledgeable about the demographic make-up of their districts. In Figure 3 it also appears that legislators are most accurate about the two categories that measure constituents’ race and ethnicity. 6 The predicted bivariate relationships are close to the 45-degree line for both Republicans and Democrats, showing that legislators know the racial composition of their districts. In fact, 90% of state legislators’ estimates are within 10 percentage points of the actual measure. In other areas, however, the levels of misperception are much larger. In the case of homeownership, legislators’ estimates followed a reversion to the mean pattern. In districts where levels of homeownership are high, legislators underestimated the levels of homeownership, but in areas where the homeownership rate was low, legislators overestimated the levels of homeownership. Finally, legislators from both parties overestimate the poverty rate in their districts. In fact, 93% of the legislators in the sample overestimated the percentage of families in their district who were below the poverty line; this is even larger than the overestimation we observed in legislators’ perceptions of the number of blue-collar workers in their districts (see Figure 2). For additional analyses confirming these findings about state legislators’ accuracy across different district characteristics, please see Tables A8 through A10 and Figure A4 in the supplementary material.
Regression analysis of partisan differences
To further test this lack of a partisan difference, we run several regressions that control for various factors that might influence legislators’ perceptions about their district and correlate with their partisanship. For the sake of space, we only present regression results (in Table 1) from one specification where the dependent variable is the difference between the legislator’s perception about the group’s size and the census estimate for the group’s size (Legislator’s estimate—Census estimate). Thus, positive values mean the legislator is overestimating the size of the group and negative values mean they are underestimating the size of the group. In the supplementary material, we find that these results hold using a variety of specifications with different dependent variables.
Partisanship and accuracy of legislators’ perceptions of district demographics.

Standard errors in parentheses. *p<0.05.
The key independent variable in the results presented here and in the robustness checks is the legislator’s partisanship, which we measure using indicator variables; thus the variable Democratic Legislator equals 1 if the legislator is a Democrat and 0 otherwise. The variable Independent Legislator is coded in a similar way. (Only 1% of the sample are independent legislators.) Because Republicans are the omitted category, the coefficient on Democratic Legislator is the key coefficient, indicating whether there is a difference in the level and direction of misperception between Republican and Democratic legislators.
In terms of control variables, we focus on several variables that might affect legislators’ knowledge of their district. The first set is an indicator variable for whether the legislator is Black and another for whether they are Latino. We include these variables (Black Legislator and Latino Legislator) because legislators who are part of a group may have more knowledge about that group. Further, these two variables are correlated with our main variable of interest because minority legislators are more likely to belong to the Democratic party.
We also control for the legislator’s tenure in office by including the variable Years in Office that equals the number of years they have served in that position. Those who have served longer have had more time to learn about their district. Further, if accurate knowledge of one’s district improves legislators’ electoral chances, then those who know their district better will have served longer. The Population of the district, measured in units of 10,000, may also affect district knowledge as those in smaller districts may have more direct contact with a larger proportion of their constituents. At the same time, legislators representing districts further from the state capital may spend more time on the road and less time in their district and thus know less about their district. We use data from Silbermann (2015) 7 that calculates the number of hours it takes to drive from the state capitol to the centroid of the legislators’ district to measure legislators’ Travel Time.
Another potentially important variable is the level of legislative professionalism, which we measure using the Squire Index (Squire, 2017). Those in more professionalized legislatures have more resources and time that could be used to learn about their district. As Squire (2017) indicates in his review of work on professionalism, legislators in professionalized legislatures have more contact with their constituents and knowledge of their preferences, which suggests they may also know their district’s characteristics better.
Finally, a district’s conservatism and a legislators’ electoral vulnerability may also correlate with district knowledge. Legislators who are electorally vulnerable have increased incentive to pay attention to their constituents, which may foster learning. At the same time, these legislators may be electorally vulnerable because of their deficiencies in district knowledge. We account for electoral vulnerability by including an indicator variable, Close Election, which equals 1 for legislators who won their last election by fewer than 5 percentage points. This variable may also correlate with legislators’ partisanship given nationwide, partisan trends in state legislative electoral returns (Rogers, 2016). The ideological predisposition of constituents in a legislative district, which correlates with legislator’s partisanship, may also lead legislators to alter their perceptions of district demographics—for example, a legislator representing a liberal district may assume they have more low-income constituents than they would if their district were more conservative. We control for this with the measure of District Conservatism created by Tausanovitch and Warshaw (2013). 8
Table 1 presents the results of regressing the difference between legislators’ perceptions and Census data on the independent variables reviewed above. These results suggest that legislators’ partisanship does not impact their perception of the demographic groups in their districts. Democrats’ and Republicans’ estimates about their districts are typically only different by one percentage point. This is an order of magnitude smaller than the differences between Democratic and Republican legislators’ perceptions of constituent preferences, where the partisan gap is often 10 percentage points or more (Broockman and Skovron, 2018).
Further, there is no support for the hypothesis that partisans overestimate the groups within their electoral coalition. Not only are the coefficients insignificant, most of them are in the wrong direction for what we might anticipate if legislators overestimated the size of groups who are in the electoral coalition. For example, the negative coefficient on Democratic Legislator in the regressions looking at blue-collar workers and race means that for a given district demographic profile, it is Republicans and not Democrats who think blue-collar workers and racial minorities represent a larger share of their district. Although the coefficient is in the expected direction for homeownership and poverty rates, these differences are substantively small and not statistically significant.
The coefficients on the control variables are also largely statistically insignificant. One of the few exceptions is that the coefficients for minority legislators are positive in the poverty equation. Most legislators overestimate the level of poverty in their district (see Figure 3) and minority legislators do so by the largest margin. We also observe that district conservatism, which runs from -1.1 (the most liberal districts) to 0.69 (the most conservative districts), has a negative coefficient in the model for home ownership. This means that as the district becomes more conservative (or less liberal) the legislator is more likely to move towards underestimating the level of homeownership in their district. (Whether they are overestimating or underestimating the level of homeownership depends on the value of all of the other variables in the model.) However, these patterns should be viewed as tentative, with further research needed.
The results presented in Figures 1 and 2 and Table 1 are robust to additional specifications and alternative measures of the dependent variable available in the supplementary materials. For example, the lack of partisan differences in Figures 1 and 2 holds if we model the relationship using a regression model with the control variables from Table 1 (see Tables A8 and A9 and Figure A4). Another concern is that state legislators may have been thinking of registered voters or likely voters when asked about their districts. Using Catalist data, we are able to estimate the poverty rates, race/ethnicity, and occupations of these two populations. The substantive results are unchanged when we use these estimates instead of the Census estimates (see Figures A5 and A6).
Discussion
Although legislators are likely to be more knowledgeable than voters, legislators also face information limitations because they do not have the money or time to poll on every issue. However, they can potentially use information about the demographic composition of their district as an information shortcut to better understand their constituents. We explore how well they know the size of five demographic groups in their district and find there is a positive correlation between their perceptions about their district and the actual district demographics (see Figures 1 and 2). At the same time, they are not equally knowledgeable about the size of all groups; notably, legislators were most accurate about the size of racial minorities in their district.
Although legislators’ perceptions are sometimes incorrect, we find that party affiliation does not explain those misperceptions. In other words, legislators’ perceptions of their district’s demographics do not appear to be polarized along party lines. As discussed earlier, there are many reasons why we might expect Republicans and Democrats to disagree on what their districts look like. However, we find that the legislators we surveyed from the two parties share similar perceptions about their districts’ demographic makeup, even at the same time that they potentially disagree about what those constituents want (Broockman and Skovron, 2018). 9
Differences in legislators’ perceptions of the demographics of their district cannot alone explain why Democrats and Republicans differ in their reported perceptions of voters’ issue positions (Broockman and Skovron, 2018) or why Republican and Democratic state legislators representing similar districts vote distinctly from one another (Shor and McCarty, 2011). If they were relying solely on these demographics, we would expect to see the lack of partisan differences about district characteristics carry over to their estimates of public opinion. In fact, in two cases, we find that state legislators overestimate the size of two groups who generally are in the Democrats’ electoral coalition—low income families and blue-collar workers (Manza and Brooks, 1999) —while underestimating constituents’ support for liberal policy outcomes (Broockman and Skovron, 2018). More work is needed to understand why partisan differences exist in elites’ perceptions of public opinion.
On a positive note, our findings suggest that partisan biases have not completely infiltrated state legislators’ views on politically relevant information. Given concerns that partisans cannot even agree on basic facts that have political implications (Flake, 2018; though see Bullock et al., 2015 and Prior et al., 2015), the lack of partisan differences in this domain is a bright spot. Politicians, at least at the state level, are starting with a similar set of perceptions about the demographic composition of their districts, which suggests there is some common ground on which they can build.
Supplemental Material
PolarizedFacts_RAP_appendix – Supplemental material for Do Republican and Democratic legislators have polarized views of their district’s demographics?1
Supplemental material, PolarizedFacts_RAP_appendix for Do Republican and Democratic legislators have polarized views of their district’s demographics?1 by Daniel M. Butler and Adam M. Dynes in Research & Politics
Footnotes
Declaration of conflicting interests
The author(s) declared no potential conflicts of interest with respect to the research, authorship, and/or publication of this article.
Funding
The author(s) received no financial support for the research, authorship, and/or publication of this article.
Supplemental materials
Notes
Carnegie Corporation of New York Grant
This publication was made possible (in part) by a grant from the Carnegie Corporation of New York. The statements made and views expressed are solely the responsibility of the author.
References
Supplementary Material
Please find the following supplemental material available below.
For Open Access articles published under a Creative Commons License, all supplemental material carries the same license as the article it is associated with.
For non-Open Access articles published, all supplemental material carries a non-exclusive license, and permission requests for re-use of supplemental material or any part of supplemental material shall be sent directly to the copyright owner as specified in the copyright notice associated with the article.