
Abstract
The use of vote centers—specific locations in a county where all voters will vote—is on the rise nationwide, as more than a dozen states used this process by 2018. More states are moving toward using voting centers to remedy the problem of low voter turnout, with the assumption that the centralization of voting to several core county locations will increase voter accessibility. What we have less clear information about is the effect of vote centers on turnout in individual elections across several cycles. Using a natural experiment in Texas—a state that has three fixed election cycles—we find vote centers have a small positive impact on traditionally lower turnout elections but no effect on higher turnout elections. The cumulative impact of vote centers has a small effect on turnout over time. These results suggest a more cautious assessment is needed when considering the use and impact of vote centers.
Keywords
Introduction
Vote centers (sometimes called countywide polling places) are locations in a county where all voters will vote, regardless of their address. Academic studies of vote centers, although narrow in scope, have found that vote centers increase turnout generally and boost turnout among those voters who are less likely to vote (Stein and Vonnahme, 2008, 2012). Yet, the evidence is mixed, with some scholars finding no significant effects (Juenke and Shepherd, 2008; Schelle et al., 2009). However, despite claims of electoral efficiency, little academic work has explored the larger effects of vote centers beyond one state or across elections. Importantly, a critical missing factor in this analysis is the effect of vote centers on a state’s various types of elections, where voters have differing incentives to show up to vote and where voter turnout varies considerably. The findings to date have not taken election type into account, nor do they examine the effects on a shift to vote centers over time. In this study we examine the transition to vote centers in Texas—a state that has three unique election cycles—across the counties that have switched to a vote center process and across the several elections, leveraging theories about voter turnout and mobilization.
Theories of voter turnout
Previous research has identified four major influences on individual and collective decisions to vote: social and demographic traits, electoral rules, and mobilization by organized interest groups (Leighley, 1995). Of these, the “cost” of voting is often the focus, especially the time and effort it takes to vote (Downs, 1957). The structure of the voting process—including the days before Election Day required to register, vote by mail, or early voting—has been shown to be an important effect on aggregate level turnout (Squire et al., 1987). Dozens of states have attempted to reform the process of voting to make it easier, more cost efficient, and more likely. In theory, if the cost of voting were reduced, more voters would vote. Census questions from 2014 asked Americans why they didn’t vote—according to The Washington Post, “Being ‘too busy’ tops the list of reasons. Few people blamed registration issues, inconvenience, transportation issues or bad weather” (Clement, 2015). Difficulty getting to the polls is also pointed to as a cause of sporadic vote casting (Pew Research Center, 2016). Efforts to allow voters to vote early or vote by mail, referred to as “convenience” voting, are favored by current voters who find these methods make it easier to vote (Berinsky, 2005; Stein, 1998).
Vote centers and turnout
Vote centers are specific locations in a county where all voters cast their ballots. Vote centers are an alternative to a traditional, neighborhood precinct where local houses, schools, or community centers serve as the voting location for individuals in that precinct alone. The National Conference of State Legislatures argues that the possible advantages to vote centers include voter convenience, financial savings, and an increase in turnout. Reducing the total number of polling places necessarily reduces the total number of poll workers needed (Folz 2014; Schelle et al., 2009). Vote centers also eliminate the need for provisional ballots if a voter votes at the wrong precinct since all voters are voting at the predetermined vote centers. Consolidated vote centers also increase the likelihood that the voting locations comply with the Americans with Disabilities Act since there are fewer locations to monitor and maintain for compliance.
Possible negatives to vote centers as the primary voting system include a loss of routine habit or tradition in neighborhood connectedness to voting, shown to be a significant factor in turnout, and voter confusion about the process, at least in the early stages. 1 Because vote centers disrupt the standard neighborhood precinct voting arrangement by moving polling locations to new and unfamiliar locations, there may be a negative effect of this switch on voter turnout. Concerns over cost and organization also generate up-front barriers to moving to vote centers. The League of Women Voters Texas Education Fund also suggests that such centers “may disenfranchise poor, disabled, or elderly voters, and any person with transportation issues, as the consolidated polling places may be farther away.” 2 Longer lines at voting locations may also discourage voters from waiting in line to cast a ballot since polling place consolidation may increase wait times.
In the past decade, vote centers have become more popular, but states have varied in their adoption of vote centers. States are split (as of 2018) on the use of vote centers: most states do not have a provision for a vote center, but 13 states allow vote centers for early and Election Day voting. The experience of the effectiveness of vote centers nationally has been mixed. Larimer County, Colorado conducted a successful pilot program using vote centers in 2003 and 2004 (consolidating the polling place locations from 143 to 22 vote centers), resulting in an efficient election staffed by better trained personnel. The City of Denver, however, had a more difficult experience in 2004, leading to long lines at many of the polling locations (Stein and Vonnahme, 2017). Theoretically, vote centers may aid turnout, but the field lacks a comprehensive study of the effect across different counties, distinct election types, and cumulative over several cycles.
Hypothesis
Geographic accessibility plays a significant role in voter turnout. Gimpel and Schuknecht (2003) find that, even after controlling for variables that account for other voter motivations, the location of the precinct makes a significant difference in turnout—they argue distance is a burden in suburban precincts for distances between 2 to 5 miles, although in rural areas direct and unimpeded distances of 6 to 10 miles demonstrate turnout rates are higher. Physical turnout is also more likely when a voter is closer to their polling location, otherwise a regular voter is more likely to mail in an absentee ballot (Dyck and Gimpel, 2005). Other scholars find that small geographic distances in the location of a polling place make a big different in the turnout rate (Hasptel and Knotts, 2005). Convenience is a key factor (Kousser and Mullin, 2007). Proper distribution of polling places may reduce the cost of voting by reducing the potential of a queue to vote (Stein and Vonhamme, 2008). In theory, then, a series of centralized voting locations could have a positive effect on turnout since voters can choose among the closest (and therefore most convenient) place to cast a ballot.
Specifically, Stein and Vonnahme (2008), who have done the most comprehensive work on the subject to date, suggest that vote centers increase voter turnout generally, most especially among individuals who are registered but infrequent voters. If voters who routinely do not vote (but have voted in the past) find a vote center form of voting more convenient, making it easier to vote, we should expect to see larger turnout in election types where there is at least some voter awareness and voter activation by party or organized interests. In short, in elections where voters are somewhat more likely to turn out, increasing the convenience of voting could marginally help increase turnout. Therefore, we argue:
If a voter is a low-propensity voter, a vote center method may lower the cost for a voter just enough to consider turning out in a midterm/gubernatorial or presidential election where information is easier to get. In that sense, the vote center is a marginal but potentially important aid in increasing turnout. The method of voting may have less impact in election cycles where the enthusiasm is generally low, information is low, and voters are not typically motivated to vote. Because of relatively lower turnout in constitutional elections, we should not find that vote centers have a significant effect on turnout in these elections.
Texas voter turnout
Of the states to allow a switch to a vote center model for voting, Texas is alone in that it has three fixed and permanent election cycles: constitutional (for voter ratification of statewide changes to the constitution involving no candidates or partisan affiliations) in odd number election years, midterm and gubernatorial in even years every 2 years, and presidential in even years every 4 years. 3 These unique elections offer an opportunity to examine the differential impact of vote center across Texas’s 254 counties. The differences in statewide turnout by election type are massive. Presidential election turnout across Texas counties during the period where vote centers have been used (2005 to 2018) average 59% of registered voters, midterm elections average 38%, and constitutional elections average only 11%. These turnout figures rank Texas near the bottom of the national list for turnout (McCullough, 2016). Voter interest in these elections varies considerably and the incentives to vote are perceived to be different in each and the parties and candidates spend more time and finances turnout out voters. If methods to alter voter turnout are to have a positive effect, it would be in a state where voter turnout is generally low, making Texas a good case for study.
Vote centers in Texas
In 2005, the Texas Legislature approved a program (HB 758) for county-level decision-making to move from precinct level voting to “vote centers” for the November 2006 elections. 4 Lubbock County was the first participant the program in 2006, replacing the county’s 69 precincts with 35 vote centers (but kept 8 precincts in rural areas). The Secretary of State’s post-election report discovered that “there were no significant problems on election day.” However, the Secretary of State’s report found that voter turnout fell 2% from the past midterm election. 5 The interim report of the Texas House of Representatives Committee on Elections in the 82nd Legislature was tasked with reviewing the progress on the additional counties who signed up to use vote centers in the 2009 and 2010 elections. Voter turnout in 2010 was slightly higher in Collin County than in the past midterm election. Other counties reported similar trends. 6 Overall, then, the effect of vote centers on voter turnout presents conflicting findings across counties and elections in Texas. By 2018, 52 Texas counties used vote centers to conduct constitutional amendment, midterm year, or presidential year elections. Not all counties in the state have adopted vote centers—in this analysis we compare those that did with those that did not using comparable turnout data from the same election type.
Data and models
The data for the models below comes from the Texas Legislative Council, the Texas Secretary of State, the Texas State Demographer, and from the U.S. Census. The time period covered is elections held annually (of different types) from 2009 to 2018. 7 The outcome variable is county-level turnout, defined as the percentage of voters out of the total number of eligible registered voters including suspense (voters who have been contacted due to a possibly incorrect or outdated address but are still eligible to vote) and non-suspense voters who voted in an election. The main predictor is the interaction between an indicator variable reflecting the presence of a vote center during a particular election and an indicator variable of whether the period is before or after the policy is implemented. In addition, we include a series of proxy variables to control for size of the county (total population) and for factors associated with electoral turnout (median county income and percentage of the total population that has a bachelor’s or higher education degree).
To test the impact of vote centers on turnout under distinct elections, we fit a difference-in-difference (DD) fixed effect model with clustered standard errors at the county level. The DD estimator allows us to compare counties before and after the implementation of vote centers by estimating the difference between the observed mean turnout for counties with vote centers and counties with no vote centers before and after a particular implementation year. The parallel assumption requires that, in the absence of treatment, the difference between the units under the treatment and control groups is constant over time. A visual inspection of turnout between counties that adopted vote centers versus those that did not confirm such trend over time (Figure S1(a) in the Online Appendix). DD in this article is implemented as an interaction term between year and counties with or without a vote center (i.e., the main predictor).
Table 1 shows the results of fitting a DD, fixed effect model with county clustered standard errors for presidential, midterm/gubernatorial, and constitutional elections to gauge the impact of vote centers on turnout. For instance, for presidential elections we compare the 45 counties that had a vote center in 2016 to those that did not have a vote center in 2012. These models estimate the effect of adopting vote centers for each election type in order to compare similar turnout within election type. Overall, the results suggest that voter centers’ impact on turnout is marginal and not statistically significant. For presidential elections the impact of vote centers on turnout is basically zero, the opposite of what was expected. For midterm and constitutional elections turnout is higher in those counties that implemented vote centers the last comparable election cycle (the coefficients are positive) but the impact for each election type is not statistically significant from counties that did not implement vote centers. This finding sides with Juenke and Shepherd’s (2008), that the adoption of vote centers in the 2006 midterm elections did little to effect turnout.
Differential impact of vote center on elections.

Standard errors given in parentheses.
p < 0.01, ** p < 0.05, * p < 0.1.
Population scaled to 1,000,000 and income scaled to 10,000.
The real impact on turnout due to transitioning from precinct-level voting to vote centers may only be felt in the short term or medium term. It may be the case that voters need time to “acclimate” to the new locations by spending more time planning transportation, locating the new voting location at which they plan to vote, and organizing their schedule around those details, but once this acclimation has taken place the impact of vote centers on turnout out disappears. To test the impact of the vote centers on turnout during time periods we fit a similar DD, fixed effect model with county-clustered standard errors to various time windows of constitutional elections since these are the most abundant in the data. Table 2 shows that in the short run vote centers do not have a significant impact on turnout during constitutional elections (2009–2011 and 2015–2017). In the medium term, however, there is a significant impact of vote centers on turnout plausibly right after the acclimation period (2011–2017)—about a 4% increase. These results seem to be in line with the findings that a vote center will promote voting in lower turnout elections (see Folz, 2014), although it is contrary to our expectations.
Different impact of vote centers.
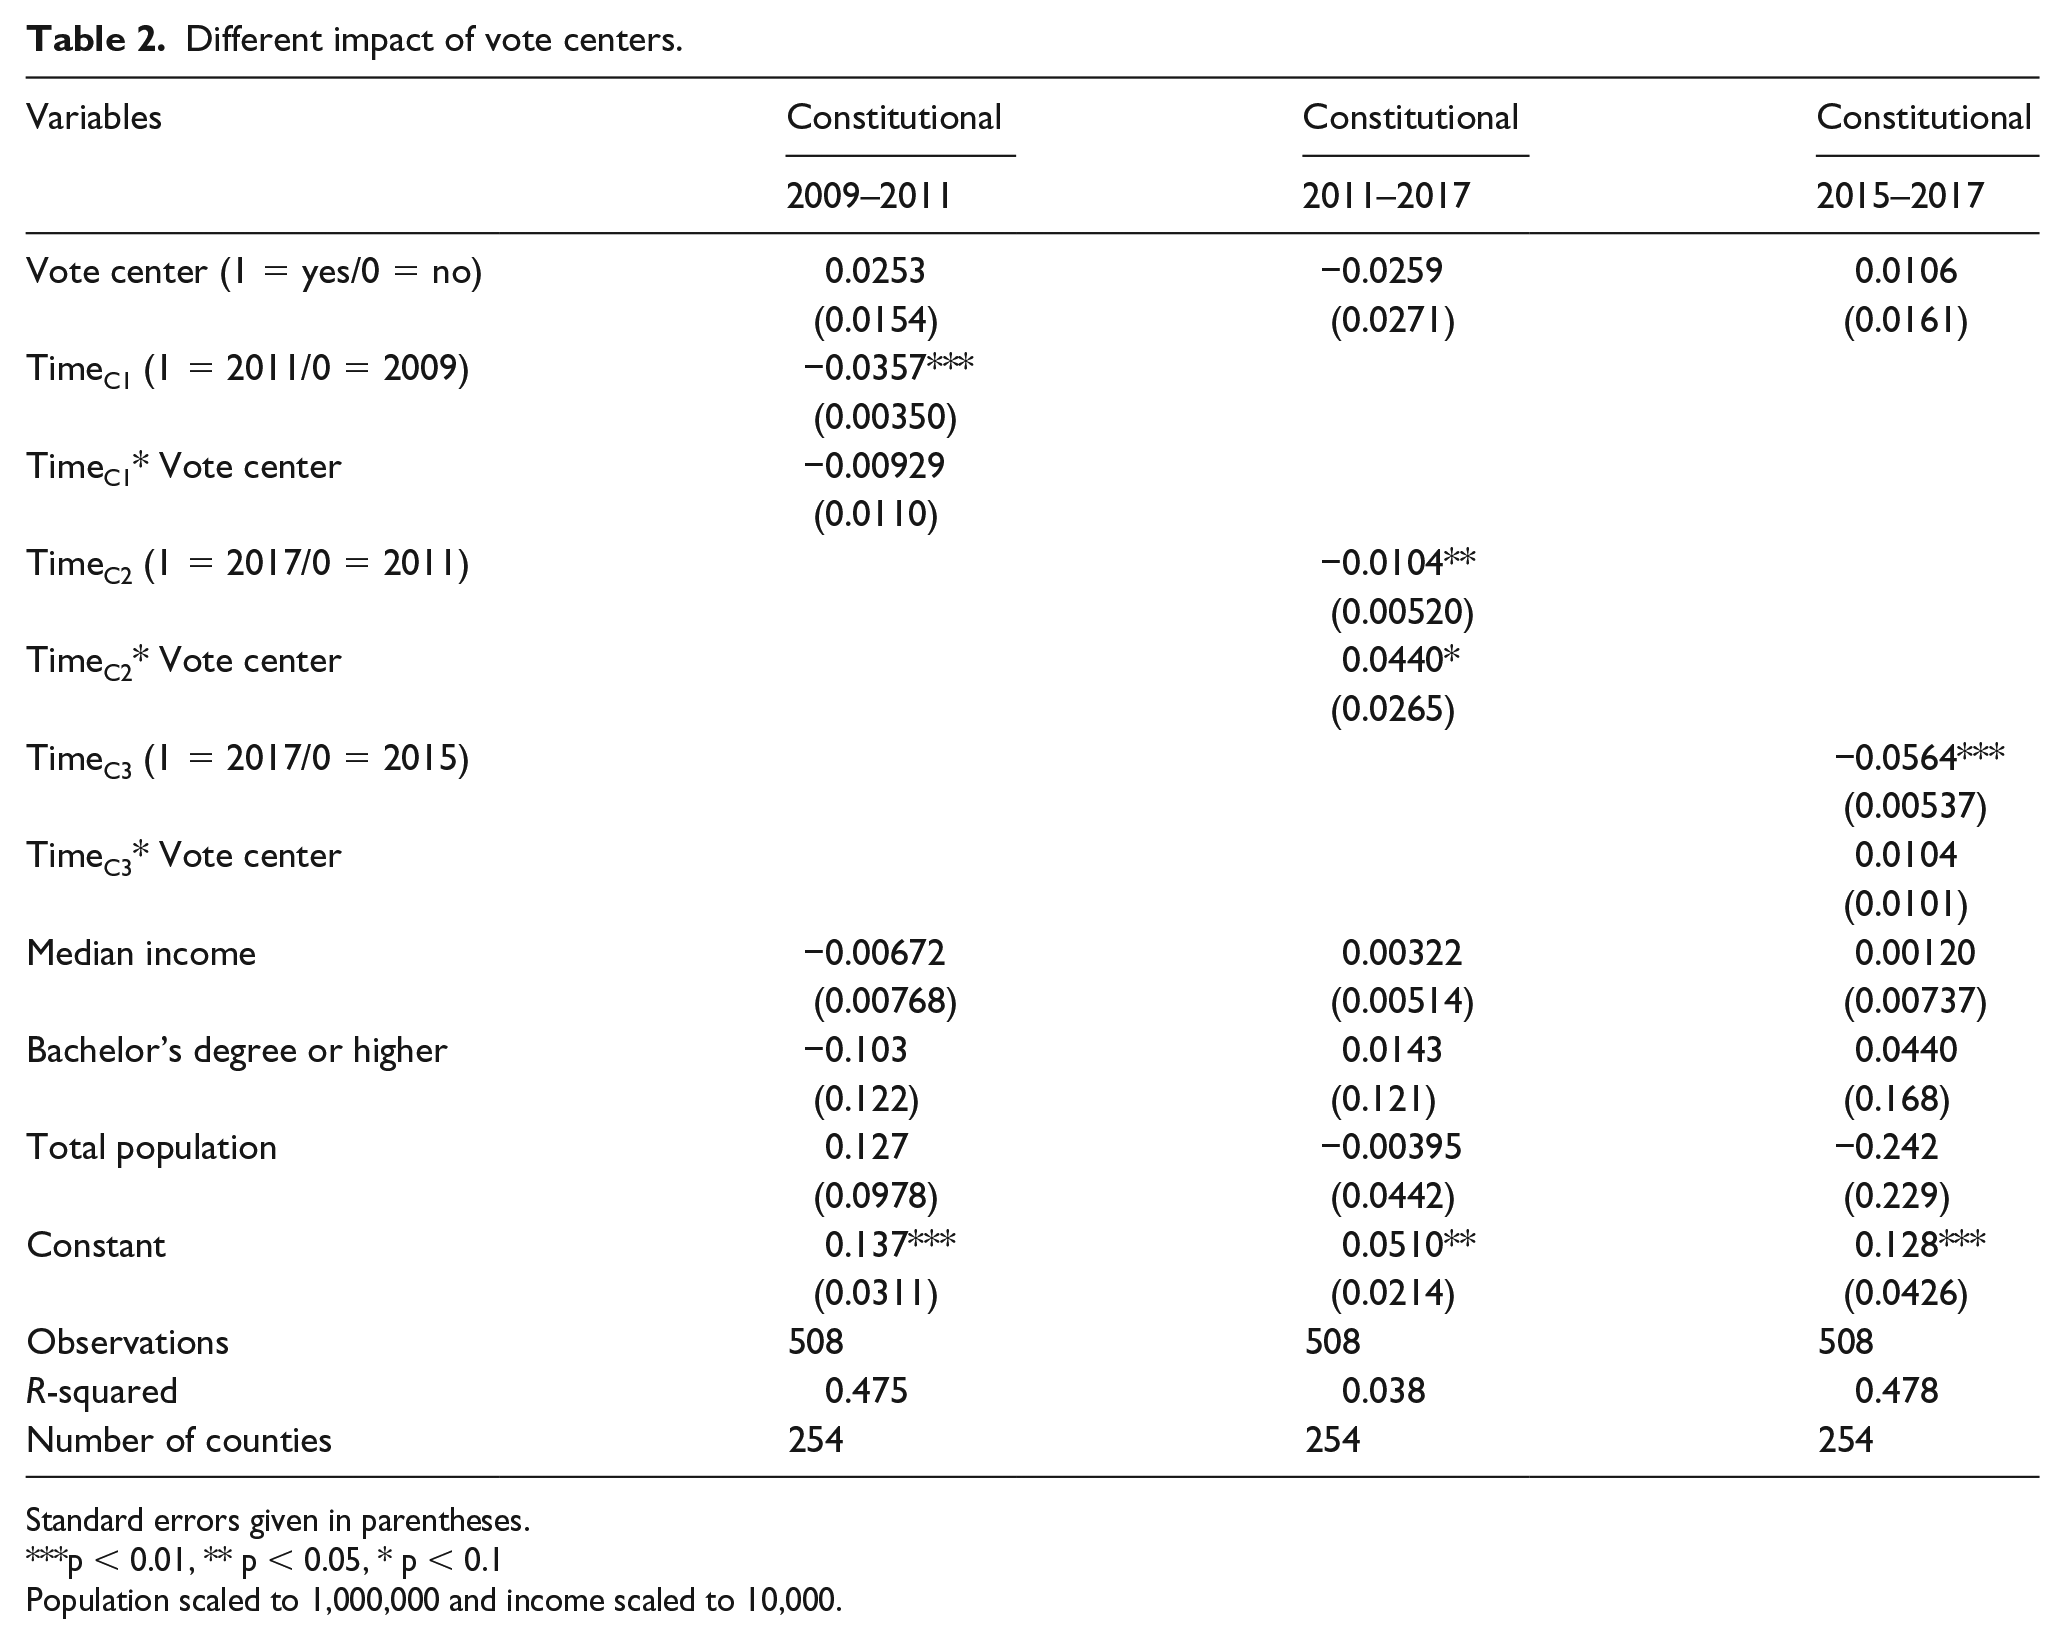
Standard errors given in parentheses.
p < 0.01, ** p < 0.05, * p < 0.1
Population scaled to 1,000,000 and income scaled to 10,000.
One concern is that we are comparing similar counties that differ only in having versus not having vote centers. Propensity score matching allows us to further approximate the true impact of vote centers on county-level turnout (Heckman, 2005; Holland, 1986; Pearl, 2000; Rubin, 1974, 2005; Splawa-Neyman et al., 1990). The propensity score estimates the conditional probability of assignment to a particular treatment—in this case, vote centers given a vector of observed covariates. There are two important assumptions that need to be made in order to unbiasedly estimate the impact of vote centers on turnout. First, we need to assume that the outcome for each county depends only on its assignment to a particular treatment. We need to assume that turnout depends only on whether a county has or does not have vote centers and not on the assignment of other counties to a different treatment (this assumption is known as the Stable Unit Treatment Value Assumption (SUTVA)). The second assumption is that each treatment condition is independent of the potential outcomes after conditioning on a series of covariates. In other words, the probability of being assigned to a particular treatment is a function of certain observable characteristics and is conditionally independent of the potential outcomes (i.e., the ignorability assumption).
In Table 3 we estimate a linear regression DD model with probability weights extracted from the propensity score matching process as well as additional covariance adjustment (in order not to extrapolate over parts of the covariate space with no data). The balance and overlap for each election seem to be reasonable (Figure S2(a) in Online Appendix). The standardized differences between counties before and after matching are reduced significantly in the matched data and the balance achieved after matching indicates that we are comparing counties that are comparable in the covariates included. The interaction terms estimate the difference between the observed mean turnout for counties with vote centers and counties with no vote centers and year—this is the same as Tables 1 and 2 but we change the election span. The results from Table 3 (the interaction terms) show, as found in Tables 1 and 2, that there is no statistically significant effect of vote centers on turnout in presidential or midterm, but there is a small effect in constitutional elections (about 4 % increase), which is on the edge of being statistically insignificant.
Robustness check with propensity score matching.

Standard errors given in parentheses.
p < 0.01, ** p < 0.05, * p < 0.1.
Population scaled to 1,000,000 and income scaled to 10,000.
Discussion and conclusion
Vote centers produce the possibility of convenience for voters and cost saving for counties. These impacts, however, may not affect all election types equally given the various factors predicting voter attention during different election types. The results from this article show that lower turnout elections (constitutional) benefit from vote centers more than larger turnout elections (midterm/gubernatorial, presidential). This is the opposite of our expectations, likely because turnout in higher turnout elections swamps the modest assistance a vote center model yields. Our findings also demonstrate that familiarity with vote centers (through cumulative years of the practice) has only a small positive net effect on turnout and only for constitutional elections. Turnout in the long run generally returns to levels prior to the adoption of the vote center since no cumulative effect is found. Such systematic differences highlight a potential criticism of vote centers—the impacts on voting may be non-uniform and may positively affect turnout in locations or elections where turnout is somewhat likely or counties are smaller (where voters are likely more homogenous). Taken together, these results suggest a more cautious assessment is needed when considering the impact of vote centers.
Supplemental Material
Vote_Center_Supplemental_Materials_RR3 – Supplemental material for Vote centers and turnout by election type in Texas
Supplemental material, Vote_Center_Supplemental_Materials_RR3 for Vote centers and turnout by election type in Texas by Jeronimo Cortina and Brandon Rottinghaus in Research & Politics
Footnotes
Acknowledgements
The authors would like to thank the Hobby School of Public Policy at the University of Houston, the Election Data and Science Lab at MIT, and the Center for Mexican American Studies at the University of Houston for generous funding. The authors are listed in alphabetical order to reflect their equal contribution to this article.
Declaration of conflicting interest
The author(s) declared no potential conflicts of interest with respect to the research, authorship, and/or publication of this article.
Funding
The author(s) disclosed receipt of the following financial support for the research, authorship, and/or publication of this article: The Hobby School of Public Affairs at the University of Houston, the MIT Election Science Lab, and the Center for Mexican American Studies at the University of Houston contributed funding to this project.
Supplemental materials
The supplemental files are available at http://journals.sagepub.com/doi/suppl/110.1177/2053168019864224The replication files are available at ![]()
Notes
Carnegie Corporation of New York Grant
The open access article processing charge (APC) for this article was waived due to a grant awarded to Research & Politics from Carnegie Corporation of New York under its ‘Bridging the Gap’ initiative.
References
Supplementary Material
Please find the following supplemental material available below.
For Open Access articles published under a Creative Commons License, all supplemental material carries the same license as the article it is associated with.
For non-Open Access articles published, all supplemental material carries a non-exclusive license, and permission requests for re-use of supplemental material or any part of supplemental material shall be sent directly to the copyright owner as specified in the copyright notice associated with the article.