
Abstract
Is democracy running out of steam? In recent years, politicians, pundits, and academics have voiced the idea that young citizens in industrialized democracies lack commitment to a democratic system of politics. This paper analyzes evaluations of democracy among over 350,000 Europeans between 2002 and 2017 and shows that – contrary to popular perceptions – young people are generally more satisfied with democracy than older citizens. Moreover, satisfaction with democracy has increased among Europeans of all ages. As long as citizens believe that democratic regimes work well in practice, it is doubtful that support for democracy will erode.
Keywords
Introduction
When are democratic regimes durable? For scholars of democracy, a regime is deemed consolidated when citizens view it as “the only game in town” (Linz and Stepan, 1996). The appeal of a general-public-centric view rests partly on measurability. When most citizens do not believe that democracy is working well, or when they say that living in a democracy is not important to them, such views may constitute an early sign of “deconsolidation.”
Some researchers posit that public support for democracy in Western societies is falling, especially among the young. Foa and Mounk (2017) argue that “the young are less invested in democracy,” repeating the assertion from Foa and Mounk (2016) that millennials are less committed to democracy than older citizens. Using a collection of surveys covering nearly all polities in Western and Eastern Europe, this paper fails to corroborate the notions that (a) young people are more critical of democracy than older Europeans, or that (b) citizens in industrialized democracies are less satisfied with democracy than they were in the past.
Across Europe, satisfaction with democracy declined during the financial crisis in the late 2000s, but it rebounded after 2012. Notably, the recovery in democratic sentiment was stronger among the young. If, instead, young citizens were more critical of democracy relative to older cohorts, democratic regimes could soon lose their legitimacy. But the data and its interpretation remain contested: using the same data source as Foa and Mounk (2016), Voeten (2017) reports that in Western democracies, “[m]illennials are not very different in their views of political systems than were young people in the mid-1990s.”
The present study departs from the original Journal of Democracy studies in two ways. First, countries are sampled at a greater frequency in the alternative dataset analyzed here. For 18 countries in the sample, seven to eight readings are available from 2002 onwards, and responses from citizens in 36 countries are analyzed. Foa and Mounk’s (2016) key finding – that a smaller share of people born in the 1980s rates “living in a country that is governed democratically” as essential on a 10-point scale compared with people born in the 1970s or earlier – are based on waves 3 through 6 of the World Values Survey data (ending in 2014). The results reported here are based on eight waves of the European Social Survey (containing data up to 2017). Second, most results are based on individual-level models, allowing for a formal comparison of the usefulness (if any) of age for predicting evaluations of democracy compared with other factors such as personal income or approval of the national government.
No evidence showing that young people are becoming more critical of democracy was found. Satisfaction with democracy is not eroding among young citizens in Europe, and evaluations of democracy among the general public are comparable with their 2002–2005 levels. Although there was a dip in satisfaction with democracy across Europe in the aftermath of the Eurocrisis, the negative trend has not persisted. In fact, satisfaction with democracy has edged up in recent years.
The background section reviews some of the recent concerns about young people’s commitment to democracy, and related research from political science and economics. Subsequent sections describe the data sources, the research design, and the empirical results.
Background and motivation
A recurring worry among observers of (and participants in) politics is that democracy is standing on shaky ground. The ex-president of the USA, George W. Bush, warned in a speech in October 2017 that “[t]here are some signs that the intensity of the support for democracy itself has waned, especially among the young.” Political scientist Francis Fukuyama stated in a recent interview that “[w]e are witnessing a period in which democracy is being threatened in way I have not experienced in my lifetime.” Author David Frum (2018) concludes his latest book by saying that one benefit of the Trump presidency is that it could have the effect of a “much-needed booster shot to enhance the anti-authoritarian immunities of a younger generation apparently lacking in them.”
Writing about political competition in Central European countries, which have now been European Union member states for more than a decade, Harvard lecturer Yascha Mounk worries that “the very survival of democracy is now in doubt.” Foa and Mounk’s claims have circulated with headlines such as Millennials are rapidly losing interest in democracy, and How Stable Are Democracies? ‘Warning Signs Are Flashing Red’. A writer for New York magazine tweeted that 2018 represents “the battleground [year] in an [sic] war to save democracy.” 1
A more measured concern is articulated in Diamond (2015) who notes that “around 2006, the expansion of freedom and democracy in the world came to a prolonged halt.” He concludes on a dark note, stating that “there is a growing danger that the recession could deepen and tip over into something much worse.” As Norris (1999) notes, however, “[t]heories of democratic crisis have gone through periodic cycles of hope and fear.”
A less pessimistic voice in the recent debate is Voeten (2017). Like Foa and Mounk (2016), Voeten uses World Values Survey data to compare support for democracy across age groups. In each consolidated democracy, Voeten shows that democracy is significantly more popular than alternatives like rule by a strong leader, rule by the experts, or military rule, and “has remained so over the past two decades.” Voeten concludes that “[t]rends in overall support for democracy and its non-democratic alternatives have been flat for the past two decades.”
These patterns are consistent with Dalton’s (1999) conclusion that “[d]iscontent with political authorities normally has limited systemic implications.” Given that Dalton’s analysis has focused on consolidated Western democracies, it will be worthwhile to extend the sample of societies to those where citizens have had only a relatively short experience of life in a democracy. In post-communist societies, euphoric expectations as the Berlin Wall was torn down were replaced with a mixture of realism and cynicism. Pop-Eleches and Tucker (2017) show that post-communist economic outcomes partly explain why citizens in Central and Eastern Europe tend to be less supportive of democracy than people elsewhere in the world, and dissatisfaction with corruption is also widespread (Djankov et al., 2016). A natural question, then, is whether young people in countries that have democratized recently are sufficiently satisfied with the system of party competition, or whether they are open to experimenting with non-democratic alternatives. More than a decade ago, Ekman and Linde (2005) showed that “[t]he younger the respondents, the higher the likelihood of rejection of all authoritarian alternatives” in most of post-communist Europe, but both Eastern and Western Europe are now often described as dealing with a “populist wave.”
The objective of this paper is to assess whether young people in Europe view democracy differently than older citizens, and to contribute to the debate on democratic deconsolidation by analyzing newer data on democratic evaluations over a longer time horizon.
Data and research design
This study analyzes responses to the European Social Survey, a cross-national academic survey carried out since 2002. In the cumulative dataset, 353,998 respondents shared their assessment of democracy (the precise wording is described below) in face-to-face interviews. The total number of country-wave observations was 201. A survey was carried out at least once in 36 countries, and the average country was surveyed 5.6 times between 2002 and 2017. Fourteen countries 2 were surveyed eight times in a row, and four countries were surveyed seven times. The most recent data from the eighth wave was released to the public in late 2017.
The outcome variable of interest consists of answers to the following question: “How satisfied are you with the way democracy works in [the respondents’ country]?” The scale is 0 through 10: respondents answering 0 are “extremely dissatisfied” whereas those who answer 10 are “extremely satisfied” with the way democracy works where they live. In some presentations of the results the dependent variable is dichotomized: a respondent is classified as “satisfied with democracy” when his or her answer is 7 or higher. While dichotomizing the ordinal Likert scale facilitates interpretations of certain models, to ensure that results did not hinge on an arbitrary selection of a threshold value, an 11-point scale was used as an outcome variable in all charts, and Table A3 of robustness checks in the Online Appendix lays out regressions with binary variables at distinct cutoff points, as well as a model where the actual scale is used as a dependent variable.
The main dataset was prepared by merging responses from eight waves of the European Social Survey (ESS) and cleaning the data to make the covariates (e.g. education and income) consistent across all survey rounds, yielding a “cumulative ESS.” Overall, 371,801 of respondents participated in the survey between ESS Round 1 and the first release of ESS Round 8. Most (95.2%) answered how they viewed democracy in their own country. In empirical models, only participants with known income, education level, and other variables of interest will typically be included. As a result, the sample size will typically fall to about 260,000 individuals. However, when raw average sentiment is displayed without any controls to simply communicate the broad trends in public opinion (Figure 1), calculations rely on all available data (i.e. 353,998 respondents). Most results will be based on models with a variety of covariates. 3 Estimating models with fixed effects further ensures that results are not driven by respondents in a particular country.
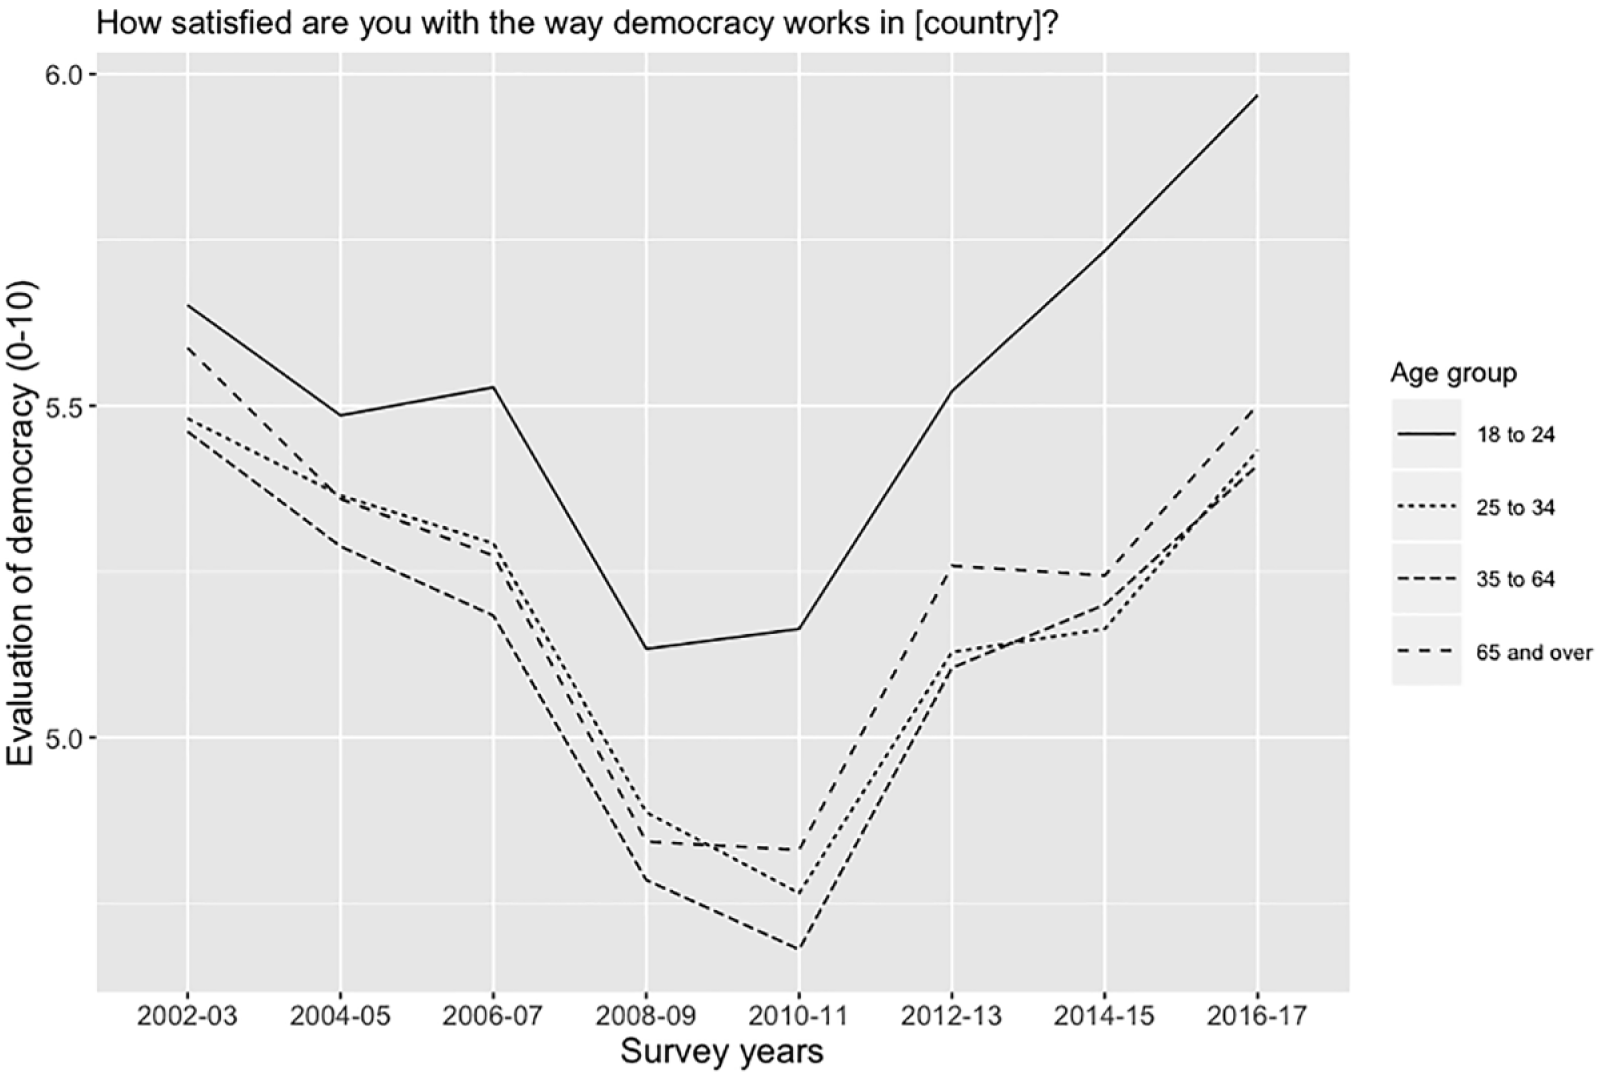
Evaluations of democracy among Europeans since 2002. ESS waves 1–8, (N = 353,998).
The goal of the empirical section is to investigate whether citizens’ satisfaction with democracy can be predicted more accurately if we know their age compared with a hypothetical scenario where respondents’ age is unknown. If age turns out to be a useful input to the model (compared with models where age is withheld) the implication would be that young people hold different views from older citizens, controlling for income, education, gender, and other factors.
A more standard approach – reporting coefficients on age in a series of regressions – is reported in the Online Appendix. Although ordinary least squares (OLS) regressions are informative to some degree, discretion about significance thresholds and subjective stances as to when a coefficient counts as “substantively interesting” can sometimes distract from a clear communication of results. The main results, therefore, report our ability to predict democratic evaluations with and without age as an input to a model. The performance of statistical models is reported with two metrics: the expected percent of correctly predicted respondents, and the expected proportional reduction in error relative to guessing the modal value. 4
Results
Before investigating whether age is a useful piece of information for predicting whether a citizen has a favorable view of democracy, it will be useful to preface the formal analysis with a chart of the raw data. To be sure, plotting unadjusted average views about a political system in an aggregated form could conceal important relationships 5 but it is a simple first step to visualize whether “young people are different.” Figure 1 shows how evaluations of democracy among Europeans in four age brackets (18–24, 25–34, 35–64, and 65 years and above) have changed over time. Average attitudes are calculated based on answers from 353,998 respondents who have answered the ESS question about democracy since 2002.
In each of the eight survey rounds since 2002, the average young European viewed democracy more positively than people who were relatively older at the time the surveys were fielded. Although there was a dip in satisfaction with democracy (across all age groups) during the financial crisis, the general pattern did not change over time. The idea that young people in Europe evaluate democracy less positively than older citizens is not supported by the aggregate data.
Satisfaction with democracy has been rising among young Europeans for four rounds of surveys in a row now, and the last three increases in democratic evaluations among people under 25 have been significant (confidence intervals are suppressed in Figure 1 for the sake of readability, but they are included in Figure A.1 in the Online Appendix).
While Figure 1 conveys that differences in satisfaction with democracy between age groups are not particularly large, any unadjusted figure could mask relevant empirical relationships that would only reveal themselves in a statistical analysis. For example, senior citizens could be poorer, and people with lower incomes might be unhappier about politics. To know whether age truly is a relevant variable (uncorrelated with other plausible drivers of democratic evaluations), a more systematic approach is needed. To this end, Table 1 explores how well satisfaction with democracy can be predicted with models that use different subsets of seven natural predictors.
Performance of seven probit models. Outcome variable: “Satisfied with democracy”.

N ranges from 256,536 (row 5) to 353,998 (row 7).
FE: fixed effects.
Each row in Table 1 summarizes a different probit regression. The purpose of the table is to provide a compact and transparent comparison of distinct models, allowing the reader to gauge how much predictions improve when particular sets of variables are used as inputs. 6 In every model, the dependent variable is equal to one if the respondent is satisfied with democracy. The first row summarizes the model fit of a regression where income, education, and gender are included as independent variables (i.e. predictors of satisfaction with democracy). When these basic demographic predictors (as well as fixed effects) are used, attitudes of nearly 61% of respondents are predicted correctly in expectation. An expected proportional reduction of error of 14.7% can be achieved by predicting attitudes to democracy with these variables instead of guessing the modal answer for every observation in the dataset.
The step from the first row to the second row in Table 1 is most informative for the purposes of this paper. This move allows us to observe whether – conditional on using three demographic predictions (income, education, gender) – there is any useful additional information contained in the age of the respondent. When age is added to produce predictions of Europeans’ democratic evaluations, the proportion of correctly predicted answers is 60.72%, relative to 60.65% when age is not used to predict attitudes (row 1). From a statistical perspective, age carries no meaningful signal. The fact that age comes out “statistically significant” in most regressions, is not substantively meaningful, because age does not allow us to produce better predictions of citizens’ views.
There are other predictors, however, that lead to more accurate predictions; when generalized trust is included in the model (row 3), the proportion of respondents whose attitudes can be predicted correctly in expectation rises by one percentage point. An even greater improvement in predictive power can be achieved when satisfaction with the national government is added to the model (in the fourth row): the expected share of respondents with correctly predicted attitudes rises to 67%. A saturated model containing subjective assessments of the state of the economy as well (row 5) yields, expectedly, the best predictions. When age is removed from the full model (row 6), predictive power declines by a tenth of a percentage point.
But could age appear inconsequential because the models are too rich? If age was the only independent variable available to a researcher, would there be any value in knowing how old a respondent is? The last model, displayed in row 7, shows that the answer is no. When the only variable used to predict democratic evaluations is age, the expected proportional reduction in error is slightly negative: anyone aiming to predict attitudes would be no worse off ignoring the information about age, even when data on respondents’ birth year is available. In fact, an analyst running a univariate probit regression with age on the right-hand side would perform worse than a researcher using a simple guessing rule; the model in row 7 misclassifies so many respondents that simply predicting the modal value (ŷ = dissatisfied) for all observations would yield moderately better predictions (hence the negative error reduction reported at the bottom of Table 1).
Three other approaches to verifying whether age is associated with democratic evaluations are taken up in tables A.2 and A.3 in the Online Appendix. First, is age a statistically significant variable in OLS regressions? Second, do goodness-of-fit statistics of OLS models improve in models containing age? Third, does any effect of age emerge under a linearity assumption? In supplementary analyses, the lack of substantive correlation between age and democratic evaluations is confirmed.
Additional evidence
A possible concern might be that the age brackets are arbitrary. Given the size of the cumulative ESS dataset, evaluations of democracy can be displayed for individuals of all ages. In Figure 2 the ESS data is pooled and average democratic evaluations are summarized by age. Other than the very youngest respondents standing out, there is no meaningful age-attitude gradient beyond the age of 24. Young people are clearly not more dissatisfied with democracy than older individuals. In fact, the youngest respondents (examining respondents’ answers year by year) are significantly more satisfied with democracy.

Satisfaction with democracy by age of the respondent.
The results in Table 1 and Figure 2 could be challenged by an assertion that “democratic evaluations have worsened only recently.” Although year fixed effects are used in most specifications, responses from 2002 to 2017 could indeed conceal changes that may be occurring over time. Figure 3 disaggregates the data into the following time periods: responses from 2002 to 2006 (the “pre-crisis period”), opinions given between 2007 and 2012 (a period of economic stagnation or outright recession in many countries in the sample), and finally responses from 2013 to 2017. The last time window was a period of mostly disappointing 7 economic recovery across Europe. If a “bad economy” makes people disillusioned about democracy, then improvements in satisfaction with democracy in recent years should be subdued.

Satisfaction with democracy by age group and by time period.
The bottom-right panel of Figure 3 is informative if the aim is to find out whether specifically the current generation of young citizens around Europe is skeptical of or dissatisfied with democracy. The answer is no. There are some moderate differences between cohorts, but there is no indication of strong pessimism among the current cohort of young Europeans in particular. Overall, Figure 3 suggests that democratic evaluations diverged somewhat over time. In the pre-crisis period, younger Europeans were only slightly more satisfied with democracy than older cohorts. After 2013, the difference in views between the youngest respondents and the remaining respondents has widened. This (modest) divergence led to a pattern in opposition to the common view that discontent is common among young people. In fact, they became more satisfied with democracy.
Finally, the analysis from Table 1 is repeated in the Online Appendix only with data from the last (2016–2017) wave of the survey to verify whether age has recently become informative about democratic evaluations (Table A.1). Again, the answer is no.
Conclusion
Millennials and the rest of the society are not coming apart in their evaluations of democracy in Europe. Evidence from the ESS reveals no patterns consistent with the notion that young citizens are less satisfied with democracy than middle-aged or older individuals. Overall, public opinion data reported here and in Voeten (2017) does not indicate that young people are more likely to be amenable to non-democratic governance than their older counterparts. Europeans are more satisfied with democracy now than they were five years ago.
Citizens’ evaluations of how a regime works in practice can shed light on democratic legitimacy for several reasons. First, it is hard to imagine a case where support for democratic principles declines while satisfaction with performance increases. Second, the outcome variable used in this paper allows us to analyze whether there is a discrepancy between expectations (the “promises of democracy”) vis-a-vis what the system actually delivers (the “reality of life in a democracy”). Even authors who appropriately caution against equating trust in institutions or regime evaluations with outright support for a particular regime allow that performance is the precursor to legitimacy (e.g. Linde and Ekman (2003) suggest “democratic legitimacy (support for the principles of democracy) derives to a great extent from the long-term performance of the democratic regime”).
Contrary to the aggregate, country-level summary statistics reported in earlier studies that relied on low-frequency surveys, individual-level evidence suggests that age plays no role in forming attitudes toward democracy. Survey responses popularized in the last two years – those implying that young people support democracy less than the rest of the population in democratic countries – appear to contradict the evidence of ascending satisfaction with democracy (Figure 1). Young Europeans were not unhappier with democracy before the Global Financial Crisis of the late 2000s than older citizens, and they did not become more dissatisfied with democracy after the crisis. These data challenge some of the concerns about a looming democratic deconsolidation.
When citizens are angry about the government’s handling of the economy, political alienation often ensues (Lockerbie, 1993) even in consolidated democracies. Political aftershocks from financial crises may be close to inevitable, but there is no a priori reason for them to be permanent. Indeed, across Europe, democratic evaluations have already recovered. An electorate ready to be critical of political elites and other authorities is one that is paying attention to material outcomes – surely a healthy act in a democracy.
Supplemental Material
DS_rap_revised_appendix – Supplemental material for Democratic deconsolidation revisited: Young Europeans are not dissatisfied with democracy
Supplemental material, DS_rap_revised_appendix for Democratic deconsolidation revisited: Young Europeans are not dissatisfied with democracy by Jan Zilinsky in Research & Politics
Footnotes
Acknowledgements
Valuable feedback from David Stasavage, Joshua A. Tucker, and two anonymous reviewers is gratefully acknowledged. I also thank Bernard Steunenberg, the journal editor.
Notes
Declaration of conflicting interests
The author(s) declared no potential conflicts of interest with respect to the research, authorship, and/or publication of this article.
Funding
The author(s) received no financial support for the research, authorship, and/or publication of this article.
Supplemental materials
Carnegie Corporation of New York Grant
This publication was made possible (in part) by a grant from the Carnegie Corporation of New York. The statements made and views expressed are solely the responsibility of the author.
References
Supplementary Material
Please find the following supplemental material available below.
For Open Access articles published under a Creative Commons License, all supplemental material carries the same license as the article it is associated with.
For non-Open Access articles published, all supplemental material carries a non-exclusive license, and permission requests for re-use of supplemental material or any part of supplemental material shall be sent directly to the copyright owner as specified in the copyright notice associated with the article.