
Abstract
In the period since the Reagan revolution that disrupted decades of Democratic control of the United States Senate, Democratic senators have proved remarkably resilient when running for reelection. Over the past 600 Senate elections since 1980, Republican incumbents have been defeated at more than twice the rate of Democrats, but won open seat elections at a significantly higher rate. This partisan disparity also appears in incumbent vote share, and is statistically and substantively robust to a range of model specifications accounting for existing theories. A series of explanations drawn from existing research explored in this paper fail to explain this trend, suggesting the need for future research targeting partisan differences in perceptions of parties in Senate campaigns.
Introduction
On the surface, the immediate electoral future of the Democratic Party in the United States Senate appears dreary, with Democrats forced to defend seats in 2018 in ten states won by Donald Trump in the preceding presidential election. Moreover, the allocation of two Senate seats regardless of state population, giving disproportionate power to small states, seems naturally stacked against the Democratic party. But the uncanny resilience of incumbent Senate Democrats in hostile territory in the past 36 years suggests their prospects are not nearly so bleak. Indeed, following the “Reagan revolution” that swept Republicans into office in 1980, Democrats have been defeated at only half the rate of Republicans (8% vs. 16%), whereas Republicans has been almost symmetrically successful in winning 60% of open Senate contests regardless of the incumbent party.
Given these apparent disparities between the parties, it seems wise to include “party” as a crucial variable when analyzing recent Senate election results, and to explore what sort of underlying behavior might create these disparities. But elections to the US Senate have been subject to far less study than either presidential elections or elections to the US House of Representatives. And while many of these studies have focused on why Senate elections appear much more competitive than House races, they rarely incorporate party into the larger story. Incumbency advantage has been found to be both smaller in the case of Senate elections compared to House elections (Ansolabehere and Snyder 2002), and declining in recent years (Jacobson, 2015). As this note demonstrates, the difference in partisan success is not only observed in partisan turnover, but also in overall vote share, and is robust to model specification and inclusion of all controls typically seen as accounting for Senate race competition. Thus, this note does not attempt to argue for one specific explanation, nor advance a new theory about partisan differences, but merely broaches an important empirical finding suggesting the need for more targeted research on partisan differences in Senate elections.
In exploring the divergent success of the two parties, I employ a data set of all Senate elections held on a national general election day from 1982 to 2016. The data set is 611 data points, which amounts to six elections for each seat plus a handful of special elections. 1 This period can be characterized by a high level of parity between the parties, with each party holding narrow majority control of the Senate during nine of the 18 elections. In contrast, Democrats often held large Senate majorities during the previous post-WWII era (1946–1980), but were defeated for reelection in similar numbers, shown in in Figure 1. The whole sample consists of 305 seats held by Democrats (including Democrat-leaning Independents), and 306 seats held by Republicans. Democrats won 309 of these races, and Republicans won 302. The distribution of open and incumbent seats and the turnover rate in each category are shown in Table 1. Both the difference in turnover between Democratic incumbents and Republican incumbents and the inverse disparity between Democrat-held open seats and Republican-held open seats are statistically significant at p < 0.01 and p < 0.02, respectively.

Senate seat turnover percentage by time period, 1948–2016.
Senate turnover by party, 1982–2016.

One might anticipate that this difference is merely due to Republicans getting unlucky in marginal elections, with no significant difference in the underlying distribution of vote share across these elections. But Table 2 reveals that Republicans incumbents have also significantly underperformed Democrats by three percentage points across the last 36 years of elections (column 1; p < 0.01) controlling for statewide partisanship. Moreover, this difference, in both vote share and likelihood of turnover, remains robust despite accounting for many theories used to explain incumbent success in past studies, such as regional differences, strategic retirements, fundraising, and challenger quality. 2 Each theory is discussed below with reference to this analysis. Equivalent analyses for open seats races, revealing no significant effects of party, are shown in Online Appendix Table D. 3
Effect of party on incumbent vote share and likelihood of turnover: Races involving senate incumbents, 1982–2016.
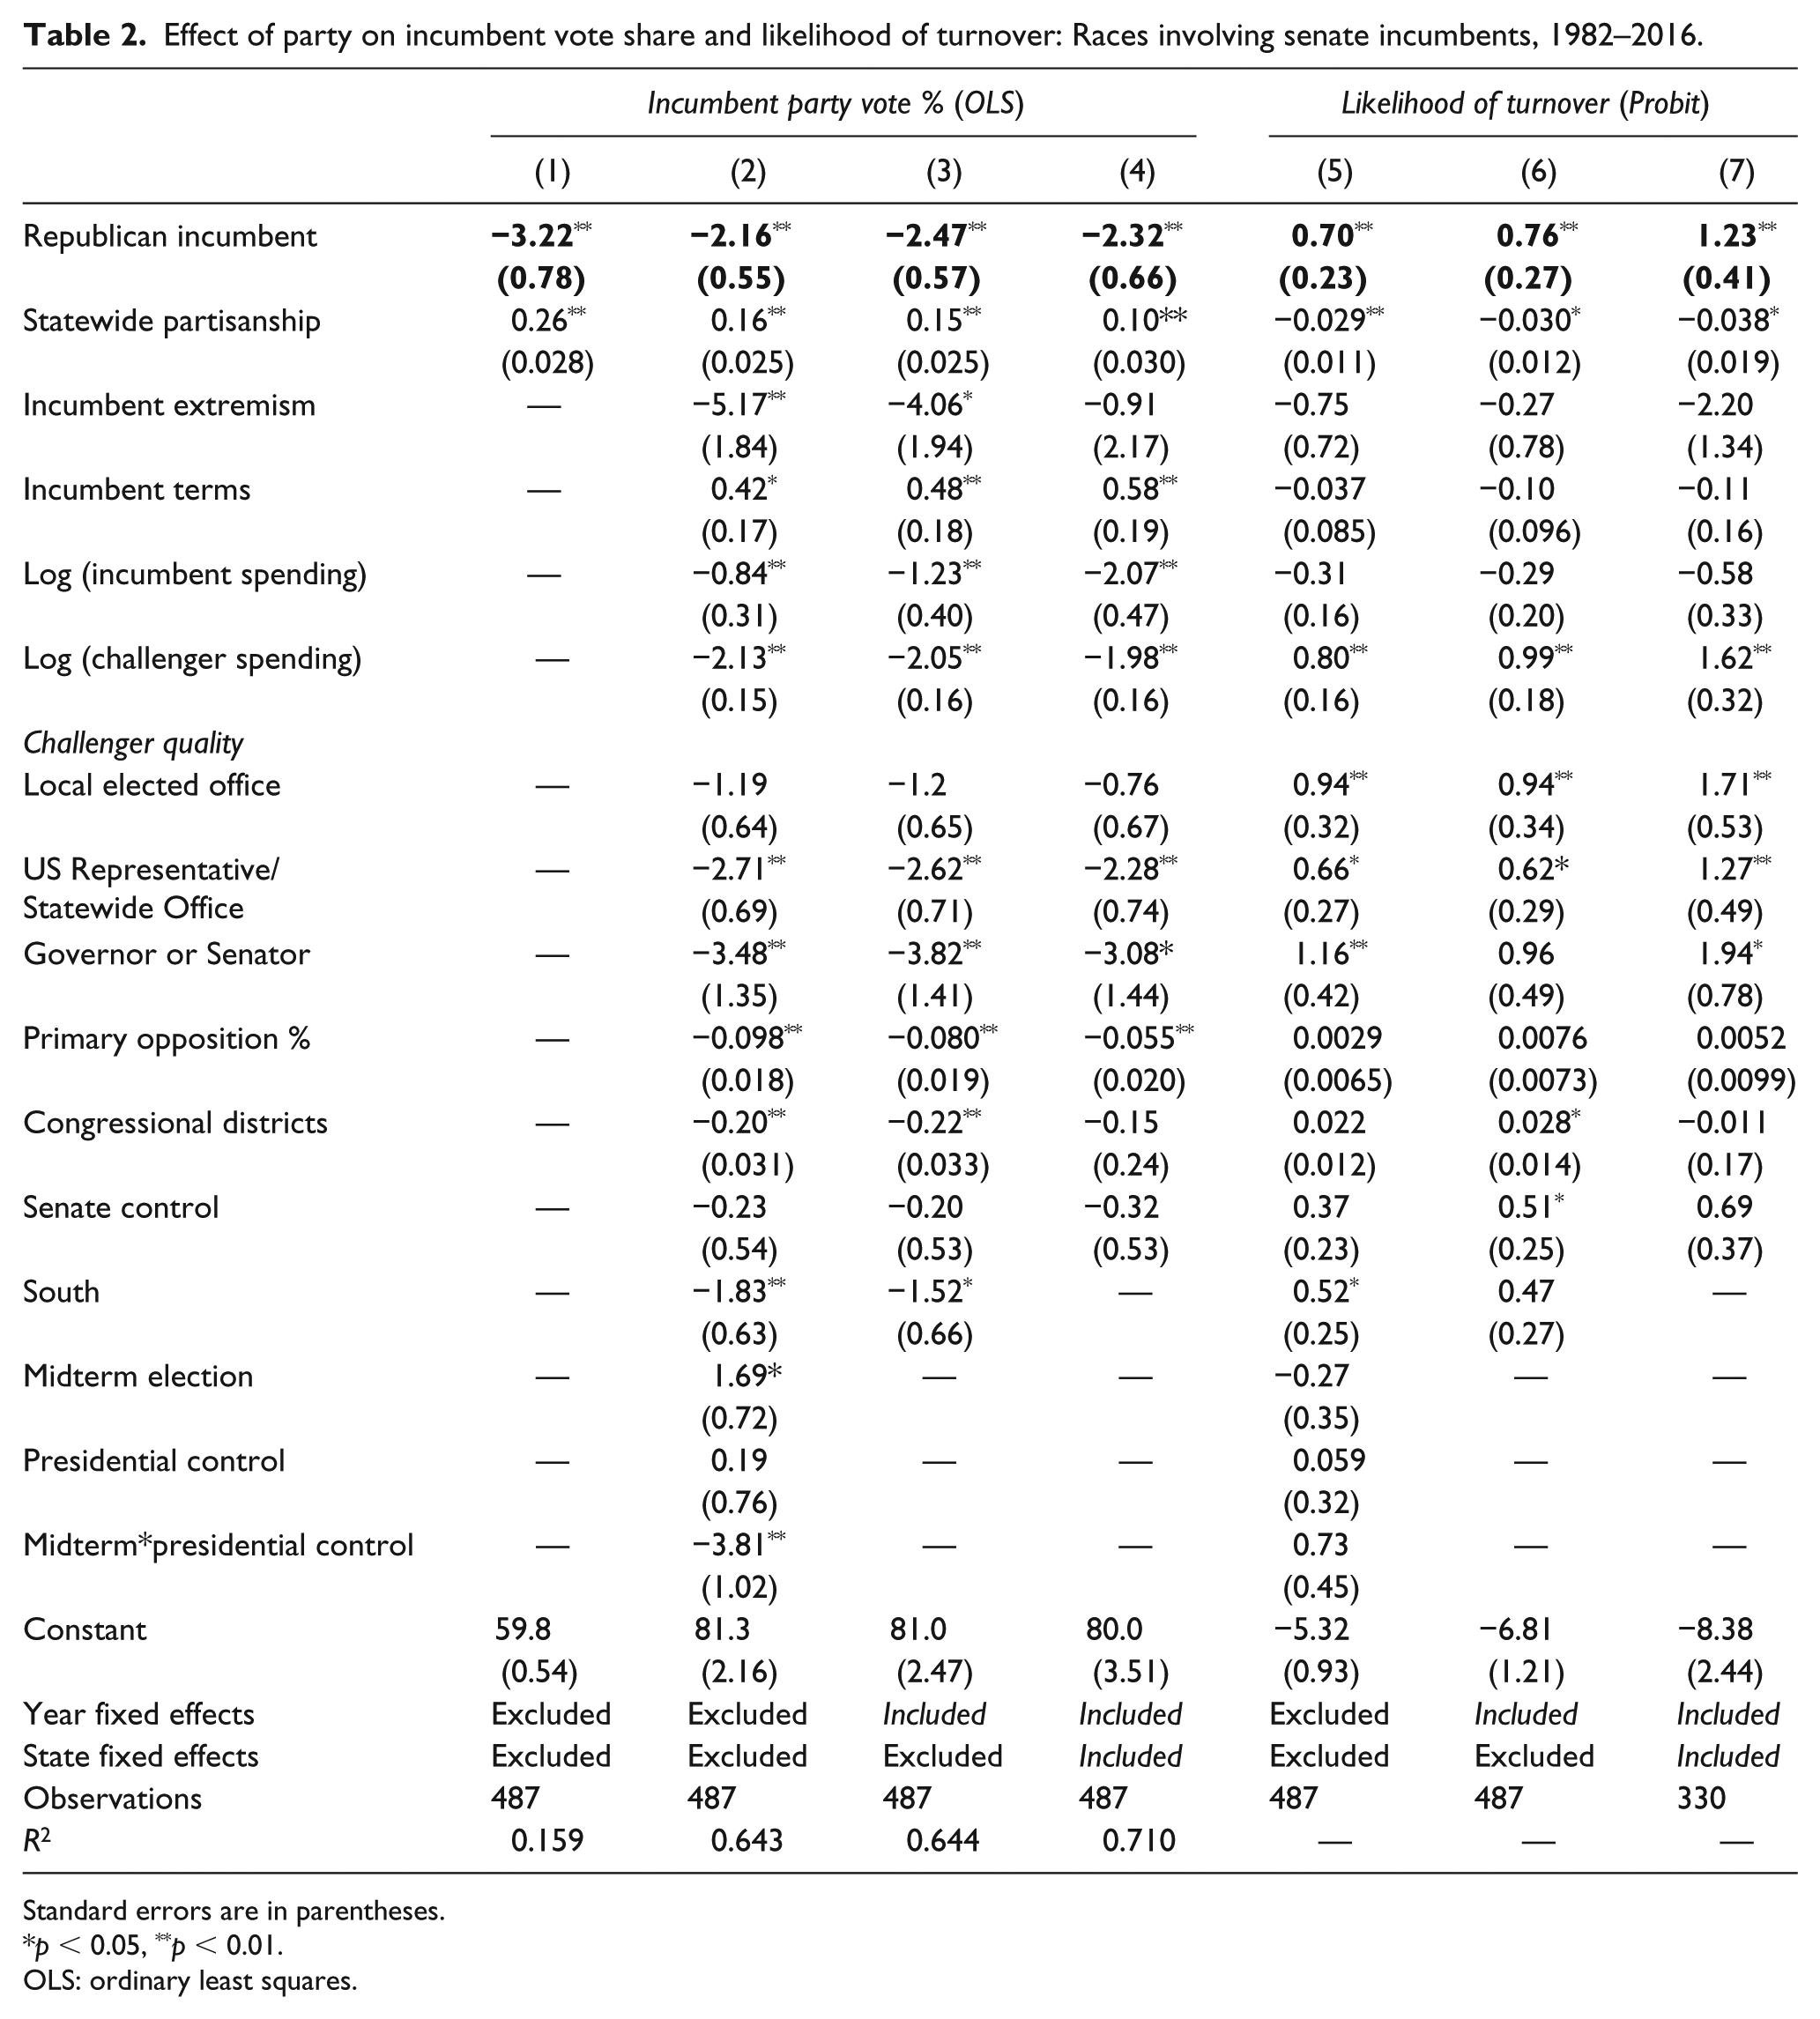
Standard errors are in parentheses.
p < 0.05, **p < 0.01.
OLS: ordinary least squares.
Definition of variables in Table 2
Incumbent percent adjusted (dependent variable, DV). This is the incumbent party’s percentage of the vote, but set to a ceiling and floor of 75% and 25%, respectively. 4
State partisanship: State Republican advantage. This is a measure of how much more Republican the state is than the national average, based on the two most recent presidential elections. The measure used in the regressions, Statewide partisanship, is the State Republican advantage when the incumbent is a Republican, and the inverse of this when the incumbent is a Democrat. 5
Incumbent extremism. This is the absolute value of an incumbent’s DW-NOMINATE score in the term immediately prior to the election year, with lower values indicating more moderation.
Terms. This is the number of complete terms that the incumbent had served prior to the election.
Campaign spending. I include variables for logged spending of both the challenger and incumbent parties, adjusted for state size and set to a floor of USD$1000. Past research suggests that challenger spending should be the more important of the two when an incumbent runs.
Challenger quality. This is scaled from 0 to 3, with 0 indicating the challenger had no prior elected experience. Challengers are coded “3” if they were current or former Governors or Senators; “2” if their highest office was US Representative or other statewide office; and “1” for lower offices. The regressions show the effect of each individual category, but results are substantively identical if this is modeled linearly or dichotomized.
Primary opposition. This is the percentage of the primary vote that was won by non-incumbents.
Senate control, Presidential control, Midterm. These are dependent variables indicating, respectively, if the incumbent’s party controlled the Senate, the presidency, or if the race was contested during a midterm election.
Congressional districts. This is the number of congressional districts that are in the state as a measure of relative population size.
Fixed effects. Fixed effects for year and state are used in some specifications. 6
Fluke elections
One possible hypothesis is that the disparity is due to just a few anomalous election years. For example, if there were only one or two particularly pro-Republican years in which a large number of Democrats retired, or one or two very pro-Democratic years with few retirements, a theory about persistent trends throughout the era would be less plausible. But this does not appear to be the case; as shown in Table 2 (columns 3 to 4), the partisan difference remains as statistically and substantively significantly large when year fixed effects are included. 7
Additionally, the disparity generally holds regardless of whether the election year was overall favorable to the Democrats, Republicans, or neither. In the four biggest Senate Democratic wave cycles (1986, 2000, 2006, 2008), the party picked up seats primarily by defeating Republican incumbents (5–7 every cycle). But in four of the five biggest Republican waves (1994, 2002, 2004, 2010), Republicans gained by winning a large number of seats from retiring Democrats, but defeated only one or two incumbents. And in most neutral years, the Republicans won the majority of open seats but lost more incumbents than the Democrats. In fact, the “flukiest” cycle of the past 36 years is the one that defies this trend: Republicans defeated five incumbents in 2014, the only cycle where more than two Democrats were defeated. Finally, although Jacobson (2015) notes that incumbent advantage in House elections has been declining in recent decades, this partisan divide is not confined to early or late elections in the data set. It appears in each of the 12-year “third” of the period (shown in Figure 1).
Midterm loss
It is well established that the President’s party tends to lose House and Senate seats in midterm elections (e.g., Erikson, 1988), while beneficial riding of coattails during presidential election years have been less consistently evident (e.g., Campbell and Sumner, 1990). Consistent with this, column 2 of Table 2 shows that, during midterms, incumbents of the President’s party perform 3.6 points worse on average than incumbents of the opposed party, with other controls included. But the difference between Republican and Democratic incumbent performance, both in vote share and turnover likelihood, remains robust to this factor. Partisan control of the Senate has no significant effect. Moreover, the greatest differences in turnover rates between parties are seen during presidential election years, not midterms, regardless of the party in power (shown in Online Appendix C). 8 Additionally, there is no significant effect of midterms years or presidential control on likelihood of turnover, as shown in column 5 of Table 2.
Ideological congruence
Canes-Wrone et al. (2002) suggest that more extreme members of Congress gain less electoral support. But this alone does not appear to be a significant factor in explaining the partisan asymmetry in vote or turnover. In most specifications in Table 2, the effect of incumbent ideological extremism is in the expected direction but not significant; in no case does it substantially alter the effect of party on vote share or turnover probability. Interacting party with both statewide partisanship and ideological extremism (shown in Online Appendix Table E) increases the effect of party when extremism is set to 0 while showing an interaction effect suggesting a decline in party difference as extremism increases, although this effect is only significant in some model specifications. 9 And this cannot be explained merely by an asymmetric distribution of these variables across parties. Online Appendix C breaks down races by statewide partisanship and ideological congruence, showing that the partisan difference in turnover rates persists across friendly and unfriendly states, and among ideological moderate and extreme Senators.
Regional explanations/Southern trends
Another possible explanation is that the disparity is due to regional partisan shifts in the country during this period, perhaps combined with the timing of retirements. For example, one could posit that many Senate seats in conservative Southern states would only remain Democratic as long as incumbents from an earlier era held the seat; when those incumbents retired, many Southern seats immediately shifted to the Republicans (e.g., Black, 2003). But Table 2 shows the partisan disparity remains after including a control for the Southern region, with no significant effect of interacting this control with incumbent party (shown in Online Appendix E). Outside the South, Republican incumbents are defeated at higher rates than Democrats in every other region of the country, so a purely regional explanation is implausible (shown in Figure 2 below). 10

Senate seat turnover percentage by region, 1982–2016.
Weak freshmen/Democratic retirements
If Republicans were winning a disproportionate number of open seats in a certain cycle, that may create a larger number of weak GOP freshmen running for reelection six years later. Yet this still does not explain the disparity between reelection rates by party, which persists after controlling for incumbent terms in office. Although freshman senators of both parties lose more often than very senior senators of their party, both junior Republicans and senior Republicans lose at roughly double the rate of Democrats of similar seniority (20% vs. 9% turnover rate for first-term senators; 12% vs. 6% for senators running for a fourth term or more).
A related explanation might be that Democrats retire more readily than Republicans when endangered. There is some evidence that candidates choose retirement strategically (e.g., Choi, 2017; Highton, 2011; Carson, 2005), but little research that this decision is asymmetric by party. I analyzed the effect of seniority and state and candidate ideology on the likelihood of retirement, with results in Table 3. Partisanship, Terms, and Extremism are operationalized as in Table 2, while “Incumbent Party Wave” is the Incumbent’s Party’s advantage in the House popular vote that cycle.
Effect of qualities of incumbent on probability of retirement, 1982–2016.
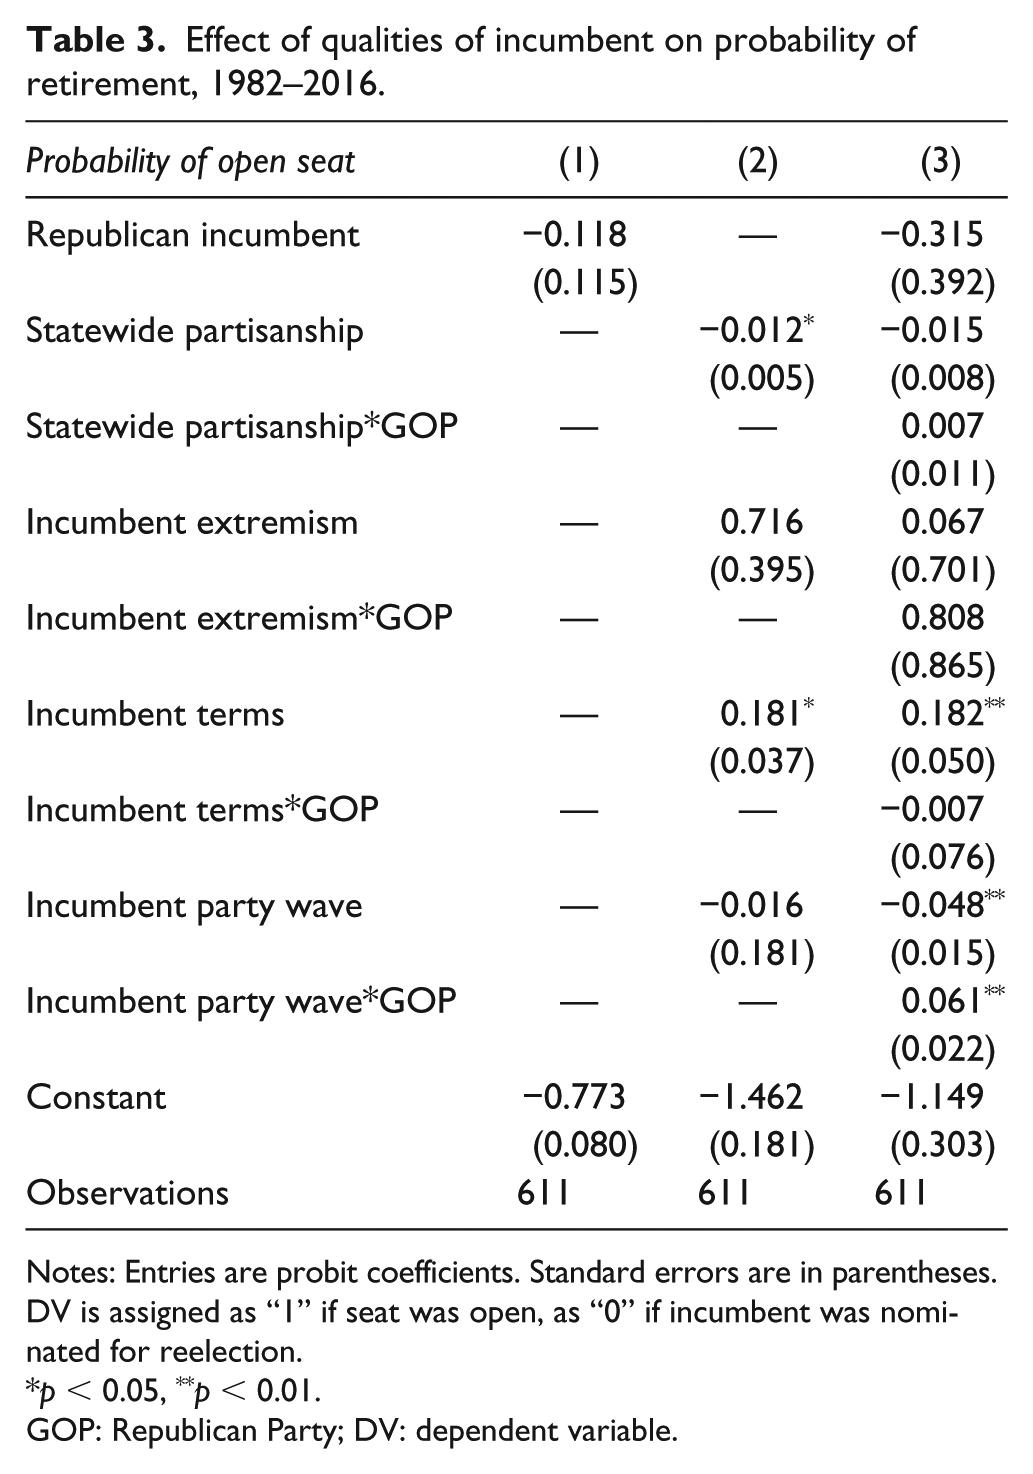
Notes: Entries are probit coefficients. Standard errors are in parentheses.
DV is assigned as “1” if seat was open, as “0” if incumbent was nominated for reelection.
p < 0.05, **p < 0.01.
GOP: Republican Party; DV: dependent variable.
This table shows that senior senators of both parties are more likely to retire than junior ones, and senators in ideologically hostile states are slightly more likely to retire than those in friendlier states. However, Republicans are not significantly less likely to retire than Democrats. And none of these factors affect Republican retirement decisions significantly differently from Democrats. Moreover, this alternate explanation is strongly contradicted anecdotally: 30 of 36 Democrats won while running in states at least 15 percentage points more Republican than the nation, compared to five of nine incumbent Republicans running in states that were as extremely Democratic.
There is one intriguing partisan asymmetry in Table 3: Democratic retirements are significantly more sensitive to waves than Republican retirements. However, a deeper examination of this phenomenon shows that Democrats are not more likely to retire during adverse waves; rather, Republicans are more likely to retire during favorable waves. 11 This might suggest more effective coordination of retirements by the Republican party, but this is likely a more meaningful explanation of Republican success in open seats than the Democratic incumbent advantage.
Challenger quality and fundraising
Several authors have argued that Senate campaigns can be divided into categories of intensity: “low key” and “hard fought,” largely based on the viability of the challenger (e.g., Westlye, 1991; Krasno, 1994; Kahn and Kenney, 1997, 1999). When the campaign fails to attract a high-quality challenger, the dynamics of the Senate campaigns resemble those of a typical House campaign, and incumbents are almost always reelected. But in the case of high intensity campaigns, with quality challengers and high spending, incumbents become quite vulnerable, more resembling a national campaign. Other authors focus specifically on challenger experience (e.g., Squire, 1989; Lublin, 1994). Table 2 measures the effect of both challenger experience and fundraising on incumbent success.
Although the independent effect of challenger quality in the post-1980 Senate data is consistent with existing research (25% of incumbents facing experienced challengers lose, compared to 4% of incumbents facing inexperienced challengers), this cannot explain the partisan difference, as the results are robust to the inclusion of this control. There is also no significant difference between the overall quality of challengers faced: 46% of Democrats faced experienced challengers, compared with 47% of Republicans, and the rate of turnover was about double for Republicans for each category of challenger.
The concept of campaign “intensity” also meshes well with findings that Senate election outcomes are more sensitive to challenger campaign spending than incumbent spending (Jacobsen, 1980; Abramowitz, 1988, 1991). While incumbent spending is less variable, high challenger spending may be a signal of a high-intensity campaign (e.g., Goodliffe, 2007). Indeed, Jacobson (2006) finds that greater challenger spending tends to induce greater incumbent spending, probably indicative of high campaign intensity. The results in Table 2 align with this past research on campaign intensity, suggesting challenger spending is more important to outcomes than incumbent spending; the somewhat perverse effect of incumbent spending is likely explained by incumbents being forced to spend more against high-quality challengers. But the partisan difference, both with respect to turnover rates and vote share, is also robust to controlling for incumbent and challenger spending. The total incumbent spending advantage is also almost identical by party; the median spending ratio in favor of the incumbent is 2.8-to-1 for Republican incumbents, compared to 2.7-to-1 for Democrats. 12
Constituency size
Some have argued that incumbent vulnerability is related to constituency size (Abramowitz, 1988; Hibbing and Brandes, 1983), with incumbents defeated more often in populous states because they are less personally in-touch with a large number of their constituents. But any claim that the observed partisan difference can be explained by constituency size is probably implausible for two reasons. First, this relationship is far from a universal finding. Krasno (1994) concludes there is no evidence for a relationship between constituency size and incumbent performance in all but a handful of very large states, while Lascher (2005) argues that small constituencies may lead to more competitive elections through higher quality challengers. Second, this past research would probably predict a partisan effect in the reverse direction from what we observe: incumbents would be safer in small states (generally more Republican) and more vulnerable in large states (generally more Democratic), and thus on average we would expect to see more vulnerable Democratic incumbents. Moreover, Table 2 shows the partisan disparity is robust to controlling for state size, operationalized by number of CDs.
Primary opposition or divisiveness
Kenney and Rice (1984) find that increased divisiveness of a Senate primary election (as measured by the winner’s primary vote percentage) may carry over into reducing the candidate’s vote in the general election. And indeed, Table 2 shows that primary opposition significantly correlates with reduced general election vote share among incumbents (though it does not significantly affect turnover likelihood). However, the partisan difference remains substantively and significantly robust when including this control. Given the effect of Tea Party candidates on the recent outcomes in several seats, one might also hypothesize that primary opposition would differently affect Republican and Democratic candidates. However, there is no significant difference between the effect that primary opposition has on Republican incumbents compared to Democrats, or any significant difference within subsets of primary strength (see Online Appendices C and E).
Economic factors
Lublin (1994) finds that national economic conditions are a significant predictor of Senate incumbent vote share. I tested the effects of a variety of national economic indicators, including change in disposable income, unemployment, and stock market growth, on both incumbent vote share and turnover likelihood. None of these indicators significantly correlated with turnover, and only unemployment rate significantly correlated with vote share; more importantly, the independent effect of party remained statistically and substantively robust to the inclusion of all economic indicators (results in Online Appendix F, columns 5 and 6).
Partisan issue competence
Throughout much of the 20th century, an apparently persistent public preference for divided government existed in which Republicans more often won the presidency but Democrats won majorities in Congress. Jacobson (1990) explained this by arguing that voters’ choice of party control of each branch is based on perceived differences between the parties. He noted that in late 20th century surveys, voters judged Republicans more competent in dealing with issues that affect the nation as a whole, such a defense, taxation, and inflation, while judging Democrats more competent on issues that affect small groups and localities, such as unemployment, agriculture, education, and problems affecting minorities. He also notes that voters prefer presidents who will focus on national problems, but legislators who will put the interests of their district ahead of the national interest. This explanation relying on party issue competence has diminished since the Republican revolution of 1994, but it could also apply to preferences over incumbency and open seats. If voters prefer Republicans when dealing with national issues, ideology may be more important in judging a Republican incumbent, while seniority may be more important when judging a Democrat, seen as strong in delivering local or distributional benefits. More recently, Grossman and Hopkins (2016) argue that Republicans campaign more ideologically, while Democrats campaign through providing interest group benefits. Grimmer (2013) finds that Senate incumbents of both parties in ideological unfriendly states may emphasize appropriations over position taking, but the data explored here suggests that Democrats may be asymmetrically successful in doing so.
Although this theory is intuitively promising, an initial exploration based on available election and survey data yields contradictory and inconclusive results. This theory would suggest that state partisanship and incumbent ideology should be more important to vote outcomes involving Republican incumbents, while perhaps factors like seniority would be more important to Democratic outcomes. But models interacting party with partisanship, ideology, and terms (shown in Online Appendix E) yield little significant evidence for this pattern. 13
Additionally, I briefly explored this idea through two survey series targeting Senate elections: the National Election Studies Senate Study conducted in 1988–1992, and the Cooperative Congressional Election Study (CCES) from 2008 to 2012, with contradictory results. In the earlier Senate Study, voters seeking local benefits were significantly more likely to vote for Democratic incumbents compared with voters concerned about national issues, and all voters were more likely to identify local activity as a strength of Democratic incumbents running for reelection than Republicans, providing some initial support for the theory. But the more recent CCES revealed no evidence that voters weighed ideology more heavily when evaluating a vote for Republican incumbents (shown in Online Appendix Tables H–J.) Moreover, while these studies remain the best existing survey resources on Senate elections, each has significant weaknesses. The National Election Studies Senate Study is now 25 years old, and covers only a set of low-competition election cycles atypical of the larger era. The CCES, designed largely for study of the lower house, is more poorly adapted to Senate research in both its sample and choice of questions.
Discussion
This note uncovers an approximately 3-percentage-point difference in vote share and an 8-point difference in turnover rate between Democratic and Republican Senate incumbents persisting over more than three decades. While such an effect may seem superficially small, it is equal to or larger than effects observed by other canonical factors studied in US Senate elections. 14 Additionally, the effect is of substantive importance to government outcomes. The gap in reelection rates observed here suggests a net gain of 3–4 seats for the Democrats, enough to frequently swing control over such a closely contested body. Yet this possibly pivotal difference has remained unexplored, further suggesting a need for additional study targeted at Senate elections, campaigns, and voter perceptions of parties.
Beyond the potential of additional individual-level research, the upcoming 2018 midterm elections also provide a possibly pivotal test of the theory for several reasons. First, although the partisan patterns in the late 20th century appear to have been replicated in the first decade of the 21st, results in the last two cycles call into question whether those trends are still relevant today. As mentioned above, 2014 represented a clear exception in which five incumbent Democrats were defeated. And despite only Republican incumbents being defeated, 2016 presented a poor test overall, with no Democrats running in strongly Republican states. The year 2018 presents a clearer contrast, with ten Democrats running in states won by the most recent Republican presidential candidate. On top of the typical benefit of running in a midterm election against the President’s party, the patterns explored here suggest that these Democratic incumbents may be able to overcome unfavorable terrain, perhaps due to an ability to craft a moderate image independent from their national party, in a way that both Republican incumbents and all candidates running in open seats have been unable to. For almost 40 years, the brand Democratic incumbents presented to voters has resisted overall partisan trends in a way the Republican brand has not. Even with the backdrop of a divisive Republican president, 2018 presents an unusually intimidating challenge to that brand. Whether the resilience of Democratic Senate incumbents proves to be a historical anomaly or an enduring but unstudied fact in American politics may also hang in the balance.
Supplemental Material
Senate_Incumbent_Note_Appendix_Tables_Sept_2018 – Supplemental material for Democratic incumbent resilience in the post-1980 Senate
Supplemental material, Senate_Incumbent_Note_Appendix_Tables_Sept_2018 for Democratic incumbent resilience in the post-1980 Senate by Nicholas Goedert in Research & Politics
Footnotes
Declaration of conflicting interest
The author declared no potential conflicts of interest with respect to the research, authorship, and/or publication of this article.
Funding
The author received no financial support for the research, authorship, and/or publication of this article.
Supplemental materials
Notes
Carnegie Corporation of New York Grant
This publication was made possible (in part) by a grant from the Carnegie Corporation of New York. The statements made and views expressed are solely the responsibility of the author.
References
Supplementary Material
Please find the following supplemental material available below.
For Open Access articles published under a Creative Commons License, all supplemental material carries the same license as the article it is associated with.
For non-Open Access articles published, all supplemental material carries a non-exclusive license, and permission requests for re-use of supplemental material or any part of supplemental material shall be sent directly to the copyright owner as specified in the copyright notice associated with the article.