
Abstract
Hagopian et al. (2013) published a headline-grabbing estimate for the Iraq war of half a million excess deaths, i.e. deaths that would not have happened without the war. We reanalyse the data from the University Collaborative Iraq Mortality Study and refute their dramatic claim. The Hagopian et al. (2013) estimate has four main defects: i) most importantly, it conflates non-violent deaths with violent ones; ii) it fails to account for the stratified sampling design of the UCIMS; iii) it fully includes all reported deaths regardless of death certificate backing, even when respondents say they have a death certificate but cannot produce one when prompted; iv) it adds approximately 100,000 speculative deaths not supported by data. Thus, we reject the 500,000 estimate. Indeed, we find that the UCIMS data cannot even support a claim that the number of non-violent excess deaths in the Iraq war has been greater than zero. We recommend future research to follow our methodological lead in two main directions; supplement traditional excess death estimates with excess death estimates for non-violent deaths alone, and use differences-in-differences estimates to uncover the relationship between violence and non-violent death rates.
Introduction
Large excess death numbers draw big attention. Examples include the high profile estimates of excess deaths for the Democratic Republic of Congo (International Rescue Committee, 2007) and Darfur (Hagan and Palloni, 2006; Degomme and Guha-Sapir, 2010). 1 Such numbers are widely considered scientifically sound, of great interest to the general public and worthy of publication in top peer-reviewed journals, although they often generate controversy in both academic journals and the media (NBC News, 2008; Spagat et al., 2009; ScienceInsider, 2010).
The estimate of 500,000 excess deaths in the Iraq war, 2003–2011, by Hagopian et al. (2013) was a media event complete with a press release (University of Washington, 2013). In the present paper we reexamine the Hagopian et al. (2013) dramatic claim using exactly the same dataset as Hagopian et al. (2013) do, the University Collaborative Iraq Mortality Study (UCIMS). We find that the UCIMS data do not support the 500,000 claim. Most importantly, the estimate unravels as soon as we distinguish between violent deaths and non-violent deaths. Estimates for non-violent excess deaths have extremely wide uncertainty intervals that stretch well below zero. Moreover, we employ a differences-in-differences (DiD) design that finds no local spillovers running from war violence to elevated non-violent death rates, reinforcing our null finding for non-violent excess deaths. 2 Three further corrections and improvements to the original analysis undermine the half-a-million claim even more. These are accounting for; i) stratification in the UCIMS sampling design; ii) weak death certificate backing for some deaths; and iii) the feeble basis for nearly 100,000 deaths which enter the estimate through rounding and confusion between deaths and excess deaths. 3
Our approach can serve as a model for future studies of excess war deaths. In particular, we recommend that future researchers make excess death estimates for non-violent deaths alone rather than following the established practice of conflating violent deaths with non-violent deaths in excess death estimates. We also advocate the use of DiD strategies to test whether war violence causes increases in non-violent death rates in areas where war violence is prevalent.
Our analytical improvements
The UCIMS survey of deaths in the Iraq war is the most recent high-profile estimate of excess deaths in war. The data come from a nationally representative survey conducted in mid 2013 of individuals in 2,000 randomly selected households situated in 100 clusters across Iraq. The fieldwork for this study appears to be good and the data are freely available to a reasonable level of detail. 4 We are able to replicate the Hagopian et al. (2013) results almost exactly once we accept all their assumptions. So we turn now to several corrections and improvements to the original analysis.
Measuring excess war mortality
War can cause both violent deaths, or direct battle deaths from the conflict, as well as non-violent deaths, arising indirectly from the consequences of the conflict. Yet violent deaths are easier to attribute to war than are non-violent deaths that can, at best, be only indirectly linked to war. Examples of non-violent war deaths can include hospital patients who die after not receiving crucial medical treatments due to war-caused power outages in hospitals or people who die of cholera after war-related damage to water treatment facilities. The number of non-violent deaths indirectly attributable to war might be substantial in some modern conflicts, although it is difficult to pin down these effects analytically.
The primary challenge for estimates of the number of non-violent deaths caused indirectly by a war is to avoid including non-violent deaths that would have occurred even without war. The main strategy used in the literature to tackle this separation problem is to define a counterfactual death rate that, one argues, would have occurred if war had been avoided. This counterfactual death rate, sometimes known as a baseline death rate, is subtracted from the death rate that actually occurs during the war. The difference between the actual death rate and the baseline death rate is commonly designated as an excess death rate. This excess death rate is then multiplied by the size of the at risk population to obtain a number of excess deaths. 5
Hagopian et al. (2013) follow most literature in using the pre-war death rate as their baseline (Checchi and Roberts, 2005). The key assumption underpinning this choice is that the pre-war death rate would have carried forward in time unaltered if war had never broken out. If this assumption is approximately true then it is reasonable to view the during-war death rate minus the baseline death rate as a war-caused excess death rate.
We stress that researchers generally conflate violent deaths with non-violent deaths when they make excess death calculations. Yet this conflation of two very different death types is fundamentally inconsistent with the whole point of invoking the excess deaths concept in the first place: to capture the possibility that war violence can lead indirectly to non-violent deaths. Mixing violent deaths into an excess death estimate confounds the channel running from violence to non-violent death with a distinct, and trivial, channel running from violence to violent deaths. Thus, a standard excess death estimate can create an illusion that a war is indirectly causing nonviolent deaths even for a war that causes exclusively violent deaths. Analogously, one might state that the average vegetarian consumes approximately one ton of vegetables plus meat per year. While technically correct this statement could create a false impression that the average vegetarian hypocritically consumes meat when, in fact, the ton of vegetables plus meat breaks down into one ton of vegetables and 0 tons of meat. Therefore, we argue that the best practice for evaluating the human cost of war should proceed along two tracks. First estimate direct violent deaths and then estimate excess non-violent deaths. Despite this advice, we maintain consistency with the existing literature by also estimating excess deaths in the standard manner that conflates violent deaths with non-violent ones.
Non-violent deaths versus violent deaths
The excess deaths concept asserts that war violence leads indirectly to non-violent deaths. If so, then we should be able to link war violence with elevated non-violent death rates. We attempt to make this connection with a difference-in-difference (DiD) estimator (Angrist and Pischke, 2008), the mechanics of which we will explain in detail in section (Trying to link violence with non-violent death rates). Here we just provide some basic intuitions.
Our DiD estimator tests whether relatively large increases in non-violent deaths in particular locations are associated with relatively high violence levels in these locations. This approach detects spillovers from violence to non-violent deaths as long as these spillovers operate at a local level. If, for example, local bomb attacks cause substantial numbers of non-violent deaths by disrupting local water purification or hospital services, then the DiD estimator should detect these indirect effects of violence. On the other hand, the DiD approach will not detect indirect channels running from violence to non-violent deaths if these effects are diffused across space. A DiD estimator would not be useful for analysing the effects of violence that decreases national tax revenues, leading to national budget cuts to health care that increase national death rates. Moreover, national or international policy may direct aid programme to violence-plagued local areas, offsetting real local spillovers in full or in part. Accounting for such contrary forces would be tricky. Aid would prevent excess deaths that would appear if aid were stopped and if would be difficult or impossible to measure these countervailing forces. Despite these caveats, many plausible spillovers will tend to operate at the local level and, therefore, the DiD estimator is a valuable tool for exposing such effects.
Stratification
The UCIMS is a cluster survey stratified by governorate. Hagopian et al. (2013) account for clustering in their uncertainty intervals but, incorrectly, ignore the impact of stratification on both their central estimates and uncertainty intervals. This is a mistake because stratification can have big effects on both of these calculations (Working Group for Mortality Estimation in Emergencies, 2007; Lohr, 2009). Table 1 displays the UCIMS stratification scheme by governorate. Households in governorates with relative weights below 1 have inclusion probabilities higher than what they would have had under an equal probabilities scheme and vice versa. For example, a death in Anbar is 5.5 times more likely to appear in the sample than is a death in Thi-Qar (
Relative weights by governorate.

Each governorate’s weight is its share of total population divided by its share of respondents in the survey.
A second stratification issue is that the procedures for estimating uncertainty intervals should incorporate the complexities of the sampling scheme, such as departures from equal inclusion probabilities. Hagopian et al. (2013) bootstrap (Shalizi, 2010) their uncertainty intervals but, incorrectly, ignore stratification in their computations. For example, the UCIMS sample contains 23 Baghdad clusters so each bootstrap resample should also contain 23 Baghdad clusters, each drawn with replacement from the 23 original Baghdad clusters. The Hagopian et al. (2013) resampling does not satisfy this requirement but we fix this problem in our bootstraps.
Note that all of the uncertainly intervals (UIs) in both our paper and in the original Hagopian et al. (2013) paper are obtained through bootstrapping, although the dataset has only 100 clusters which is not enough to be sanguine about using asymptotic theory (Flynn and Peters, 2004; Pons, 2007). Thus, the reader should regard all UIs in the paper as too narrow, a point which makes the Hagopian et al. (2013) claim of 500,000 excess deaths even less credible than the uncertainty intervals we publish in this paper suggest.
Death certificates
The UCIMS dataset provides the outcome of each interviewer attempt to verify an in-sample death with a matching death certificate. There are 385 reported deaths in the dataset, of which interviewers record seeing death certificates for 284. However, 32 times respondents state that they do not possess a death certificate to document a reported death. In a further 66 cases, a respondent reports a death, claims to have a death certificate confirming the death, but fails to produce the supposed death certificate when prompted to do so in the interview. 7 We find this last type of reported death to be rather dubious; why would someone claim to have a death certificate he/she does not actually have? Nevertheless, many, perhaps even most, cases of reported deaths not backed by death certificates are real. People can lose or misplace a death certificate and in some cases, particularly during the first phase of the war, death certificates were never issued. Thus, it is difficult to quantify the uncertainty surrounding deaths not fully backed by death certificates although it is suboptimal to simply ignore this issue as Hagopian et al. (2013) do in their analysis. We address death certificate uncertainty by presenting four separate sets of estimates. These either i) accept all reported deaths, as in the original paper; ii) reject all reported deaths without a shown death certificate; iii) reject reported deaths for which respondents admit to not possessing a death certificate; or iv) reject reported deaths for which respondents say they have a death certificate but fail to produce one.
From 400,000 to 500,000
There is a confusing conflict between the Hagopian et al. (2013) UCIMS-based central estimate of 406,000 excess deaths and the claim in the Hagopian et al. (2013) paper that they estimate 500,000 deaths. 8 The authors reach beyond their data to bridge the gap of nearly 100,000 deaths. Specifically, they argue that there is a war refugee population of approximately two million people not covered by their survey from which there were, they say, approximately 56,000 deaths. They then add 56,000 to 406,000 and round up to 500,000. There are two good reasons to reject this manoeuvre. First, 56,000 deaths in a refugee population of 2 million is barely above the baseline rate of 2.89 per 1,000 per year that Hagopian et al. (2013) use in their excess death estimates. Therefore, it is not clear that adding in refugees should increase the excess death estimate at all. Therefore, if anything, adding in refugees should decrease rather than increase the excess death estimate. Second, there can be no good basis to round from 462,000 all the way up to 500,000.
In search of excess deaths
Excess deaths estimates
Figure 1 presents a range of excess death calculations. In panel (a), we focus only on non-violent deaths whereas in panel (b), we revert to the standard approach of conflating violent deaths with non-violent deaths. Our primary and preferred estimates are the ones in panel (a) since, as argued in section (Measuring Excess War Mortality), the concept of excess deaths is fundamentally about war violence causing non-violent deaths, not about war violence causing violent deaths. We account for stratification and clustering in all of these results.

Excess Deaths Estimates and Uncertainty Intervals.
The top estimate in panel (a) shows that we cannot reject a hypothesis of negative non-violent excess deaths at a 10% level, even if we accept every reported death in the survey regardless of the quality of its death certificate backing. Of course, discounting reported deaths without death certificates drags the estimates further downwards. The central estimates for non-violent excess deaths in panel (a) are all well below 200,000 and the bottoms of these uncertainty intervals all drop below
The estimates in panel (b) show that the UCIMS data do not support the Hagopian et al. (2013) claim of 500,000 excess deaths even when we follow Hagopian et al. (2013) in conflating violent deaths with non-violent ones in our excess deaths estimates. Although the stratification adjustment barely moves the central estimates, it does widen the uncertainty interval substantially, even pulling the bottom of the uncertainty interval below zero for the top estimate in the panel that accepts all deaths regardless of death certificate backing. With this estimate we can still reject a hypothesis of negative excess deaths at around a 5% level, but a hypothesis of 500,000 or more excess deaths, well above the central estimate, is roundly rejected. The other estimates include only deaths with various degrees of death certificate backing, lowering all the central estimates considerably. We estimate 210,000 excess deaths with the uncertainty interval swinging by more than 300,000 deaths in either direction when we insist on death certificate backing for all deaths. This estimate is at an extreme, as noted in section 1, but the top estimate is also at an extreme although, perhaps, closer to the truth.
Trying to link violence with non-violent death rates
The simplest DiD framework makes two binary divisions of the country along two separate dimensions: time and space. These divisions give us four groupings: a pre-war period and a during-war period crossed with a violent zone and a non-violent zone. The goal is to test whether living in the violent zone during the war is associated with relatively high non-violent death rates. We operationalise this idea with equation 1 in which

The estimated parameters are
Our main DiD estimates use a generalization of the above framework that does not force locations into the binary categories of either violent or non-violent (equation 2).
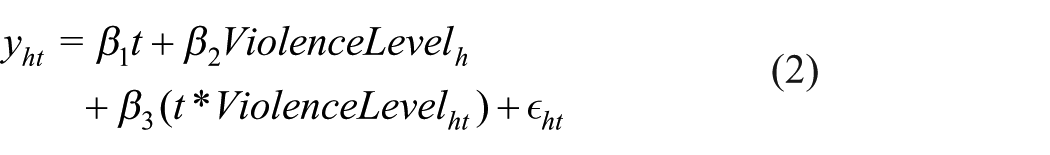
Table 2 gives the results from these regressions. Violence is measured as the number of fatalities per 100 inhabitants in the governorate containing household
Differences-in-differences regression models for the number of non-violent deaths per household.

FE: fixed effects; NB: negative binomial; AIC: Akaike information criterion; AUC: area under curve.
Notes. Robust standard errors, clustered at cluster-level, are in parentheses where ***, **, and * indicate statistical significance at the 1%, 5%, and 10% levels, respectively.
The variable of interest is the product of the time period (Period), coded 1 for the war period and 0 for the pre-war period, and the violence level. This estimated coefficient gives the relationship between local violence and local non-violent death counts during the war period, i.e. after controlling for the effect of living, both before and during the war, in a governorate (or cluster) that turns out to be violent during the war. These key estimates (Period
Comparisons of Counterfactuals
We have searched for possible indirect effects of violence on non-violent death rates using two different methods, based on two different counterfactual analyses. We now briefly consider the difference between the two counterfactuals.
The key assumption in the excess deaths counterfactual is that the pre-war death rate would have carried forward in time if war had never broken out, i.e. the pre-war mortality rate is what the during-war mortality rate would have been without the war. If this assumption is approximately true then it is reasonable to view the actual death rates minus the baseline death rate as excess deaths caused by war. A problem with this counterfactual is that there can be important changes that affect mortality rates that are separate from and unconnected with war onset but that, nevertheless, happen at roughly the same time as onset does. Moreover, the Human Security Report (HSR) made an important critique of the excess deaths concept while accepting its main premise of extrapolating pre-war death rates forward in time to create a baseline (Human Security Report Project, 2011). HSR argued that death rates tend to decrease over time so it recommended projecting forward a decreasing death-rate trend rather than a flat line frozen at a pre-war rate. Thus, HSR would interpret deviations from pre-war trends, rather than deviations from pre-war levels, as evidence for excess deaths. The HSR modification is a step forward in principle. However, in practice it is quite difficult to accurately measure a pre-war death rate, let alone a trend. Hence, adopting the HSR recommendation would be likely to add considerable random noise into excess death calculations as a price for improving their theoretical foundations. 11
The implied counterfactual for the binary DiD is that the trend in the non-violent zone, pre-war to during-war, gives the trend the violent zone would have experienced without the war. This approach potentially improves on the standard excess deaths approach by allowing for a common, but possibly nonzero, national mortality rate trend without war rather than mechanically applying a pre-war baseline mortality rate. Moreover, the binary DiD addresses the main HSR concern by baselining a trend, rather than just a fixed level. But the binary DiD has at least two important weaknesses. First, pre-war trends could be very different in the two zones, in which case a DiD regression might, spuriously, attribute differing during-war trends to violence. The standard practice in the literature of checking for common earlier trends will often be infeasible in war mortality studies because there will not be a long enough run of data to do so. 12 Second, this approach only picks up localized spillovers from violence to non-violent death rates. A DiD regression would give insignificant results if, for example, violence causes non-violent mortality rates to increase equally in both violent and non-violent zones.
Conclusions
We use the same data as the original authors did and refute the claim (Hagopian et al., 2013) that the Iraq war caused half a million excess deaths. Our analysis is superior to the original work because we account for i) most importantly, the distinction between violent and non-violent deaths; ii) the stratified sampling design; iii) uncertainty over deaths not confirmed by death certificates; and iv) the baseless increase from 406,000 up to 500,000.
The war in Iraq has certainly led to several hundred thousand violent deaths and perhaps some non-violent excess deaths as well. 13 However, methodologically sound estimates based on the UCIMS data struggle to rule out even negative excess death estimates for violent plus non-violent deaths combined. This failure probably reflects data and methodological weaknesses as much as the underlying reality.
Our paper offers methodological lessons that extend beyond the Iraq application. First, excess death calculations should always include estimates for non-violent deaths alone. Second, researchers should supplement excess death estimates with DiD ones. These ideas have been helpful in our Iraq analysis and should bear further fruit in the future.
Footnotes
Acknowledgements
We are very grateful for useful comments from Beth Daponte, Nils Petter Gleditsch, Joakim Kreutz, and Jon Pedersen, as well as the anonymous reviewers and the editor Kristian Skrede Gleditsch. We also thank Richard Podkolinski for programming assistance and participants in the session Population and Health Impacts of Poverty and Armed Conflict at the 2015 International Studies Association (ISA) conference where an early version of this work was presented.
Declaration of Conflicting Interest
The authors declare that there is no conflict of interest.
Funding
This research received no specific grant from any funding agency in the public, commercial, or not-for-profit sectors.
Supplementary Material
The supplementary files are available at http://journals.sagepub.com/doi/suppl/10.1177/2053168017732642. The replication files are available at ![]() .
.
Notes
Carnegie Corporation of New York Grant
This publication was made possible (in part) by a grant from Carnegie Corporation of New York. The statements made and views expressed are solely the responsibility of the author.
References
Supplementary Material
Please find the following supplemental material available below.
For Open Access articles published under a Creative Commons License, all supplemental material carries the same license as the article it is associated with.
For non-Open Access articles published, all supplemental material carries a non-exclusive license, and permission requests for re-use of supplemental material or any part of supplemental material shall be sent directly to the copyright owner as specified in the copyright notice associated with the article.