
Abstract
Research on agenda-setting dynamics in American politics has a rich and deep history. Recent efforts to extend this work into other countries provides a comparative perspective on how differing institutional designs shape attention allocation and punctuated equilibrium. This comparison is not only possible cross-nationally, but also between the American states. Using an untapped resource—the Pennsylvania Policy Agendas Project—the author replicates three components of punctuated equilibrium and agenda-setting theory (leptokurtic budget distributions, agenda-opinion correspondence, and media effects) that provide a benchmark for future comparative analysis as additional states join the project. This work argues that these efforts are beneficial not only for understanding agenda dynamics within the states, but also broader issues of representation, responsiveness, and their relationship with institutional design.
Of concern to scholars and the public alike is the extent to which government is attentive to the public’s concerns (Jones and Baumgartner, 2004). This means understanding how issues cross over from the public agenda to the governmental agenda (Dearing and Rogers, 1997) as well as how the media and elites shape the public’s perceptions of salient problems (Edwards and Wood, 1999; McCombs and Shaw, 1972). One way to study these important issues is to examine how the government allocates attention within a crowded agenda space (Jones and Baumgartner, 2005) and how institutional differences between governments affect their allocation of attention (Baumgartner and Jones, 2009). Much of the comparative work examining these relationships is cross-national; however, the states provide a ripe testing ground for understanding variation in agenda-setting dynamics.
Richer analyses of state agendas have proved difficult due to the immense data collection required to replicate portions of the Policy Agendas Project. Presently, such data has only been collected in Pennsylvania (McLaughlin et al., 2010) and remains unexplored regarding its potential for testing punctuated equilibrium theory (PET) in an intuitional context other than Congress. Efforts are underway to collect this data in other states (Haughney, 2014), so it is important to establish a baseline for empirical comparison when using this data to test PET and generate hypotheses regarding how agenda dynamics differ due to institutional variation in the states. To that end, this paper replicates three tests of attention allocation using the Pennsylvania data: (1) whether budget changes exhibit a leptokurtic pattern; (2) correspondence between the public and governmental agendas; and (3) state and national media effects on governmental attention over time (Jones and Baumgartner, 2005).
This article begins with a brief discussion of the literature on PET and attention allocation. This will frame the discussion of agenda setting in Pennsylvania and hypotheses derived about how agenda setting may compare to the federal government. After testing these hypotheses, the paper concludes with a discussion of how future comparative research can build on these findings. This article serves as a point of comparison, both methodologically and substantively, for future efforts in understanding how agenda dynamics vary across the states.
Agenda setting and punctuated equilibrium
PET, adapted from evolutionary biology (Gould, 2002), represents a synthesis of disparate observations in political science regarding governmental decision making. PET captures both long periods of relative policy and budget stability and occasional punctuations that occur as the status quo becomes misaligned with public and/or government preferences (Jones and Baumgartner 2005). 1 The observable implications of PET are found not only for the US federal agenda, but also within western democracies (Green-Pedersen and Walgrave, 2015; Jones et al., 2009), the European Union (Alexandrova et al., 2012), US state budgeting (Breunig and Koski, 2006), and policy diffusion (Boushey, 2012).
Pennsylvania stands as a useful test of PET and agenda setting due to its high, but not perfect, institutional correspondence with Congress. The Commonwealth has a highly professional full-time legislature, strong gubernatorial budget power, and a large bureaucracy. This is useful because fundamental results, like the leptokurtic distribution of budget changes, correspondence between the public and government agenda, and variation in the relationship between media coverage and the government’s agenda, should largely hold, but with the potential for important differences.
Leptokurtic budgets
Given the challenges of data collection, the research on agenda setting is not as vast at the sub-national level. Indeed, collecting the universe (or even a true random sample) of bill introductions, media coverage, public opinion data, and the like for all states is a steep task. Thus, the application of PET to states and localities mostly occurs through testing the distribution of year-to-year changes in individual budget categories. A leptokurtic distribution has a tall peak, fatter tails, and less mass in the shoulders than a normal distribution (Pearson, 1905). 2 The presence of a positively skewed leptokurtic distribution for annual changes in budget categories is viewed as evidence of slow budget growth typified by long periods of stability (i.e. the tall peak near zero) that are occasionally punctuated by large changes (i.e. the fatter tails). If annual budget category changes are normally distributed, or even platykurtic (i.e. closer to a uniform distribution), then there is less relative stability in budget changes, a deviation from the expectations of PET.
Variation in the degree of positive kurtosis across state budgets is associated with institutional differences, such as state budgetary rules, governor strength, and divided government. Notably, states with greater gubernatorial power, relative to the legislature, experience greater punctuations (Breunig and Koski, 2009). Additionally, there is a greater likelihood of punctuation in state and local budgets for non-allocational functions (e.g. natural resources, parks, highways) than allocational functions (e.g. education, public welfare, public health) that are often mandatory spending categories (Breunig and Koski, 2012; Jordan, 2003). In the case of allocational spending, legislators start with a baseline and make incremental changes to mandatory programs before turning to non-allocational functions that can be boosted or gutted more easily as revenue fluctuates (Breunig and Koski, 2012).
Considering that Pennsylvania uses a modified form of performance-based budgeting, has a large bureaucracy, a governor that proposes a budget, and a professionalized legislature that appropriates money, the distribution of annual changes in budget categories should be leptokurtic and positively skewed, much like the federal government. Additionally, the degree of kurtosis should vary across specific budget functions, with non-allocational functions experiencing greater punctuations than allocational.
Budget hypothesis: The frequency distribution of changes in spending in Pennsylvania is leptokurtic and positively skewed.
Opinion–agenda correspondence
Beyond budget kurtosis, the correspondence between the legislative agenda and citizen policy priorities is an important component of representation. Before representation can happen through the legislative process, issues that citizens care about must make it onto the agenda (Jones and Baumgartner, 2005). Assessing overall agenda correspondence, however, requires detailed data on citizen priorities and the legislative agenda. Most often, researchers examining the congruence between opinion and adopted policies either assess a broad opinion–policy linkage based on ideology (Erikson et al., 1993; Monogan et al., 2009) or very specific issues, such as gay rights (Lax and Phillips, 2009a) and abortion (Norrander and Wilcox, 1999). Congruence is distinct from correspondence, in that it has a time element that correspondence lacks. Jones and Baumgartner (2005) were unable to show whether or not Congress took up issues exactly when the public was interested in them, but they did find correlations of varying degrees between citizen and Congressional attention on most issues. Instead, correspondence provides an overall picture of whether a legislature’s issue allocation correlates with the public perception of current policy problems, not just legislation that is passed.
Citizen attention to some issues also correlates with stronger or weaker Congressional attention on other issues. For example, high citizen attention to defense issues negatively correlates with Congressional attention to a host of other non-defense topics. This reinforces the notion that agenda space is limited and some issues have an ability to dominate. Agenda space is equally, if not more, constrained in a state like Pennsylvania. The Commonwealth may have a professional legislature with full-time staff and salaries, but those resources are still fewer per member than in Congress. Thus, correspondence may be weaker in Pennsylvania than in Congress. In terms of off-diagonal correlations, defense issues will not dominate in the states like they do in Congress, thus opening the door for jostling between other state priorities.
Opinion–agenda correspondence hypothesis: Increased citizen-issue attention is associated with more attention in the governmental agenda.
State and national media effects
Finally, the media and political elites influence the public agenda by raising the salience of certain issues (Edwards and Wood, 1999; McCombs and Shaw, 1972). Issues must cross over from the public’s agenda to the government’s agenda for active consideration (Dearing and Rogers, 1997) and agenda correspondence provides one measure of the degree of cross-over. States, of course, are subject not only to media effects from national outlets, but also from their own within-state media coverage (Kiss, 2013; Tan and Weaver, 2009) and cross-state media markets (Pacheco, 2012; Zukin and Snyder, 1984). In fact, localized coverage can have a stronger agenda-setting impact than national coverage when issues have a local component (Hester and Gibson, 2007). Furthermore, state legislative staff can view local newspaper coverage as a barometer of public opinion (Herbst, 2002). Examining both state and national media effects will provide a richer understanding of agenda setting at the state level.
In terms of Pennsylvania, policy domains that are often under the federal government’s purview (economy, civil rights, environment, and commerce) should display stronger national agenda-setting effects, whereas issues that are most often handled by the states (health, labor, education, crime, welfare, transportation, housing, and state governance) are more likely to have a stronger connection with local media coverage.
Media effects hypothesis: State issue attention relates more strongly with national media coverage for issues where the federal government has strong involvement (economy, civil rights, environment, and commerce) and more strongly with state media coverage for issues that are more often considered under the purview of the states (health, labor, education, crime, welfare, transportation, housing, and administration).
Data and methods
Much like the Policy Agendas Project and the Comparative Agendas Project, the Pennsylvania Policy Database Project includes data on acts of the legislature, Governor, state Supreme Court, media, and public opinion. The data are coded using 22 major topic codes and nearly 250 subtopic codes that are similar to those used for the related projects, with adjustments made for state policy responsibilities.
The distribution of annual budget changes is drawn from the “TotalSpending” file, which includes data from 1979 to 2007. Annual spending (inflation adjusted with a baseline in year 2000) was divided across 16 of the 20 major topic codes 3 and nearly 100 sub-function codes that correspond with specific government services. The annual percent difference was calculated for each major topic code in each year. 4 Keeping with past research, I use L-kurtosis to describe the degree of punctuated equilibrium in Pennsylvania’s overall budget and specific budget functions. L-kurtosis ranges from zero to one. Values above 0.123 (a normal distribution) represent increasingly leptokurtic distributions, meaning they have greater periods of stability that are punctuated by few, but large, changes.
A correlation matrix is used to test the correspondence between public priorities and government attention. Government attention is measured using the annual percentage of total House hearings 5 (“HouseHearings” dataset) on a given topic and public priorities are measured using the “MostImportantProblem” dataset. This analysis only includes the time period when the two datasets overlap (1994–2008). An annual average rating for each topic is used for years with multiple Most Important Problem polls.
Finally, the relationship between national and state media attention and governmental attention is examined using time series plots of annual New York Times coverage, Pennsylvania news coverage, and Pennsylvania House hearings for each issue. The New York Times Index (NYTI) comes from the national Policy Agendas Project. Pennsylvania news coverage and House hearings are drawn from the Pennsylvania Database (“AllTopicsNewspaperClips” and “HouseHearings” datasets, respectively). Stories from national media outlets, like the New York Times, Washington Post, MSNBC, among others, were removed from the Pennsylvania clips file so that only local stories remain. If a media source was not clearly recognized as either in-state or out-of-state, a search was performed on the Internet to determine its audience. Data for 13 issue areas are included in both data sets for 1994–2005. This is a shorter time frame than the correspondence analysis because the NYTI was only current through 2005.
Results
Budget changes
Figure 1 demonstrates that the frequency distribution of year-to-year budget changes is leptokurtic and positively skewed. The L-kurtosis (0.42) is larger than 0.123 and the median change is 5.37 percent. Thus, much like the federal government, Pennsylvania’s budget generally grows incrementally, but punctuations occur when programs are eliminated, created, or their funding is greatly increased. This comports with leptokurtic distributions of spending changes found in other time periods for Pennsylvania (Breunig and Koski, 2006).

Frequency distribution of year-to-year changes in budget functions for Pennsylvania.
An advantage of this data is the ability to break this broad finding down into the component policy categories. Table 1 displays the L-kurtosis for each included policy topic, arranged from the largest to smallest. All of the distributions are leptokurtic, but, while their degree of peakedness varies somewhat, the range of differences (0.14) is narrower than those reported previously for all 50 states (Breunig and Koski, 2012).
L-kurtosis for each policy topic.

In terms of trends in allocational (e.g. education, welfare, public health) and non-allocational (e.g. natural resources, parks, labor, commerce) spending categories, there is a mixture of both at either end of the kurtosis spectrum. For instance, social welfare has the lowest L-kurtosis, but education is among the top four. Likewise, non-allocational functions like energy, finance, transportation, and public lands are both above and below the kurtosis of the overall distribution. Thus, these findings do not clearly support either Jordan (2003) or Breunig and Koski (2012).
Also, not all issue areas saw the same levels of spending growth over time. Law, Crime and Family had the highest median growth rate (7.55 percent) while housing saw the least (3.47 percent). This represents a two-percentage range around the median for all changes (5.37 percent). Some differences in overall spending growth and kurtosis are likely a result of fiscal federalism (Jordan, 2003). The policy areas with the highest stability—commerce, crime, and education—also receive funding from the federal government and have been the focus of substantial federal initiatives during the time period studied.
Policy correspondence
Figure 2 displays a correlation plot of relationships between the proportion of respondents rating a policy area as most important in a given year, and the proportion of total House hearings on that topic in a given year. The coloring of each quadrant demonstrates the direction, size, and statistical significance of the correlation. Only cells with red (negative correlation) or blue (positive correlation) color are statistically significant (p < 0.10). The on-diagonal correlations represent the direct correspondence between public priority and government attention, whereas the off-diagonals show how public attention to some issues can affect government attention to other policy domains due to a crowded agenda space. Whereas Jones and Baumgartner (2005) found correspondence, albeit varying in degree, between citizen priority and government issue attention in Congress, I find no such direct correspondence in Pennsylvania. It is possible that there is in fact no connection between citizen and governmental issue attention in Pennsylvania; however, this lack of a result is more likely due to the limited set of observations. The need for accurate and reliable opinion data on a broad array of topics is an important lesson for expanding these state projects.
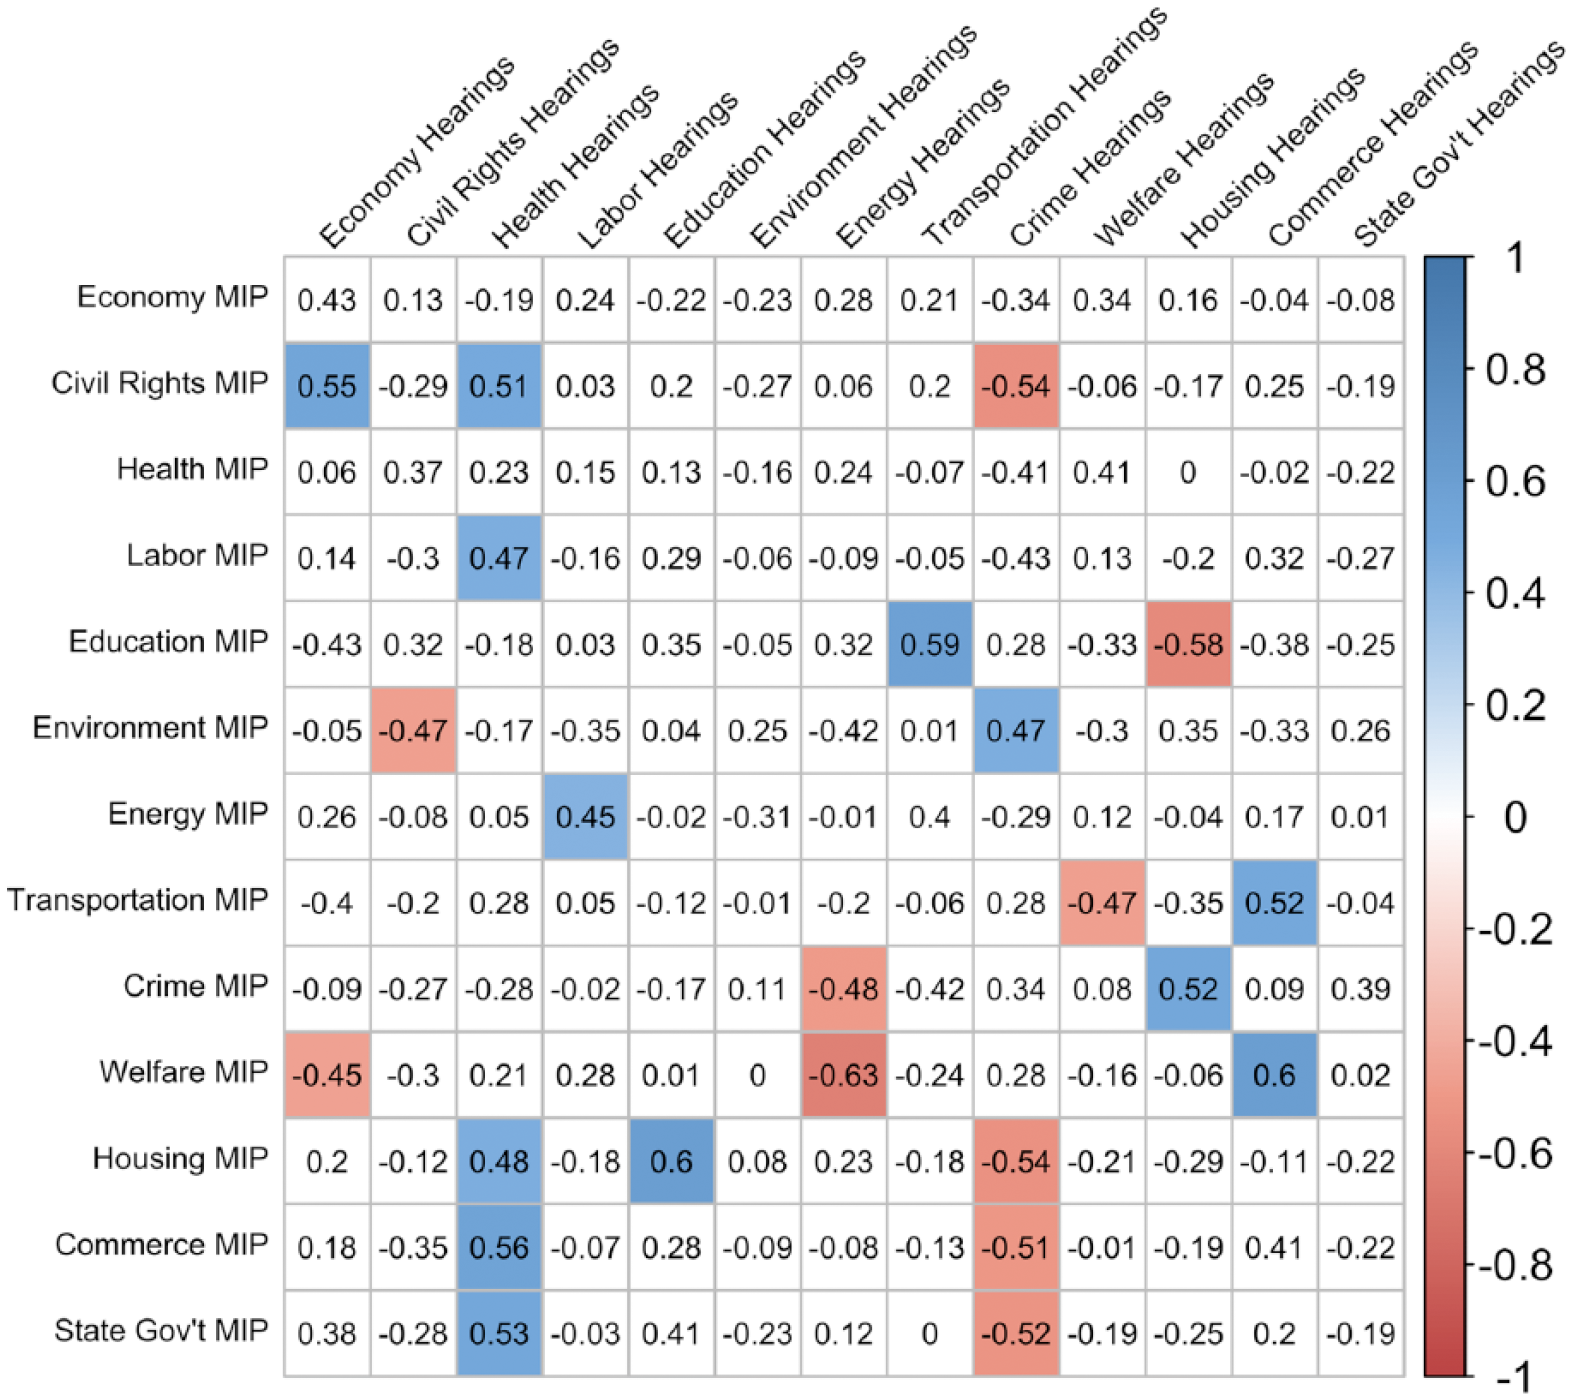
Matrix of correlations between Most Important Problem (MIP) rating and Pennsylvania House hearings.
I do, however, find interesting correlations between citizen priorities on some issues and government attention to related issues. For instance, in years when the public ranked civil rights as a more pressing problem, the House held a higher percentage of hearings on economic and health issues, but less on crime. This likely demonstrates where legislators focus when addressing civil rights concerns—economic discrimination and healthcare. Furthermore, members of the House also paid less attention to crime and issues of the law when the public was concerned about housing, commerce, and state government operations.
Some of these correlations are particularly telling given the national and local policy trends between 1994 and 2008. Nationally, there was a great deal of attention to crime, and states were implementing welfare reform. At the same time, Pennsylvania, among other states, was working through the deregulation of its electric industry (Mallinson, 2013). This likely helps explain why public attention to crime and welfare is negatively associated with House hearings on energy issues. These agenda items were in competition for the House’s limited agenda space, particularly as legislative attention to the expiration of electric rate caps and rising fossil fuel prices was high by 2008.
Media effects
Figure 3 displays time series plots of the percentage of Pennsylvania House hearings (black solid line), New York Times coverage (red dashed line), and Pennsylvania local news coverage (blue dashed line) for 13 policy topics. The first apparent trend is the disparity in media coverage and governmental attention. Civil rights and liberties; agriculture; labor, employment, and immigration; environment; transportation; social welfare; and community development and housing issues all received small proportions of the overall national and local news coverage, as well as the governmental agenda. Fiscal and economic issues also did not receive a high proportion of coverage. Both, however, do appear to rise and fall with the overall economy, with a trough during the dot com expansion and increasing media, then government, attention as the dot com bubble burst. This is one example of media attention, at both the national and state levels, preceding state attention.
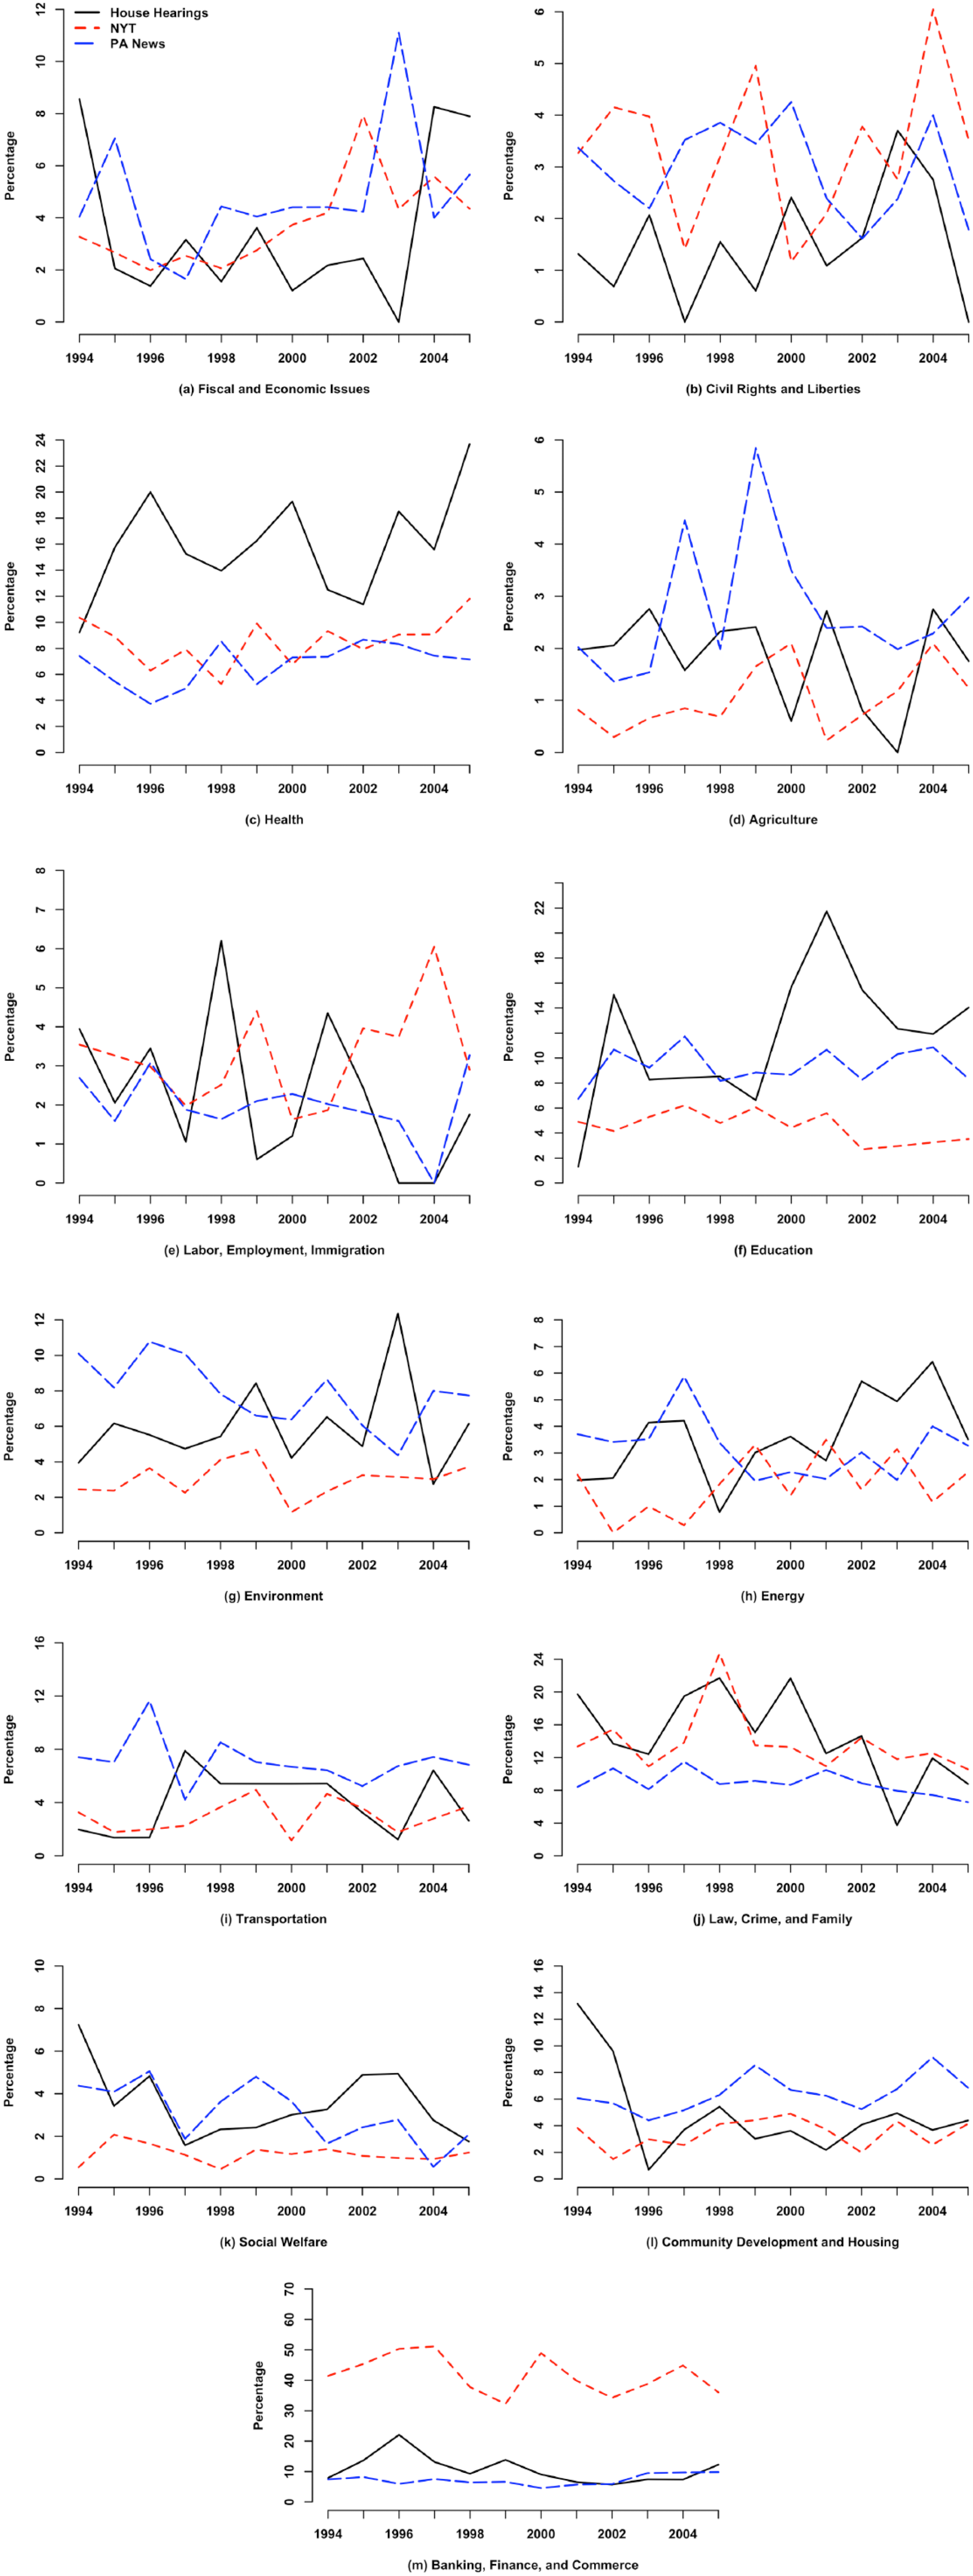
Time series plots of Pennsylvania House hearings, New York Times (NYT) coverage, and Pennsylvania (PA) news coverage for 13 policy domains.
In some cases, government and media attention are substantially different. For example, health issues sustained a more prominent place on the governmental agenda than in either state or national news. This has face validity, given the important role that states play in the provision of health services and implementation of Medicaid. Education, another substantial state responsibility, was a more prominent component of the governmental agenda in the period during and following the passage of the No Child Left Behind Act of 2001, and outpaced both state and local coverage. Civil rights and liberties issues, on the other hand, do not receive a large proportion of either media coverage or the governmental agenda, but the House provides consistently lower attention than the media. Issues of banking, finance, and commerce demonstrate the limitations of using the New York Times as the paper of record for national issue attention. Unsurprisingly, the Times expends a high proportion of ink on these issues, given New York City’s position as financial capital of the United States. This potentially distorts scholar’s view of the overall make-up of the public agenda—an important issue for the bevy of research that uses the Policy Agendas Project to study national issue attention.
Discussion and conclusion
Analyzing agenda setting in Pennsylvania yields promising prospects for future research. Not only is Pennsylvania’s budget indicative of PET, but there are varying degrees of punctuation in its specific budget functions. This provides a useful comparison point for replication in other states that have different institutional structures than Pennsylvania. Such comparisons will better explain why there is variation across these functions and the extent to which it is motivated by institutional constraints. But what can be learned from this analysis from both a substantive and methodological standpoint?
From a responsiveness perspective, the lack of correspondence between the public and governmental agendas is a troubling result. On one hand, perhaps legislators in Pennsylvania are not prompted by citizen concerns when setting the government’s agenda. The evidence of competition among agenda items in the off-diagonals, however, supports the notion of a limited agenda space. Thus, it is possible that this lack of a result is due more to data and measurement limitations than a true lack of correspondence. The on-diagonal correlations vary in magnitude, as would be expected, but none are statistically distinguishable from zero. Thus, the limitations of the dataset cannot be ignored and should serve as a warning for future state projects. Assessing correspondence properly requires finer opinion and hearing data than is currently available. Unfortunately, these opinion data may simply not exist in all states for substantial periods of time. Multi-level modeling (Lax and Phillips, 2009b) or pooling (Erikson et al., 1993) may be useful for establishing opinion at the state level across time, but it must be done for multiple policy domains, not a single policy or overall ideology.
The second challenge comes in the compilation and coding of state legislative hearings. This is a major undertaking that would require both funding and person power. The Pennsylvania project was made possible by the support of the General Assembly and the work of six universities. Considering the fiscal situation of many states and institutions of higher education, replication of this work across the states is likely to be slow. Additionally, this assumes that states have accurate and accessible records. Replication could induce bias in the comparisons if data is unavailable for states with less professionalized legislatures and cause researchers to only pay attention to a particular subset of resource-rich states.
Finally, the time series analysis showed that there is at least some correlation between in-state hearings and in-state and national news coverage for particular issues. There is evidence that some issues are potentially more susceptible to national coverage because of their national nature (i.e. the economy), while government attention to issues that are traditionally handled by the states (i.e. energy, housing, welfare, and transportation) track better with in-state news coverage. If hearing data can be collected, Lexis Nexus provides a powerful resource for collecting data on state and local coverage in a more systematic fashion than undertaken by the Pennsylvania project.
The most promising aspect of expanding this work to other states is the potential for not only understanding how attention is allocated, but why it may be allocated differently depending on state institutional design, the size and complexity of media markets, ideology of its citizens, and more. There are significant data and cost challenges in moving forward with comparative analysis of state agenda dynamics. If they can be overcome, the states would provide an important testing ground for not only agenda dynamics, but also how institutional design shapes political outcomes.
Footnotes
Declaration of conflicting interest
None declared.
Funding
This research received no specific grant from any funding agency in the public, commercial, or not-for-profit sectors.
Carnegie Corporation of New York Grant
The open access article processing charge (APC) for this article was waived due to a grant awarded to Research & Politics from Carnegie Corporation of New York under its ‘Bridging the Gap’ initiative.