
Abstract
In a simulation-based analysis of Qualitative Comparative Analysis (QCA), Krogslund et al. (2015) conclude that its performance is suboptimal in several settings. I review their simulation setups and discuss three errors that were made in their analysis. First, the simulations involving inclusion thresholds are overpowered based on a misunderstanding of their role in truth table analyses. Second, the fact that a truth table analysis could exhibit model ambiguity and yield more than one model is ignored. If multiple models are derived from a truth table and they are combined into one, one overestimates the complexity of the models and underestimates their number, making it impossible to retrieve the target model of the simulation. Third, the simulations on the consequences of including irrelevant conditions intermingle sensitivity to overfitting with sensitivity to varying the inclusion thresholds. A reconsideration of KCP’s simulations correcting for the errors confirms some of their findings, but also reveals that some of those errors lead to an underestimation of QCA’s robustness. On a broader level, the review underscores that simulations are useful for the evaluation of QCA, but that simulation designs need to match QCA’s mechanics and principles to produce valid conclusions about its performance.
Recent evaluations of the performance of Qualitative Comparative Analysis (QCA) invoke simulations and largely come to negative conclusions (Krogslund et al., 2015; Lucas and Szatrowski, 2014; Seawright, 2014). Simulations run on empirical studies and hypothetical data are valuable for understanding QCA’s ability to produce valid solutions (Rohlfing, 2015). However, when setting up simulation designs, one needs to pay close attention to the mechanics and principles of QCA to produce proper conclusions about its utility for causal analysis. I review a widely noted simulation analysis (e.g. Braumoeller, 2015) by Krogslund et al. (KCP henceforth, 2015). It examines the robustness of QCA to varying consistency thresholds, measurement error, and the inclusion of a random condition. My evaluation of their simulation setup highlights three gaps that undermine the validity of their simulations for making firm judgments about QCA. The review of the simulations is confined to issues that are not a matter of modeling decisions that can be made in one direction or another, but that should be reflected in all simulations, regardless of the type of QCA, algorithm, and design issue that are examined. A reconsideration of a selection of KCP’s simulations that are run for three empirical studies—Ahn and Lee (2012), Koenig-Archibugi (2004), and Samford (2010)—confirms some of their findings and, for others, shows that they underestimate the robustness of QCA results. 1 The review underscores that simulation designs are crucial to what we infer about QCA’s performance and that any simulation requires close familiarity with the QCA issue under scrutiny. 2
Overpowered simulations of inclusion thresholds
One set of simulations in KCP’s study focuses on the consequences of varying maximum and minimum inclusion thresholds across frequency thresholds that do not matter here. KCP aim to run comprehensive simulations by evaluating the effects of varying frequency thresholds and degrees of measurement error, each for 3000 randomly sampled pairs of inclusion scores (2015: 31). A comprehensive evaluation of QCA is laudable, in principle, but at least 2975 of the 3000 truth table analyses covering different pairs of thresholds do not yield relevant insights. 3
There are two reasons for this. First, regardless of the solution type, the choice of the maximum inclusion threshold is unrelated to the QCA result. Table 1 illustrates this point for Koenig-Archibugi (2004). The outcome in this study is ‘preferences for supranationalist government in the EU foreign and security policy sector’ (SUPRA). The conditions are ‘Europeanized identities of public’ (IDMASS), ‘High policy confirmity’ (CONF), ‘Strong regional governance’ (REGIO), and ‘High material capabilities’ (CAPAB). The column SUPRA (1.00) contains the outcome values when the minimum and maximum threshold values are 1, which are the values Koenig-Archibugi used. The column SUPRA (0.75) covers the outcome values when the minimum threshold is fixed at 1 and the maximum threshold at 0.75.
Koenig-Archibugi truth table for different inclusion thresholds.

Under the latter constellation, all rows with an inclusion score (or consistency score) of less than 1 and more than 0.74 receive a C on the outcome, which stands for ‘contradiction’. A comparison of the two outcome columns shows that the maximum threshold affects neither which row receives a ‘1’ nor what is taken as a remainder because this only depends on the availability of cases. All three solution types we can derive via the so-called standard analysis (see Ragin, 2008: 144) only draw on these rows. The irrelevance of the maximum threshold can also be inferred from KCP’s figures summarizing their simulation results because the QCA result does not vary across maximum thresholds when we hold fixed the minimum threshold.
The second reason why the inclusion threshold simulations are overpowered is the consideration of minimum inclusion scores of less than 0.75. It became a convention for analyses of sufficiency that the inclusion score should not drop below 0.75 (Schneider and Wagemann, 2012: 129). Breaking with the convention with no explanation, KCP’s simulations cover the full range of minimum inclusion scores. All conclusions about QCA’s non-robustness related to inclusion scores of less than 0.75 are irrelevant because they relate to empirical analyses no QCA researcher would have done in the first place based on the conclusion that the empirical association is not consistent enough with the claim that a set relation is present.
Taken together, simulations of inclusion thresholds should be confined to the range of 0.75 to 1 for the minimum inclusion score. Table 2 evaluates KCP’s simulations with respect to the number of different QCA results they derive within the range of 0.75 and 1. 4 The numbers in brackets represent the number of QCA results across the full range of minimum inclusion thresholds. Table 2 shows that the solution is not robust across all frequency thresholds for any of the three models. However, the degree of sensitivity in the relevant range of inclusion scores is always smaller than for the full range.
Number of solutions for minimum threshold between 0.75 and 1 (frequency thresholds in rows).

Ignoring model ambiguity
Depending on the truth table, it is possible that multiple QCA models capture the information in the truth table equally well (see Baumgartner and Thiem, 2015; Thiem, 2014). For example, Samford’s (2010) original study is characterized by model ambiguity because his truth table analysis yields three different models. Model ambiguity is not a problem of QCA per se, but can be considered one of empirical underdetermination because the available data do not allow us to single out one model.
In their simulations, KCP ignore model ambiguity and commit the fallacy of combining multiple models into one when it is given. One simulation result for Koenig-Archibugi is indicative because it is CONF*capab + CONF*REGIO + conf*regio*CAPAB + idmass*reg*conf + CONF*capab+CONF*REGIO + conf*regio*CAPAB + idmass*reg*capab (see also appendix). 5 Three prime implicants—CONF*capab, CONF*REGIO, conf*regio*CAPAB—occur twice in the model and are essential for covering at least one truth table row. The other two prime implicants—idmass*reg*conf, idmass*reg*capab—occur once and are inessential. We only need one of the two in combination with the essential prime implicants for a complete model, implying that KCP’s single model includes two models in fact: CONF*capab + CONF*REGIO + conf*regio*CAPAB + idmass*reg*conf and CONF*capab+CONF*REGIO + conf*regio*CAPAB + idmass*reg*capab.
The disregard of model ambiguity is fallacious in robustness tests for two reasons. First, one is likely to underestimate of the number of models and to overestimate their complexity that KCP point out as one feature of their simulations (2015: 35). Second, it is possible that one of the multiple models fitting a truth table is identical to the target model, defined as the model produced in the original empirical analysis. If this holds, ignoring model ambiguity makes it impossible to retrieve the target model. When a simulation takes ambiguity into account and one model is the correct one, it is also true that the simulation yields at least one incorrect model. However, there is an important qualitative difference between one wrong model and multiple models, one of which is correct. In this perspective, KCP are likely to underestimate QCA’s ability to derive the correct model (see also next section). Ex post, it is not possible to determine how often model ambiguity occurred in KCP’s simulations because the presented simulation results. However, the simulations I discuss in the following section are indicative of the presence of model ambiguity.
Inclusion of irrelevant conditions: mixing simulation goals
KCP want to determine whether a random condition added to the original analysis appears in the generated QCA model. They conclude that this is mostly the case because the random condition is included in 75.2% (Ahn/Lee), 99% (Samford), and 100% (Koenig-Archibugi) of 10,000 simulations for each study (Krogslund et al., 2015: 33). This leads them to argue that QCA is characterized by a confirmation bias (Krogslund et al., 2015: 27). The problem is that two potential sources of result sensitivity, consistency thresholds and overfitting, are combined in one analysis. It is true that 100 random conditions are generated for each of 100 pairs of inclusion scores, but the simulation results are aggregated across all pairs instead of being presented per pair. 6
More importantly, the primary goal of a simulation on overfitting in an empirical study should be to sample a sufficiently large number of random conditions keeping the original design parameters fixed. Only this setup allows us to determine the degree to which the empirical study, as it was done, is susceptible to confirmation bias. 7 Following this premise, for each study I run 1000 truth table analyses each adding a newly generated random condition to the analysis. The simulations underscore the importance of accounting for model ambiguity (see appendix). It is particularly pervasive for Samford (2010) because the number of models per truth table analysis ranges from 0 to 15.
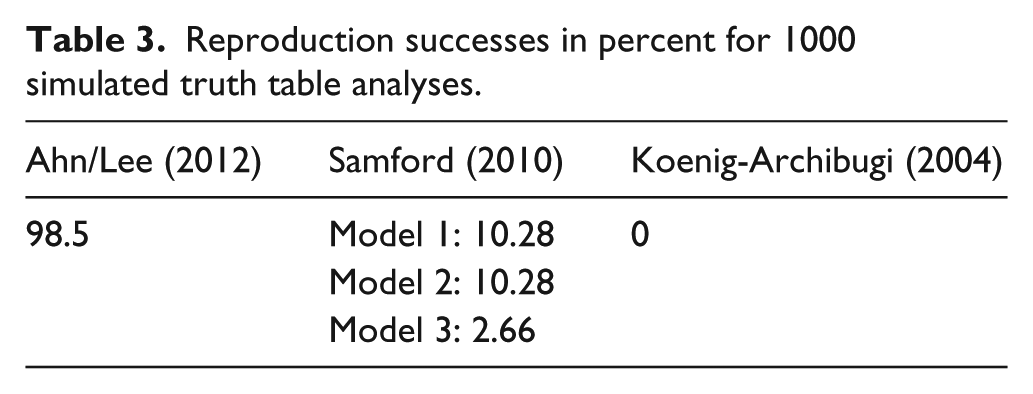
The reproduction successes of the simulations are summarized in Table 3. 8 The reproduction success is measured by the percentage of simulated models that are identical to the true model (see appendix). 9 The cell for Samford’s study contains three numbers because his original analysis yields three models. The reproduction successes range from 0% for Koenig-Archibugi to about 98% for Ahn/Lee. Although simulations on three empirical studies are not decisive, the results indicate that truth table analyses can reliably single out irrelevant conditions. A viable avenue for future research is to work out the conditions under which overfitting is a bigger and lesser challenge for the truth table analysis. In light of the results in Table 3, it seems fair to argue that QCA is less susceptible to confirmation bias than KCP argue.
Reproduction successes in percent for 1000 simulated truth table analyses.
Conclusion
Simulations emerged as a tool for the evaluation of the performance of QCA. This was a welcome development because simulations allow us to determine how well QCA performs, both in general and in specific applications (Rohlfing, 2015). However, the use of simulations for the evaluation of QCA requires great care to avoid erroneous conclusions. Based on a review of KCP’s (2015) study, I have shown that some simulations are not properly designed and that salient aspects of QCA are not adequately captured. This, in turn, puts the validity of their simulation results into question. A reanalysis supports some of their results, while other results indicate that QCA is more robust than KCP’s simulations suggest and that a confirmation bias is not necessarily in place. This insight highlights that simulation designs matter for what we infer about the performance of QCA and that being familiar with the mechanics and principles of QCA is crucial to producing valid simulation-based insights.
Footnotes
Acknowledgements
This paper benefited from discussions about simulations with Michael Baumgartner, Kim Sass Mikkelsen, and Alrik Thiem. I am grateful to Chris Krogslund for having been responsive to my emails. Charlotte Brommer-Wierig and Nancy Deyo provided valuable research assistance.