
Abstract
How do elections affect the costliness of financial crises to taxpayers? Previous research contends that more electorally competitive countries choose policies that are less costly to taxpayers. In this paper, we update Keefer’s seminal 2007 article published in International Organization with revised data. The original article found that more electorally competitive countries had lower fiscal costs from responding to crises. The commonly used IMF/World Bank data set Keefer employed has since been extensively corrected and expanded. We update the original analysis with the newest version of this data set. After doing so, we find no evidence for an association between electoral competitiveness and the fiscal costs of responding to financial crises both within the original sample and outside of it. Our update highlights a broader methodological lesson: that the costs of responding to financial crises can take many years to be settled. Future research should explicitly address and model this delayed cost resolution.
Introduction
The Global Financial Crisis of 2007–2009 highlighted the immense costs to the taxpayer of government responses to financial crises. Looking back at the last four decades, the median increase in public debt following financial crises from 1970 through 2011 in all countries is estimated to be about seven per cent of GDP. The range of public costs is very large, as some of these crises, such as Indonesia’s 1997 and Iceland’s 2008 crises, are estimated to be over 40 per cent of GDP (Laeven and Valencia, 2012: 17-19). What explains the variation in the fiscal costs of responding to financial crises?
Previous research has identified electoral competitiveness as a key driver of which policies governments pursue to address financial crises (Rosas, 2006, 2009a), with electorally competitive governments making choices that lead to lower fiscal costs (Keefer, 2007). These governments need to appeal to cost-conscious voters, rather than just banking interests who can provide them with rents, in order to stay in office. The view that non-electorally accountable, cronyistic relationships between banks and policymakers are a cause of crises and costly bailouts was widely held in the wake of the 1990s Asian financial crisis (Grossman and Woll, 2014: 578).
The Global Financial Crisis raises some questions about this approach. Though commonly referred to as “global”, the crisis primarily struck highly electorally competitive democracies in Europe and North America. Yet there is considerable variation across countries in the policy choices that these countries have made and the fiscal costs that have materialized so far from them (see Laeven and Valencia, 2012). Using Gelman and Basbøll’s (2014) terminology, recent events are both strongly anomalous in light of established theory and immutable–though the exact costs of these crises likely has not been settled, their wide range is well understood. As such, recent events should bring us to reconsider previous hypotheses. When viewed from a methodological perspective that emphasizes the importance of predictive accuracy to “at least in part verify claims about causal structure”, and which uses out-of-sample forecast accuracy as the “gold standard of model assessment” (Beck et al., 2000: 21-22), the recent divergence in crisis costs suggests that previous theories are less robust than initially thought. This motivates us to reconsider the veracity of approaches that see electoral competitiveness as a strong constraint on the fiscal costs of responding to crises.
In this paper, we re-evaluate the link between electoral competitiveness and bailout costs by examining the strength of the empirical foundations upon which this work is based. We update core findings published by Keefer (2007) in the journal International Organization. This work used data on the fiscal costs of financial crises from Honohan and Klingebiel (2003) which covered crises from 1975 through 2000. Their data is part of an irregular, but ongoing, compilation of information on financial crises that has largely been done by staff at the International Monetary Fund (IMF) and the World Bank over almost two decades (Caprio et al., 2005; Caprio and Klingebiel, 1996, 1997, 2002; Honohan and Klingebiel, 2000, 2003; Laeven and Valencia, 2008, 2010, 2012; Lindgren et al., 1996). Researchers studying financial crises and related policy issues have relied heavily upon the related data sets (a brief sample includes Alt et al., 2014; Bush et al., 2014; Gandrud, 2013; Ha and Kang, 2015; Jordana and Rosas, 2014; Keefer, 2007; Kleibl, 2013; Montinola, 2003; Pepinsky, 2012; Rosas, 2006, 2009a; Wibbels and Roberts, 2010). In fact, almost all recent cross-national research on some aspect of financial crises have relied on either the IMF/World Bank data set or another data set by Reinhart and Rogoff (2010), which is itself heavily based on prior versions of the IMF/World Bank data. 1
When we update Keefer’s original analysis with the most recently revised data, we do not find support for the initial electoral competitiveness findings either within or outside of the original sample.
Our paper is interesting for researchers studying the political economy of financial crises generally as it highlights measurement issues that plague key data sets, but are rarely addressed, let alone corrected for, in empirical work. As such researchers often use measurements from crises that are ongoing at the time of data collection, while the final costs can take many years to be settled. In this paper, we show that using data for ongoing crises introduces measurement error that requires some adjustment on the part of the researcher. Yet we know of no previous political economy research that addresses, let alone attempts to correct for this problem. Furthermore, measurement error may be systematically and theoretically interesting. Initial measurement errors may be related to political institutions, as politicians who face competitive elections have strong incentives to use policies that shift costs into the future. This could confound attempts to identify causal relationships between fiscal costs and political institutions, especially if not explicitly addressed.
Although the malleability of accounting fiscal costs of financial crisis make this a particularly important issue in this sub-discipline, paying closer attention to revisions in economic data is an issue with broader relevance and applicability in political science. Doing so can help critically reexamine previously established findings. For example, Kayser and Leininger (2015) examine economic data revisions and election forecasts. They find that voters are influenced more by reported, though inaccurate economic performance data rather than economic reality, which had been the prior widely accepted quantity in the literature.
In this paper, we first briefly re-evaluate the literature on the relationship between electoral competitiveness and the costs of responding to financial crises. We then describe revisions that have been made to the core fiscal costs data set and use this corrected data to update Keefer’s (2007) key analyses.
The study of the fiscal costs of financial crises
There are surprisingly few studies that explore why fiscal costs of crises vary across countries. In his study of responses to 46 banking crises over the period 1976–1998, which largely uses data from Honohan and Klingebiel (2000), Rosas (2006) argues that governments have two choices when dealing with a financial crisis. They can decide to bailout banks, in which case the costs to the taxpayer are high. They can also choose “Bagehot” policies that tend to minimize taxpayer costs. He classifies seven policy types from Honohan and Klingebiel (2000) according to whether they fit the “Bagehot” narrative, such as the provision of bank liquidity, recapitalization, and explicit guarantees. He argues that democracies are more likely to engage in “Bagehot” policies. The key mechanism in democracies is electoral competition. In later work, Rosas (2009a) builds on this approach by providing a case study contrasting the bailouts Mexican banks received under autocratic governments in the early 1990s with the higher losses shareholders bore in democratic Argentina and a more general statistical study of policies to address financial crises in Latin America. Looking specifically at fiscal costs with data from Honohan and Klingebiel (2003), Keefer (2007) argues that politicians facing strong removal pressures are not only less likely to choose bailout-type policies, but also likely to actually spend less when responding to financial crises.
This work has been widely cited in the literature on financial crises (for example, see Culpepper and Reinke, 2014; Gorton, 2012; Ha and Kang, 2015; Kang, 2014; Rosas, 2009a). The approach is part of a larger and growing literature on the general links between political institutions, particularly electoral competition and regime type, and politicians’ responsiveness to their constituents and the quality of government generally (see Kayser and Lindstädt, 2015: and the Supplementary Materials).
The literature on electoral competition and crises starts with the assumption that politicians are inclined to provide taxpayer funded bailouts to banks in order to earn rents from these banks. Electoral competition pushes back against this motivation. Politicians in electorally competitive systems have to limit bailouts in order to avoid being removed from office by cost-conscious taxpaying voters. A foundational assumption in this approach is that voters immediately observe bailout costs and can make informed decisions based on this information.
However, one can question this assumption. Many policy responses to financial crises are hard for citizens to observe and have costs that are very difficult to accurately predict. Responses such as guarantees, liquidity assistance, and supporting public asset management companies, create contingent liabilities that are only realized in the future if some event happens. It is only at a future time that the government needs to incur new debt or raise taxes if, for example, a bank is unable to pay its publicly guaranteed liabilities. Conversely, and perhaps less frequently, governments may discover that a bailed out bank is in better shape than anticipated, causing initial cost estimates to be lowered. This happened in Germany in 2011 when nationalized lender HRE’s bailout was found to have been overstated in an accounting error by 55 billion Euros (Reuters, 2011). For all of these reasons, initial estimates of how much policies used to respond to financial crises cost are often inaccurate (Woll, 2014: Ch. 1).
The problem for observational studies on the effects of political institutions is further complicated by the possibility that measurement errors in data collected in the short to medium term after the start of a crisis could be endogenous to these political institutions. Politicians could use contingent liabilities to incur costs beyond what previous models of financial crisis policymaking anticipate. Reinhart and Rogoff note that, in principle, cost-conscious citizens worried about increases in the public debt should notice the use of contingent liabilities, or what they term “hidden debt”. However, this often does not happen, because “the many different margins on which governments can cheat are a significant complicating factor” (Reinhart and Rogoff, 2011: 1697). If politicians can be easily removed from office by cost-conscious voters when they observe debt increases caused by expensive bailouts, then politicians have strong incentives to use contingent liabilities to assist banks. Doing so shifts debt increases into the future, thus helping to forestall incumbents’ removal from office. As such, short- to medium-term measurement errors in fiscal costs data may even be positively related to electoral competitiveness.
Reassessing previous empirical research
Given the strong possibility of measurement error in early fiscal cost measurements, how robust to updated data is Keefer’s claim that there is “robust evidence that countries exhibiting competitive elections make significantly fewer fiscal transfers to insolvent banks” (Keefer, 2007: 607)? In this section we first discuss updates made by Laeven and Valencia (2012) to the IMF/World Bank fiscal costs data. We then compare these updates to data Keefer used in his original research, both in terms of particular revisions and how the distributions of fiscal costs differ (or do not) between high and low electorally competitive countries. Finally, we use the new data to update Keefer’s key statistical model. The updated estimates suggest that electoral competitiveness has no impact on the ultimate fiscal costs of responding to financial crises either in or out of the original sample.
Updating measurements of fiscal costs from financial crises
Keefer based his dependent variable on the fiscal costs of responding to financial crisis as a percentage of gross domestic product recorded by Honohan and Klingebiel (2003). The Honohan and Kingebiel data set covered 40 crises from 1975 through 2000. While a few developed countries appear in the data set, such as Japan, some Nordic countries, and the United States, most are developing countries. This is because crises predominately occurred in developing countries during this time period. The data set is based on a frequently, though irregularly, updated data set maintained by staffers at the IMF and World Bank. The most recent version available is Laeven and Valencia (2012).
The Supplementary Material provides an overview of the data set’s entire chronology, which includes more information on the exact sample Keefer used. It also includes a discussion of the sampling criteria and crisis costs definitions used in the waves we examine. The sampling criteria and definitions are generally the same across the versions.
Figure 1 shows the difference in the fiscal costs measured by Honohan and Klingebiel (2003) and Laeven and Valencia (2012) where they both have same set of observations as in the original data set; that is, where they have information recorded in the same country–crisis start year. It is reasonable to assume that Laeven and Valencia’s (2012) data more accurately estimates these costs because their measurements were made later: there was more time for the fiscal costs of contingent liabilities to be revealed and other corrections to be made. If this is the case, then positive numbers in Figure 1 indicate that measurements of policy responses’ fiscal costs in Honohan and Klingebiel’s data are underestimated. Negative numbers in Figure 1 indicate overestimates.

Difference in fiscal costs of crisis responses as a percentage of GDP recorded by Laeven and Valencia (2012) and Honohan and Klingebiel (2003).
Although a little under half of the measurements shown in Figure 1 were not revised (13 of 28), almost all measurements of fiscal costs that were revised were revised upwards, indicating that they were originally underestimated. This is especially true of crises that were labeled by Honohan and Klingebiel as “ongoing”. The median revision for ongoing crises was 5.75 per cent of GDP, compared with 0 for completed crises. 2 Keefer’s analysis does not distinguish between crises classified as “ongoing” and those classified as “completed”. However, fiscal cost estimates from only two of the ongoing crises were not later revised upwards. Overall, revisions range between -10.2 and 11 per cent of GDP. Given the relatively small sample size and that the full range of fiscal costs in Laeven and Valencia’s (2012) data is 0–56.8 per cent of GDP, using the original measurements could easily bias estimates of the relationship between financial crisis outcomes and electoral competitiveness.
Figure 1 also shows that the vast majority of upward revisions occurred in countries Keefer classifies as having highly competitive elections. 3 Estimates of high electoral competitiveness’ downward effect on fiscal costs would likely be overestimated using Honohan and Klingebiel’s data.
Figure 2 provides a better sense of how the distributions of fiscal costs from financial crises differ between the original and updated samples for countries with high and low electoral competitiveness. In Honohan and Klingebiel’s (2003) original sample (top panel) countries with highly competitive elections generally have low fiscal costs. Countries without competitive elections have costs that are almost uniformly distributed between about 0 and slightly above 50 per cent of GDP. The middle panel shows the distribution of costs for crises included in Honohan and Klingebiel’s (2003) original sample that Laeven and Valencia updated in 2012. Note that there are fewer crises than when we used Keefer’s data, because a number of crisis start years are different in Laeven and Valencia (2012) and Keefer (2007) (see Table 1 in the Supplementary Material for details). Due to revisions, the center of the distribution for countries with highly competitive elections moves upward. There are also more crises in countries with highly competitive elections that have very high fiscal costs.

Comparing distributions of the fiscal costs of financial crises (before 2001) in Honohan and Klingebiel (2003) and Laeven and Valencia (2012).
The bottom panel shows the distribution of fiscal costs measured by Laeven and Valencia in their full pre-2001 data set. There is very little difference between the distribution of fiscal costs in countries with and without competitive elections. In addition to the upward revision of costs in competitive election countries, Laeven and Valencia include more countries with low electoral competition than Honohan and Klingebiel. These additional cases generally have relatively low costs.
Updated results
We now turn to updating Keefer’s 2007 empirical results with this revised data. We focus on his Model 2 in Table 4. He describes this as the research’s “main findings” (Keefer, 2007: 624). The purpose of many of the paper’s other models is to examine the robustness of these results. The estimates in our Table 1 come from an ordinary least squares regression run in Stata version 12.1. As in Keefer’s original specification, we include robust standard errors with country clusters. See the Supplementary Material for details about the independent variables. Also, see Table 2 in the Supplementary Material for the exact country–crises included in each model.
Normal linear regression: updating elections, political instability, and fiscal transfers during financial crises.
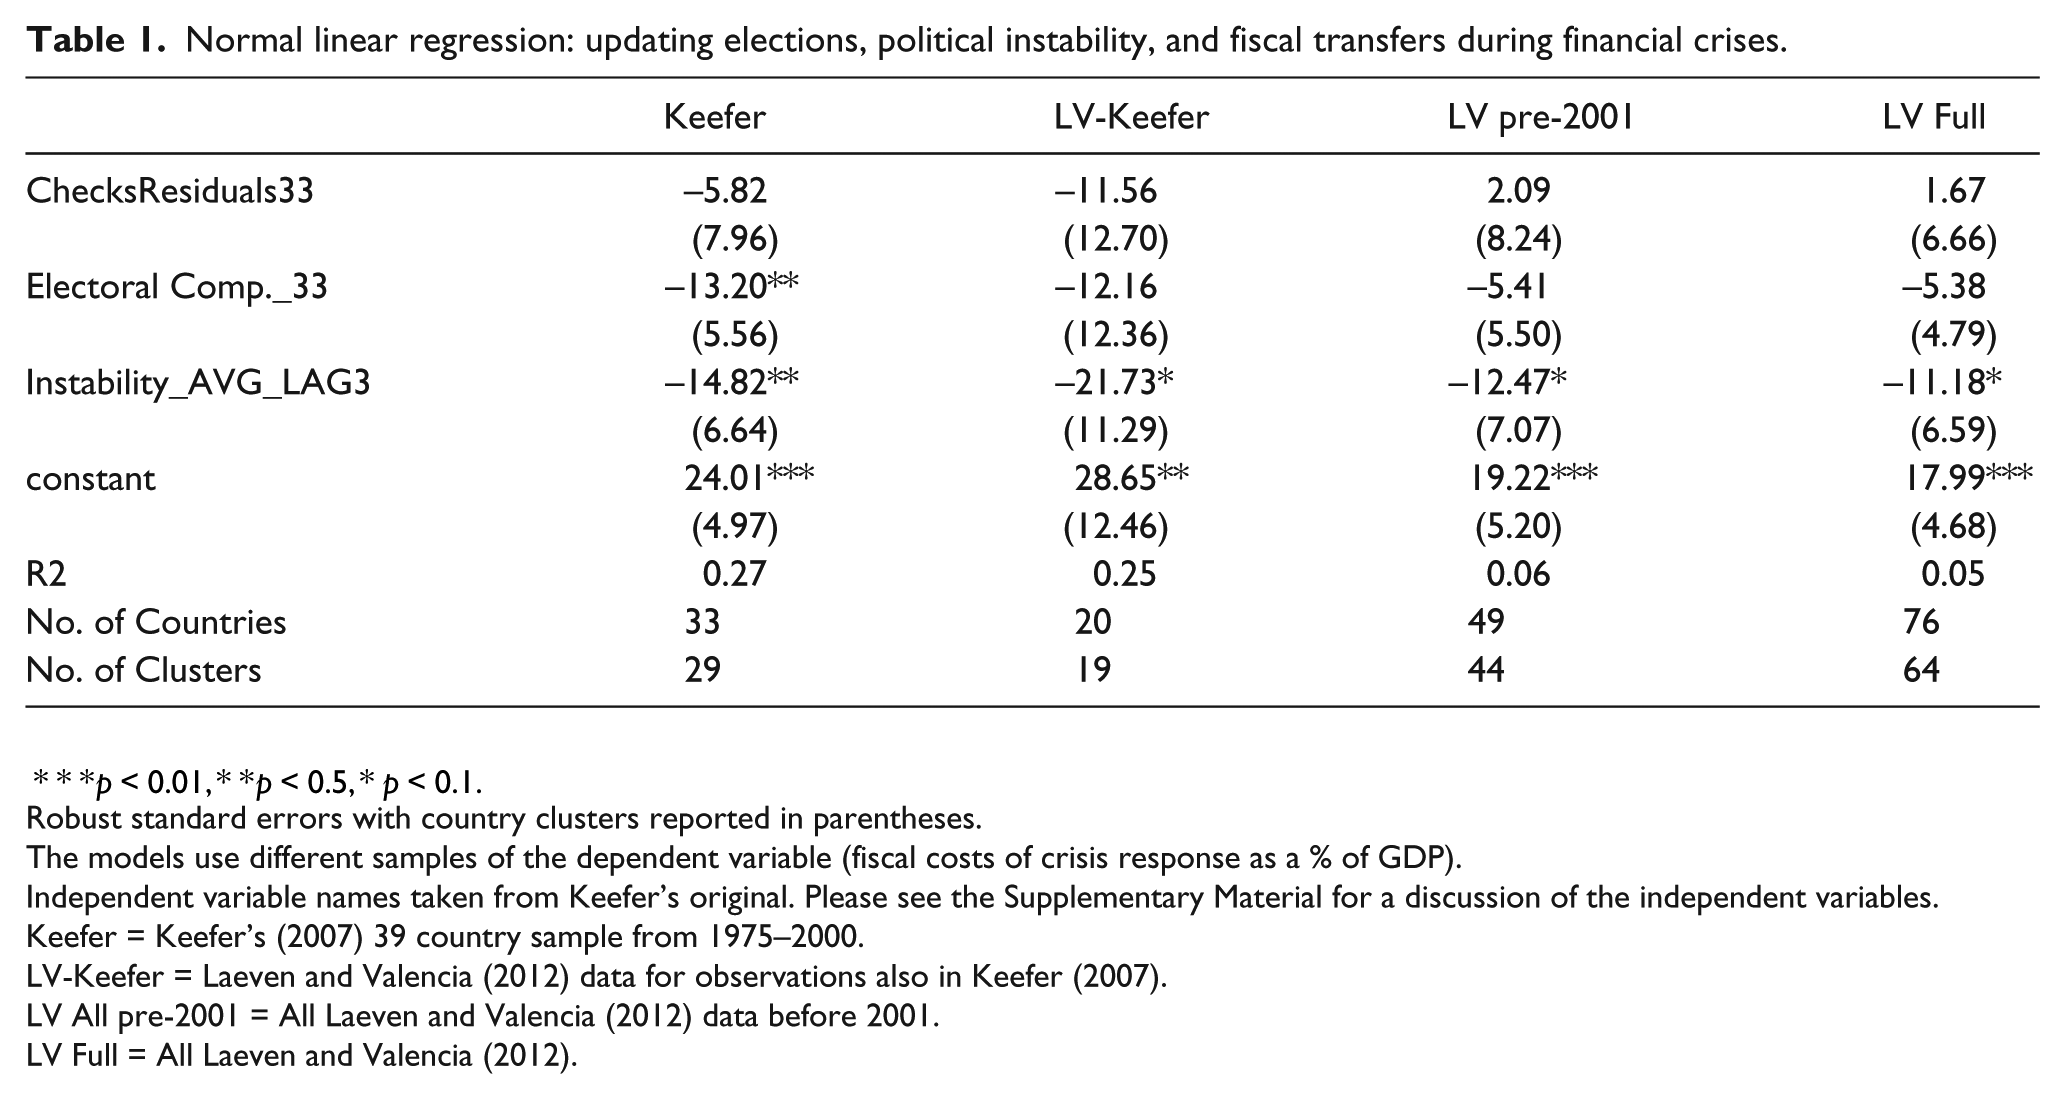
p < 0.01, **p < 0.5, p *< 0.1.
Robust standard errors with country clusters reported in parentheses.
The models use different samples of the dependent variable (fiscal costs of crisis response as a % of GDP).
Independent variable names taken from Keefer’s original. Please see the Supplementary Material for a discussion of the independent variables.
Keefer = Keefer’s (2007) 39 country sample from 1975–2000.
LV-Keefer = Laeven and Valencia (2012) data for observations also in Keefer (2007).
LV All pre-2001 = All Laeven and Valencia (2012) data before 2001.
LV Full = All Laeven and Valencia (2012).
In the first model of our Table 1 we reproduce the original findings using Keefer’s 39 country data set. Our coefficient point estimates are not exactly the same as the original’s, probably due to discrepancies in the independent variables discussed in the Supplementary Material. However, the estimates’ directions, statistical significance and general magnitudes are the same. The R2 is also very similar. As in Keefer’s original, this model estimates that electoral competitiveness (labeled as in the original as Electoral_Comp._33) has a strong negative affect on the fiscal costs of responding to financial crises.
The second through fourth models in Table 1 consider the possibility that the results change when we use Laeven and Valencia’s (2012) updated fiscal costs data. In the second model we create a dependent variable of fiscal costs in country–crisis start years from Laeven and Valencia (2012) that match those in Keefer’s data set. We can see that the standard error of the coefficient point estimate for electoral competitiveness increases substantially. This leads electoral competitiveness to become statistically insignificant. Such a result is evidence that Keefer’s key original finding was dependent on measurements taken soon after the crises in some countries, and before the costs of contingent liabilities had materialized and other corrections had been made. 4 In the third model, we examine if missing data in the original data set might also have contributed to Keefer’s results. We use all of the fiscal costs data from Laeven and Valencia for crises that began before 2001 as our dependent variable. The electoral competitiveness coefficient point estimate decreases considerably. It is also statistically insignificant. Overall, we find no in-sample evidence for a relationship between electoral competitiveness and fiscal costs of responding to financial crises when using updated data.
In the fourth model from Table 1 we ran the analysis using the full Laeven and Valencia sample up to 2012 to detect out-of-sample support for the relationship. The electoral competitiveness finding was again statistically insignificant in this model. However, it is important to take these results with a grain of salt. A number of the crises near the end of their sample were ongoing when Laeven and Valencia collected their data and may still turn out to be inaccurate. Nonetheless, because most of the recent crises were in electorally competitive countries, and because, as we have seen, cost measurements tend to increase over time, it is likely that analyses with future updated data will not find a negative association between electoral competitiveness and fiscal costs in this sample.
Finally, we conducted an additional robustness check to examine how the results change when using a more appropriate estimation modeling method. Figure 2 shows that the distribution of fiscal costs is effectively bounded by 0 and 100, or 0 and 1 when the variable is transformed from a percentage to a proportion. Related to this, the variable is highly right-skewed. Ordinary least squares is ill-suited for such a dependent variable. Beta regression is a better fit as it models the distribution of the dependent variable using the beta distribution, which is bounded between 0 and 1 (Cribari-Neto and Zeileis, 2010; Ferrari and Cribari-Neto, 2004). Table 2 shows results from a beta regression using Keefer’s original and Laeven and Valencia’s updated data converted to proportions. 5 We used Stata 12.1 and the betafit function by Buis et al. (2003). We can see that electoral competitiveness remains negative and statistically significant with Keefer’s costs data. However, as in the normal linear regressions, when we use Laeven and Valencia’s updated costs data, the electoral competitiveness finding loses statistical significance. The beta regression likely gives us more accurate point estimates, but again does not indicate any evidence for a relationship between electoral competitiveness and costs either in- or out-of-sample when using updated data.
Beta regression: updating elections, political instability, and fiscal transfers during financial crises.
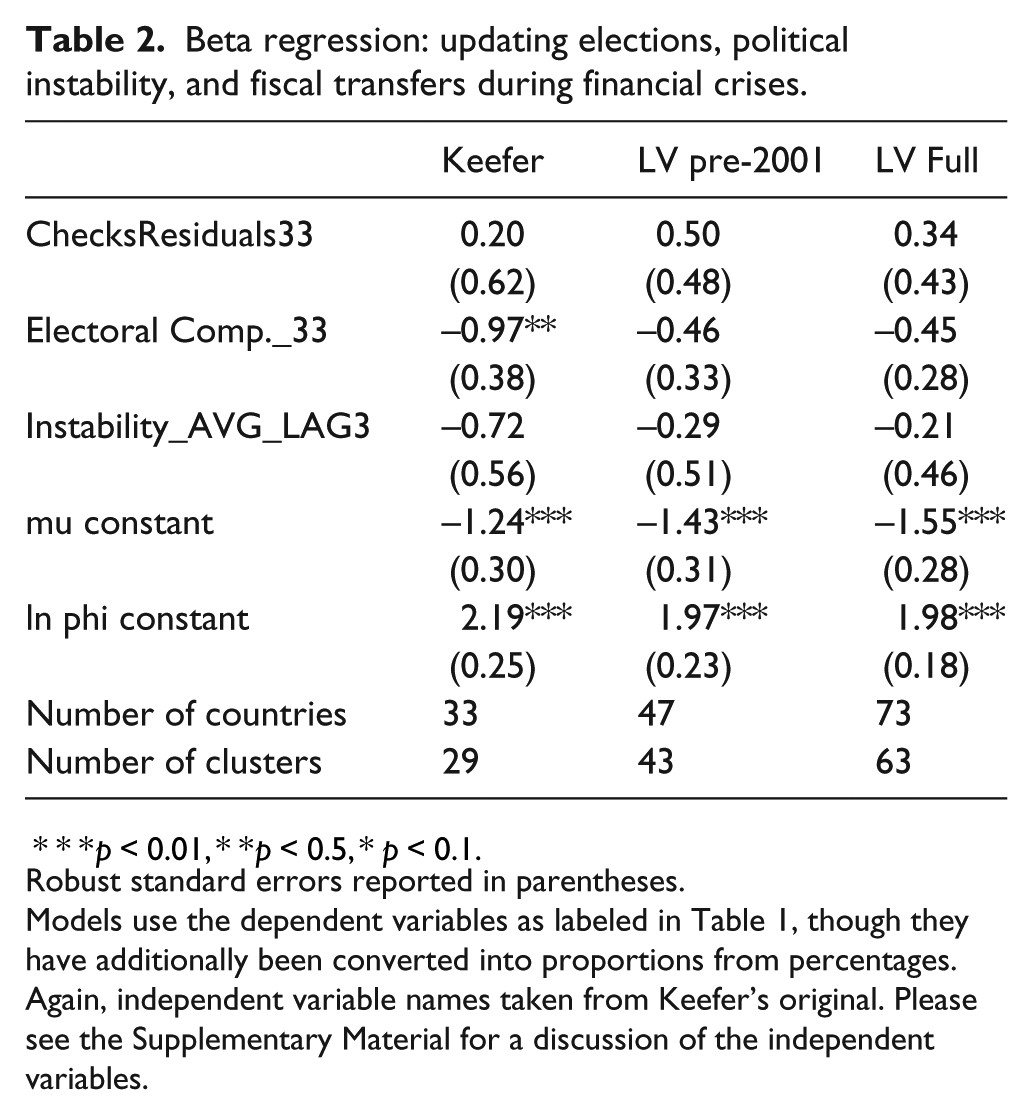
p < 0.01, **p < 0.5, p *< 0.1.
Robust standard errors reported in parentheses.
Models use the dependent variables as labeled in Table 1, though they have additionally been converted into proportions from percentages.
Again, independent variable names taken from Keefer’s original. Please see the Supplementary Material for a discussion of the independent variables.
Please also see the Supplementary Material for further robustness checks running the model with Honohan and Klingebiel’s (2003) sample and Laeven and Valencia’s (2012) sample excluding Eurozone and European Union countries (the bulk of the new countries in the Laeven and Valencia’s sample). It should be noted that the null relationship between electoral competitiveness and fiscal costs is observed in these sub-samples as well.
3 Conclusion
In this paper we updated a key finding in the political economy literature on the relationship between political institutions and the fiscal costs of financial crises. The costs of financial crises can take years to settle. Data from ongoing crises, which in this case appears in Honohan and Klingebiel (2003) and is used in Keefer (2007), is likely to have considerable measurement error. In our replication using updated data we found no evidence in support of Keefer’s original findings that electoral competitiveness constrains the fiscal costs of financial crises. This was true both in the original sample, and for other samples that included more recent crises. Our research here indicates that future work should address possible measurement error caused by delayed cost realization in data on the fiscal costs of financial crises.
Our paper has highlighted the need for better measures of financial crises and their costs. Though we have used perhaps the most comprehensive and updated data currently available, these measures are far from perfect. 6
When better measures of financial crises and costs are available, future work needs to empirically examine the possibility that electoral competitiveness may actually be associated with measurement errors and delayed cost realization. Incumbents facing reelection could have strong incentives to choose policies that create contingent liabilities and push costs into the future, after elections. We are unfortunately not able to do this research here. Available data largely has been updated for high electorally competitive countries. Only Indonesia had both an ongoing crisis in Honohan and Klingebiel (2003) and low electoral competitiveness.
Finally, we would like to stress that both the purpose and outcome or our work is to update important findings in the political economy of financial crises with the most recently revised data, rather than to criticize the original work. The original work used the most complete and accurate information available at the time. Given that the high likelihood that measurements of the fiscal costs of financial crises will need to be revised over time, updating results from work that tries to understand these costs is particularly important when new information becomes available.
Footnotes
Acknowledgements
We thank Lawrence Broz, Christophe Crombez, Philip Keefer, David Lake, Phillip Lipscy, Thomas Sattler, Christina Schneider, Jonathan Rodden, Ken Scheve, Weiyi Shi, Erik Wibbels, and seminar participants at Stanford University, the University of California, San Diego, and the European Political Science Association’s 2014 Annual Conference. All plots, tables, and other analyses discussed in this paper can be replicated using source files available at: ![]() .
.
Conflict of interest statement
The authors have no conflicts of interest to declare.
Funding
This project was made possible with generous financial support from the Deutsche Forschungsgemeinschaft (Building Bad Banks, HA 5996/2-1).