
Abstract
Enormous growth of the world population during the last two centuries and its present slowing down pose questions about precedents in history and broader forces shaping the population size. Population estimates collected in an extensive survey of literature (873 estimates from 25 studies covering 1,000,000 BCE to 2100 CE) show that world population growth has proceeded in two distinct phases of acceleration followed by stoppage—from at least 25,000 BCE to 100 BCE, and from 400 CE to the present, interrupted by centuries of standstill and 10% decrease. Both phases can be fitted with a mathematical function that projects to a peak at 11.2 ± 1.5 billion around 2100 CE. An interaction model can account for this acceleration-stoppage pattern in quantitative detail: Technology grows exponentially, with rate boosted by population. Population grows exponentially, capped by Earth’s carrying capacity. Technology raises this cap, but only until it approaches Earth’s ultimate carrying capacity.
Keywords
Introduction
During the 20th century, the global population has gone through an unprecedented population growth rate (Lee, 2003). Considering that the population increase has been slowing down during the last decades (Bongaarts, 2016; Cohen, 1998: 28; Gerland et al., 2014; Lutz et al., 1997, 2001; Pearson, 2015), increasing consensus among scientists is that the world population is about to reach a peak at which the number of people living on the planet will stabilize (Dorling, 2013; United Nations, Department of Economic and Social Affairs, 2019; U.S. Census Bureau, 2019).
However, scholars do not yet agree about the population size at the peak and what will follow (Adam, 2021). Current research has applied a multitude of methods which all account that the planet provides limited natural resources—such as fertile soil, drinkable water, and breathable air. This finite supply imposes a maximum size of the human population which can—theoretically or practically—survive. This core assumption led to various modeling approaches using spatial, and longitudinal data, or hypothetical scenarios to propose a limit to the world population (see review by Van Den Bergh and Rietveld, 2004).
Our study, which incorporates future world population projections, supplements the forecasts generated through traditional demographic methods. While conventional demography focuses primarily on the past century, it is centered on the concept of demographic transition in technologically advanced societies, where high birth and death rates shift to lower levels. Our research employs the method of temporal extrapolation to extend the study of world population growth to an unprecedentedly long period—from 1,000,000 BCE until 2100 CE—expanding the timeline far beyond the previous studies (e.g. Cohen, 1995b; Livi-Bacci, 2017; Pearson, 2015; for methastudies see Cohen, 1995a, and Van Den Bergh and Rietveld, 2004). Based on our own survey of literature collecting 873 population size estimates in 25 studies, we examine the recent trends in the population growth and develop a parsimonious model fitting the world population since 400 CE better than any single-inflection-point fit previously proposed. Remarkably, when we extend the study to the millennia preceding 400 CE, that is, from 1,000,000 BCE on, and include the estimates for the hominin ancestors of Homo Sapiens, the same mathematical format still fits the world population estimates, just with different constant values.
Hence, our main contribution is unambiguous evidence that the world population growth has proceeded in two distinct phases: “ancient” from at least 25,000 BCE to 100 BCE, and “present” from 400 CE to the present with a temporary intervening halt for 500 years in-between. This adds an important insight into our understanding of the population growth which has been perceived as a continuous growth due to the focus on the recent historical patterns (mostly only a few last centuries). 1
Even though the population is still growing at a fast pace, this pace is slowing down (Gerland et al., 2014; Lutz et al., 1997, 2001). Our model extrapolates to an ultimate limit at 11.2 ± 1.5 billion almost reached by the end of the 21st century. Hence, as a population, we are just ahead of a stalling point, which, however, may not be as unusual as it sounds. The current slowdown parallels the one appearing some two millennia ago. Therefore, the period from 100 BCE to 400 CE, when the population growth stalled, can provide relevant lessons for the decades to come.
To account for the observed patterns, we develop a parsimonious model of world population growth which interacts three main factors—(1) size of population, because the number of people largely determines how quickly they can reproduce; (2) Earth’s carrying capacity for our species, since it limits the availability of resources needed to survive; and (3) broadly defined impact of technology, including a wide variety of inventions from communication means to healthcare which all contribute to the boost in Earth’s carrying capacity. In sum, population tries to grow exponentially (Law et al., 2003; Vandermeer, 2010), but this capacity increase may face an ultimate limit that blocks further population growth (Cohen, 1995a; Van Den Bergh and Rietveld, 2004). Technology, itself boosted by population (Liang, 2018), raises this lid (Kremer, 1993; Taagepera, 1976), but only until population approaches the ultimate carrying capacity of Earth. Building on previous models interacting population growth with technology (Kremer, 1993; Taagepera, 1976) or Earth’s carrying capacity (Cohen, 1995a; House and Williams, 1976) and finally both (Taagepera, 2014), we are the first to present a fully solved three-factor model including mutually consistent explicit equations for all three factors with numerical values of constants spelled out.
To the extent our study includes world population projections for the future, it complements the projections made by conventional methods of demography. Demography mostly deals with the last 100 years, and a main guiding idea is demographic transition from high birth rates and high death rates to low birth rates and low death rates in societies with advanced technology. Age structure of the population changes during this transition which allows demographers to apply the cohort component method and project the further changes in those numbers, given observed mortality trends. Combined with observed trends in fertility, total population for future decades can be estimated for countries and for the world, with fair confidence. However, information on numbers by age cohorts is available only from 1950 on (see United Nations, Department of Economic and Social Affairs, 2019), which imposes serious challenges for a study of such a long period as is covered in this research. Yet, our temporal extrapolation based on past global population data yields trends largely consistent with the demographic studies and extrapolates to a similar ultimate limit reached by 2100 (see, e.g. Cohen, 1995a; Dorling, 2013; Gerland et al., 2014; United Nations, Department of Economic and Social Affairs, 2019; U.S. Census Bureau, 2019). At this point comparisons with the projections resulting from current demographic models enter, for mutual benefit. To the extent that the results from both approaches agree, both gain in credibility.
World population growth: Past projections
In 1960, the growth of human population reached such speed that 39 Nobel laureates joined in warning that “there is in prospect a Dark Age of human misery, famine, under-education and unrest which could generate growing panic, exploding into wars fought to appropriate the dwindling means of survival” (cf. Connelly, 2006: 313). These alarming voices responded to the tremendous acceleration of the population growth: a quarter million years ago the entire human population was less than half a million. At that time, it took about 200,000 years for the world population to double. The number of people passed one billion around 1830. The second billion people were added in only one century, by 1930. The next doubling, to four billion in 1975, took only 45 years (Steffen et al., 2015). Yet the next doubling, to eight billion in 2022 (Adam, 2022), took a bit longer, 47 years, and no further doubling is looming.
When the shrinking doubling times were fitted with a hyperbolic format to estimate the future population growth, they projected to an infinite population as early as in the 1970s (Ehrlich, 1968) or a mere half century later (von Foerster et al., 1960). That led to concerns. Way before reaching “Doomsday”—the day when population projections reached infinity—Earth’s capacity was not expected to provide sufficient resources for everybody. Resulting fights, in any imaginable way, threw serious doubts over the survival of humankind. However, the global population growth rate reached its all-time peak already around 1965–70 and began to slow down gradually and somewhat erratically (Cohen, 1998: 28). Hence, nowadays—when the speed of population growth is beyond its peak (Bongaarts, 2016)—we can safely conclude that the dismal projections were just artifacts of the chosen methodology. Nevertheless, this research is helping us to understand the constraints of population growth (see Ehrlich and Ehrlich, 2009; Nørgård et al., 2010).
Earth’s carrying capacity as a constraint
Already Malthus (1798) suggested that population grows exponentially (“geometrically”) while logistic support (food) grows linearly (“arithmetically”). This implied that “the power of population is indefinitely greater than the power in the Earth to produce subsistence for man” (Malthus, 1798) and, therefore it is just a matter of time when the human population surpasses the size when it is possible to feed everyone. The limited resources of our planet led to identify the first constraint on population growth—Earth’s carrying capacity. The realization that people are inhabitants on a planet of limited resources led to the first estimates of the maximum survivable population size (see review by Cohen, 1995a).
However, the early understanding of Earth’s maximum carrying capacity was not that it puts a cap on the population growth (see, e.g. Ehrlich, 1968; Meadows et al., 1972; von Foerster et al., 1960). Instead, it was perceived as a threshold the surpassing of which completely changes the patterns of cohabitation among people and disintegrates the world order—as was briefly outlined in the previous section.
This understanding was sidelined after observing that the human population growth has been slowing down (see also Ehrlich and Ehrlich, 2009; Gerland et al., 2014; Lutz et al., 1997, 2001; Pearson, 2015). Hence, it became more plausible that scarcity of basic raw materials—such as square meters of space per person, drinkable water and breathable air—impose a limit on the population growth which will be reached and maintained (Cleland, 2013; National Research Council, 2000). These limits stand despite impressive improvements in land use by humans (Liang, 2018; Meyer and Turner, 1992).
It may sound counter-intuitive, but human population seems to adjust its growth based on the availability of resources on Earth without being directly aware of Earth’s carrying capacity (Edwards, 2017). Humans still coordinate their behavior accordingly. However, this is hardly surprising if we consider patterns commonly observed in nature among other organisms: For example, when bacteria are placed in contained surroundings, their reproduction follows a simple logistic pattern—growth is slow in the beginning, then quickly accelerates, to slow down before reaching the ceiling imposed by the available resources in the environment (Vandermeer, 2010). It may sound somewhat demeaning, but much like single-celled bacteria, human population growth follows a close-to-logistic pattern despite lack of careful mapping of the Earth’s resources and resulting coordination of people. A major difference is that technological advances have kept raising the ceiling on this growth (Boserup, 1981, 2005).
Technology: A force speeding up the growth
When food and space are plentiful, animals multiply along an “exponential” pattern (see Keiding, 1975). Exponential growth is the default format for growth: Over a certain time span a female will raise two female offspring; each of those will also raise two, over a similar time span, and so forth. Exponential growth means that growth in population is proportional to the existing population: Ten time more mothers means 10 time more daughters.
However, human population has increased tremendously over 5000 years, from 12 million to 8 billion (Adam, 2022). When estimated population sizes are placed on a timeline—as we will do soon—the resulting pattern implies an accelerating steeper-than-exponential growth which quickly overperforms basic multiplication.
This came about due to technological achievements increasing effectiveness of human cooperation (Boserup, 1981). The term technology is used here in a very broad sense, to include a wide variety of inventions from communication means to healthcare which all can speed up the biological growth. The technological level of other species remains the same for ages, be it honeycomb construction for bees (see Nazzi, 2016) or group hunting tactics for lions (see Scheel and Packer, 1991). In contrast, human technology has become more complex and efficient over the past (Liang, 2018), and since new inventions feed on the previous, technology on its own may also grow in an exponential way (Kuznets, 1960). Hence, the same space can support more land tillers than hunters-gatherers, and even more industrial workers. This means that increasing technology increases Earth’s carrying capacity for the human species. When technology expands, population can continue to expand and often even faster (Boserup, 2005).
Human inventiveness may be unlimited, but that does not apply to the natural resources (Cleland, 2013; National Research Council, 2000). This sets an ultimate limit on Earth’s carrying capacity that no amount of technology can push upwards (Boserup, 2005; Meadows et al., 1972; Nørgård et al., 2010). So, when it comes to the Earth’s limits and humankind’s technological development, they interact in shaping the population growth (Liang, 2018).
The question is whether the ongoing digital revolution (see Haff, 2014) could change the socio-economic organization in a way that algorithms will be “accurately assessing resources availability and feeding back on society more and more independently from human decisions” (Grumbach and Hamant, 2018: 94). Under such circumstances, the Earth’s resources could be used so efficiently that it would enable further population growth. As we demonstrate in this paper, the world population reached its ceiling once—around 100 BCE—after which the population size remained stable for some 500 years. Even though such technological shift cannot be ruled out (Barnosky et al., 2012), the currently observed slowdown in the population growth does not indicate this is already the case (Cohen, 1995a; Livi-Bacci, 2017; Steffen et al., 2015).
Formalizing the world population growth
It is surprisingly hard to find an equation that could take in all three stages of the population increase: a slow initial growth, a tremendous acceleration, and a sharp slowdown. All the usual formats fail (Law et al., 2003). Past research has been wrestling with this issue. Biology-inspired simple logistic fits (Pearl and Reed, 1924: 632) do not suffice to express human population growth because the logistic ceiling itself is boosted by more developed technology (Liang, 2018; Pearson, 2015).
Cailleux (1951) first noted that the pattern in population growth was hyperbolic:
where
This format leads to a population curve that fits the population size estimates up to +1900 but later on projects to higher values, tending toward infinity sometimes as early as by +1980 (Ehrlich, 1968). The other data fits offer later
The quasi-hyperbolic pattern can be deduced from combining the separate self-enhancing exponential growths of technology and population. Even though they may be valid for earlier centuries, they still project to infinite population later on (see, e.g. Kremer, 1993; Taagepera, 1976). Some other models of interaction of population with Earth’s carrying capacity (Cohen, 1995a; House and Williams, 1976) impose a limit but do not show how technology increases this limit imposed by the Earth’s carrying capacity (Liang, 2018). Thus, they tend to miss the real pattern of the population growth.
Early attempts to modify or replace the quasi-hyperbolic model so as to avoid infinite population met limited success. Various differential equations could be set up (Austin and Brewer, 1971; Cohen, 1995a; Kapitza, 1996, etc.—see survey in Golosovsky, 2010), but they could be explicitly integrated only for
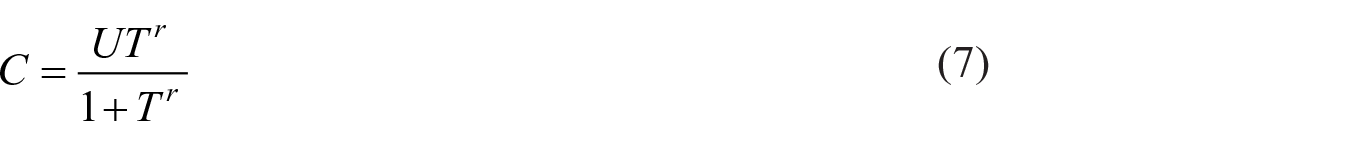
Blocking the infinite population growth is the hard part of modeling. The challenge is to find an equation that reduces to the well-proven quasi-hyperbolic in times past, yet would delay the asymptote. One must transform
Subscript
Data and accuracy of population size estimates
Now, when we have identified the most suitable mathematical format, it is time to bring in empirical data. Our original database of world population size estimates results from an extensive survey of literature which identified 25 studies examining the human population at various points in history. The earliest estimates are for 1,000,000 BCE, referring to the hominin ancestors of Homo sapiens, and the time coverage extends to 2100. Given the time when this research was completed, the population sizes from 2021 to 2100 are projections of the future development. Altogether we collected 873 world population size estimates—the sources and years are listed in the Supplemental Appendix Section A. 4
It is fair to add that the collected population size numbers represent “educated guesses” available in various studies. The estimates for the earliest times can be way off—possibly by a factor of up to 10. Nevertheless, they still serve a purpose given that population has multiplied over a million years by 5 orders of magnitude (from about 70,000 to 7 billion). From 5000 years ago, the estimates probably fit reality within a factor of 2—and much better soon after. Moreover, it is fair to assume that some researchers may systematically deviate from the remaining body of research. Therefore, we fit our population growth model to each source individually—see Section I in the Supplemental Appendix. To our surprise, this is not the case and our population growth model fits all sources of data that were combined into our collected database.
But why choose such a long timeline in the first place, given that the population estimates prior to −10,000 are few and highly uncertain. We include these estimates because they exist and any cut-off date might be deemed arbitrary, given that data scatter from −10,000 to −1,000,000 is no worse than it is from −200 to −10,000. The point is that a T-function fit over a million years is possible, but data scatter vastly exceeds the scatter during the present phase. Here the use of T-function is stretched to its extreme limit.
Nevertheless, the varying level of uncertainty during different times naturally implies that the population size estimates are more accurate for more recent times. However, considering the methodology of the research on population size, any assessment of its accuracy is fairly arbitrary (Cohen, 1995a; Van Den Bergh and Rietveld, 2004). Therefore, instead of making strong assumptions about the research method, we follow McEvedy and Jones (1978: 343–351) who noticed that the world population growth experienced a temporary, yet global, halt lasting a couple of centuries before +500 (which is the last stage of their primary cycle from −6000 to +500). 5 Considering this, we split the estimates into two groups: before +400, and after +400 (inclusive). Therefore, the empirical analysis begins with the population estimates starting from +400 given their higher accuracy. In the second step, we examine whether the trends from the recent history apply also to more distant past. Lastly, both stages are brought together to draw major conclusions.
Population growth models are notoriously known to struggle with enormous acceleration and increase of the number of people during a short time period (Law et al., 2003). If it is visualized on regular scales over many tens of millennia two straight lines result: At first, population seems to stay at zero as time moves on, and then the population curve shoots up vertically, as if time stood still. A well-known solution is to place the population size on a logarithmic scale and study it within a short time period—say a couple of last centuries (as by, e.g. Cohen, 1995a, 1995b, 1998; Dorling, 2013; Ehrlich, 1968; Gerland et al., 2014; von Foerster, 1966). However, the numbers still shoot up toward the very end if the world population growth is examined over tens of millennia. We bypass this problem by a novel solution, placing not only population but also time on a logarithmic scale, counting time back from a date in far future, 2200. 6 This may be controversial, given that time has no natural zero, but we will demonstrate that the use of logarithmic scales on both axes simply enables us to grasp simultaneously both extremes by compressing the most distant times as well as the recent huge population figures in a systematic way.
Empirical data fit: Developing the T-function to fit the present phase (from +400 until +2100)
Given its higher accuracy of population size estimates, we first address the present phase, starting by +400, leaving the ancient phase for later. Using the population size estimates after 400 included in our database, the optimal fit based on equation (2) is
It points toward the maximum populations size
Figure 1 shows the curve resulting from (3) and its fit to the population size estimates. As noted earlier, we graph not only population but also time on a logarithmic scale, counting time back from a date in far future, 2200. The data points are quite crowded in the right side of Figure 1 because the estimates for the last few centuries are largely overrepresented in the literature. Up to 1900,
Present phase of world population growth: Human population (in millions) versus time (from 400 until 2100), both on logarithmic scales (time counted back from 2200). Vertical flags indicate the range of estimates (if applicable). Multiple data points for the same year indicate that there are multiple estimates available in the literature.
The agreement of the model predictions with the most recent and widely respected population size estimates by United Nations, Department of Economic and Social Affairs (2019), and U.S. Census Bureau (2019) and their analyses (such as Dorling, 2013; or Gerland et al., 2014) are so close that it makes one to suspect we may have tailored the equation to fit them, but this is not so. Our data fit used only actual data up to 2010, past the absolute growth peak. The largest previous deviations from the best fit are the 13% shortfalls in 1400 and 1950. Within this error range, world population would level off at 11.2 ± 1.5 billion, if the pattern of the previous 1600 years continues.
Moreover, our findings relying on temporal extrapolation (see Van Den Bergh and Rietveld, 2004) provide results largely consistent with other probabilistic projections considering past, present, and future fertility, mortality, and migration (see, e.g. Dorling, 2013; Gerland et al., 2014; Lutz, 1996; Lutz et al., 1997, 2001; National Research Council, 2000; Pearson, 2015). Hence, this degree of agreement supplies additional confidence in both approaches.
Ancient phase (before +400): The same format, just with different constant values
Since the T-function (2) succeeds in fitting the present phase, one is tempted to apply it also to the ancient phase, even though it might actually consist of several boost-and-bust phases. The advent of agriculture and the shift from stone to bronze might have started new phases in population dynamics. McEvedy and Jones (1978: 343–351) identified a single period of human population growth during primary cycle from −6000 to +500. However, the scholarship offers population size estimates going way beyond −6000 to −1,000,000. The earliest estimates refer to the hominin ancestors of Homo sapiens. Using our data for the OLS regression of logarithms, equation (2) can be adjusted for the period preceding +400 as follows:
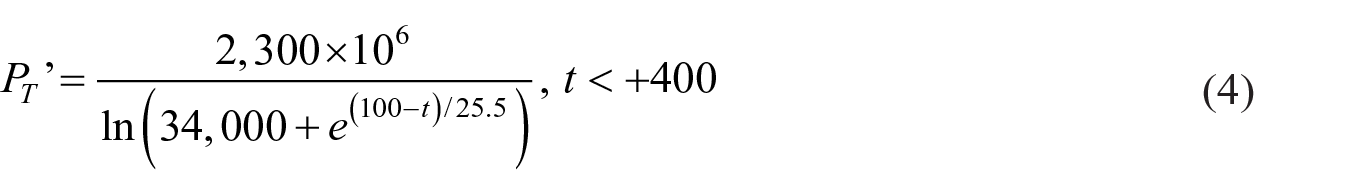
The previously established
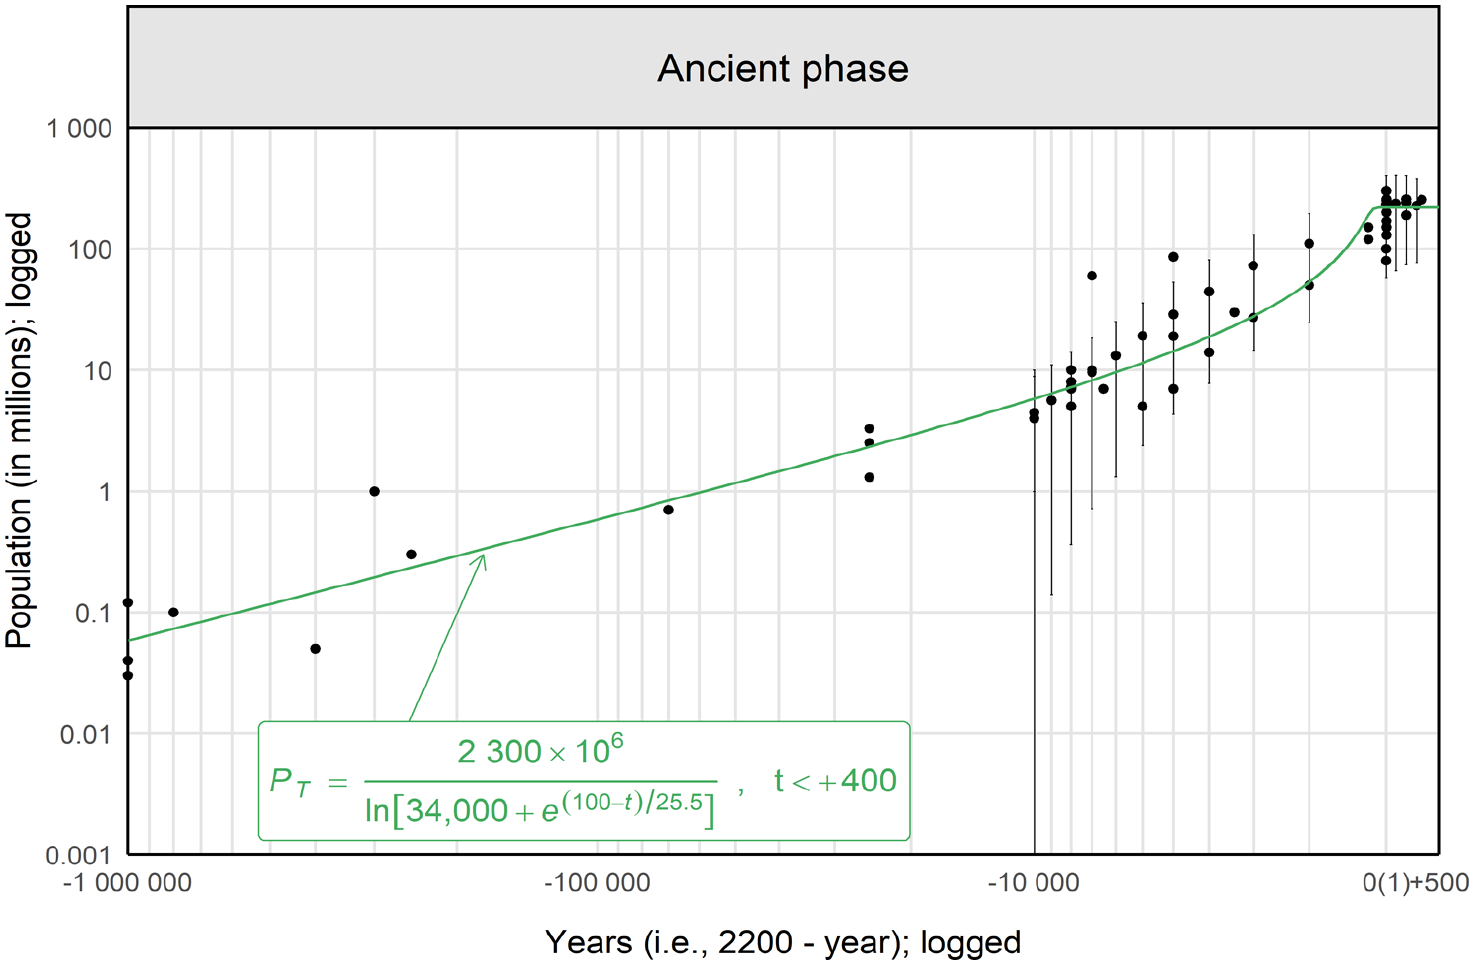
Ancient phase of world population growth: Human population (in millions) versus time (from −1,000,000 until +400), both on logarithmic scales (time counted back from 2200). Vertical flags indicate the range of estimates (if applicable). Multiple data points for the same year indicate that there are multiple estimates available in the literature.
While the numerator is close to that in (3), constant

The zone is wide, but there is no trend up or down.
A 10% decrease in population seems to take place from +100 to +400. This might be expected. As a plateau imposed by resources is approached but not yet exceeded, children may be born whose later adult needs would exceed available resources. The result would an overbeat followed downward readjustment to the level of ancient ultimate carrying capacity (
This points out an inherent limitation of the T-function: It is good at bending down the quasi-hyperbolic population curve to a steady plateau but does not allow for a decrease. The impact of time lag and depletion of nonrenewable resources could be more severe in the present phase than it was in the ancient phase because the maximum relative growth rate has been higher (1.54% vs 0.27% per year). The overbeat may be followed by population collapse that may become self-reinforcing. Such factors cannot be easily inserted in (3) and (4).
Here graphing
While keeping this limitation of the T-function in mind, it is worth looking into the process that produces this shape. The early quasi-hyperbolic part of the T-function reflects technology boosting Earth’s carrying capacity, and its later leveling off reflects an ultimate capacity no technology can overcome. Before constructing and solving a model of interaction among population, technology and carrying capacity, we’ll address the issue of the halt in-between the two phases.
World population growth: Two smooth phases and a temporary halt in-between
Figure 3 shows the overall outcome. The pattern seems to consist of two distinct upward-curving parts that bend down later on, with an intervening kink around −100. The successive prehistoric data points first rise slowly and then bend up ever more steeply. But growth comes to a sudden halt in −100 to +400, at 210±10 million people; even a 20 million decrease seems to take place. Thereafter, the pattern repeats itself. Population growth again gradually speeds up, especially from 1900 on, but slows down after 1980.
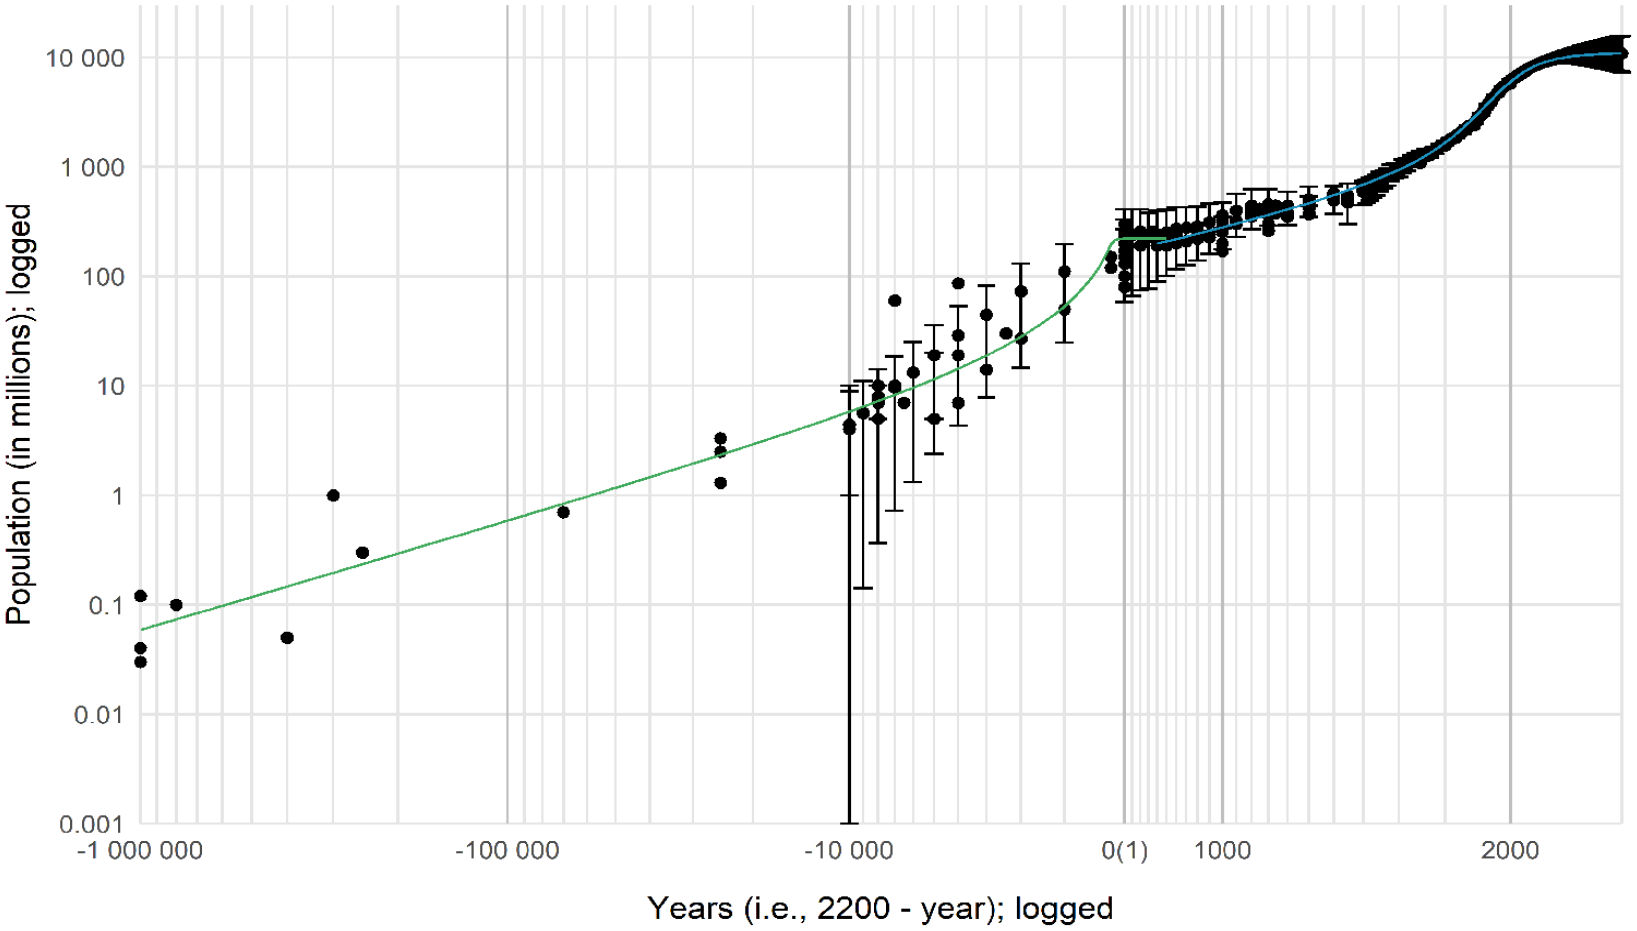
World population growth over millennia: Ancient (from at least −25,000 to −100), and present phase (from +400 to the present) with a temporary halt in between. Combining Figures 1 and 2 (time counted back from 2200). Green and blue lines represent the curves based on models developed in this research.
Randomness can produce apparent configurations. If one drew a straight line in Figure 3, say, through data points at −25,000 and +2100, could the data points look like random fluctuation around this line? One difference would remain. Undulation would be rather smooth elsewhere, while a pointed peak near −100 would be hard to avoid. This kink in the population pattern is surprising, in view of smoothness elsewhere. However, the kink between the two smooth parts (the “ancient” and “present” phases) is not an artifact of graphing time on logarithmic scale. It also shows up when
How widespread was the kink? The discontinuity was worldwide, although timing and severity varied, as shown in detail in Taagepera and Nemčok (forthcoming). Was this kink unique? This is not certain in ancient times. If one takes the averages of estimates at face value, further kinks could be inserted, especially around −100,000 or −10,000. On the other hand, such extra kinks are not needed: a single smooth curve can pass within the observed ranges of estimates. For historical times the only candidate is the end of McEvedy and Jones’s medieval cycle, from 1200 to 1500. The shortfall around 1400 is easily explained as a temporary effect of “Black Death,” with full recovery by 1700. The excess in 1200 is harder to account for. Still, Figure 1 suggests that the disruption around +1300 was relatively minor. If the kink around −100 wasn’t unique, it at least was by far the most clear-cut.
This intimates a unique shift in the entire technological paradigm. Ability to use written records represent one such watershed. Previous to writing, one could learn only from people one met. With writing, one could learn from those far away and long dead. Yet, developing the use of written records was a slow process, with no obvious bottleneck around −100. What may have been lacking was social organization and technical knowhow so as to make use of existing written records. In contrast, the causes of the presently looming slowdown look more physical: drinkable water, breathable air, and land area at a livable temperature (Cleland, 2013; National Research Council, 2000).
Theoretical constraints: Interaction of population, carrying capacity, and technology
In this last part, it is time to dive into the process behind the pattern observed. This involves formulation of mutually consistent equations for all three factors, with explicit numerical values of constants spelled out. The main theoretical constraints are: Increase in population (
Increase in
Increase in
Increase in
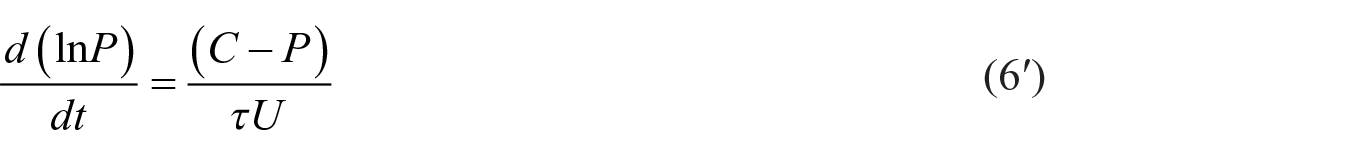
These three statements are specified as the starting equations for our population growth model equations below (as (6), (7), and (8)). Such sets are usually solvable only by iteration but knowing that the solution for population is approximated by a T-function with known constants enables us to present the entire set complete with numerical constants.
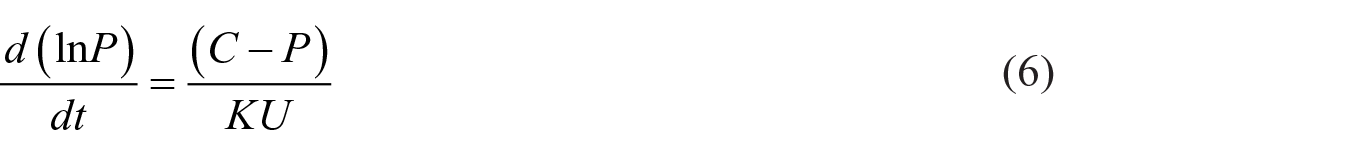
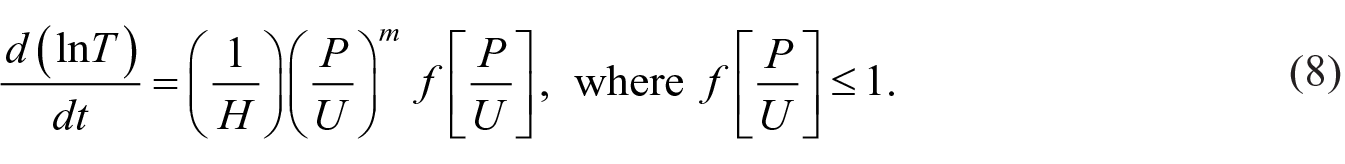
Here
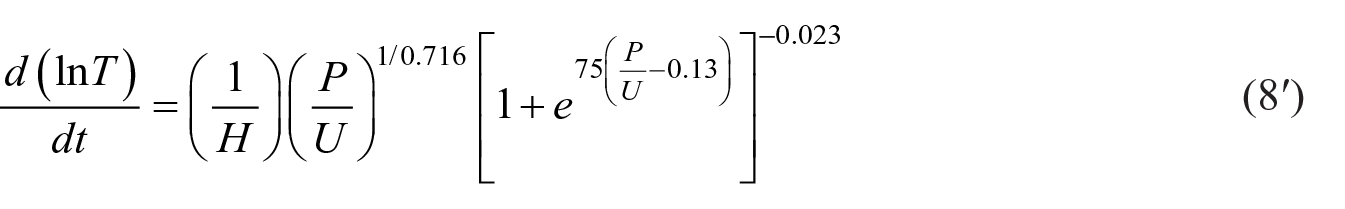
The technology equation (8) assumes that technology is self-enhancing (Kuznets, 1960), but the rate constant is boosted by the number of potential inventors (Taagepera, 1976). A term
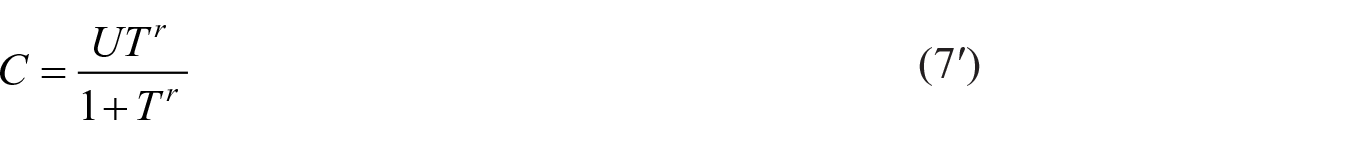
The set of equations (6), (7), and (8) cannot be explicitly solved. However, we know that the values of
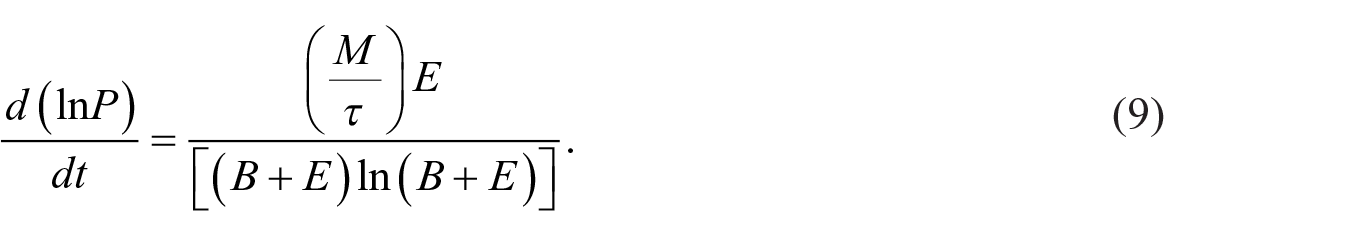
Entering this rate into (6), the corresponding values of carrying capacity (designed as
via (9), provided the value of

Its limit is the same as for
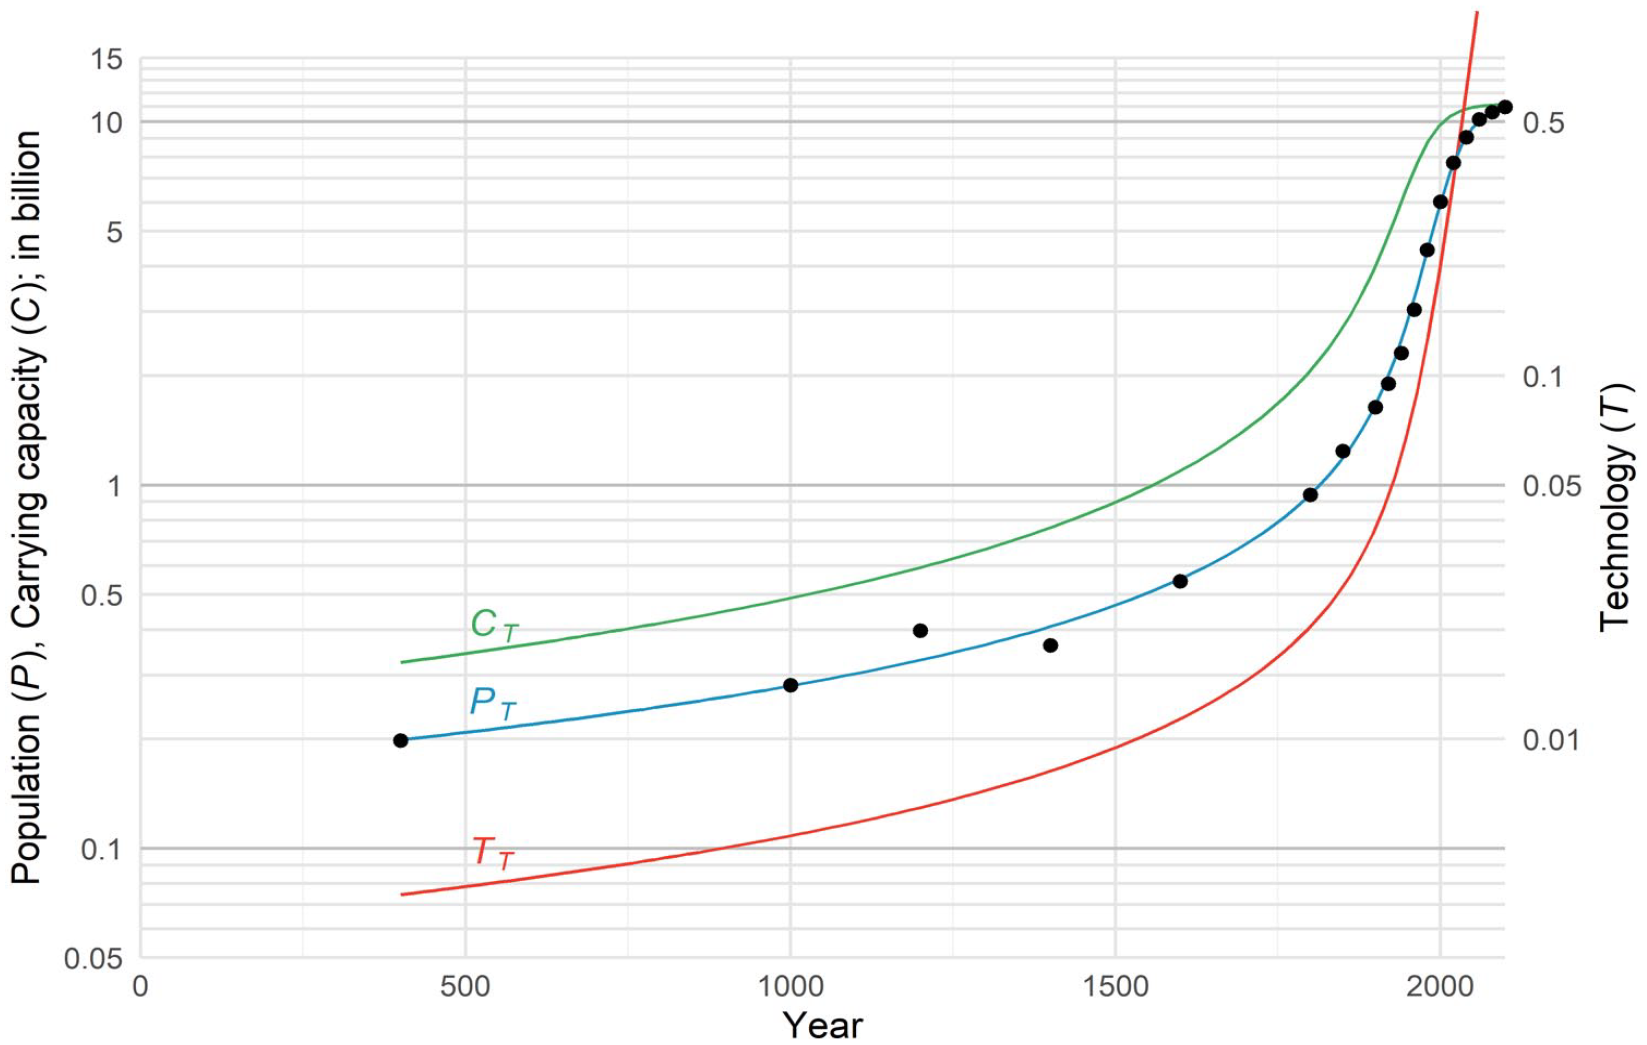
World population estimates and their fit (
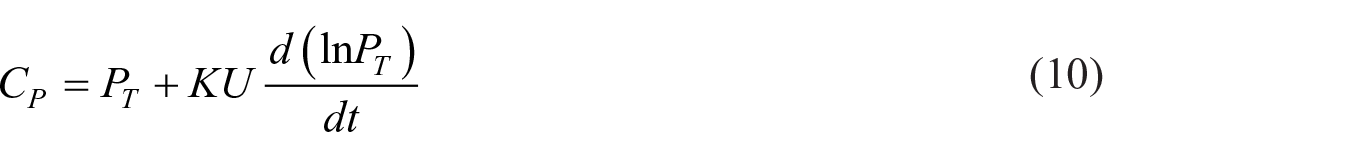
In this model carrying capacity exceeds actual population by a factor of 1.63 in +400. Thereafter, technology increase boosts this capacity faster than population can follow suite, to the point where
Reformulations in (7) and (8) make it possible to deduce
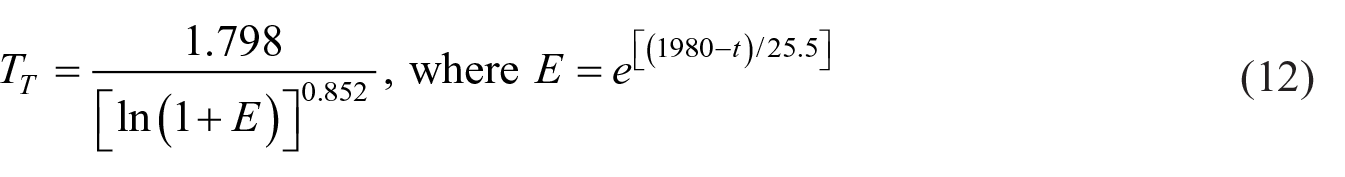
Subscript
It can be shown that the constant
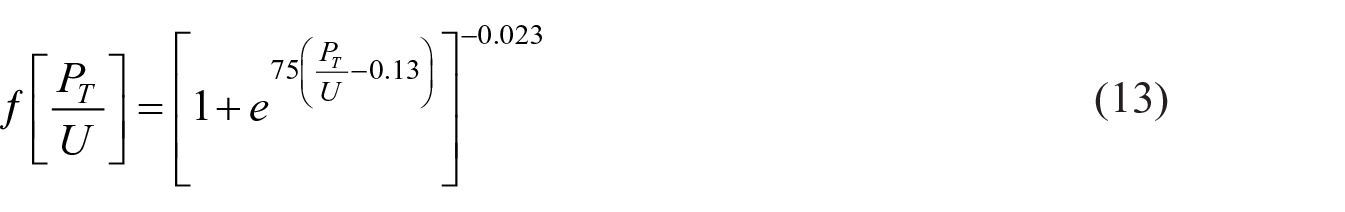
This fit practically remains at 1 prior to
In sum, the developed population growth model (6), (7), and (8) can now be presented complete with numerical constants for the present phase:
where
In this model, Earth’s carrying capacity increases faster than population up to 1900. By 2020 the ultimate capacity is almost reached, even while population still grows at a hefty pace. The technology growth curve is the steepest one in Figure 4, propelled by increasing and then stably high population. It is at first driving up Earth’s carrying capacity almost proportionately, but after 1900 the curves diverge, as capacity hits an insurmountable barrier—limits on water, air and space to live in and to pollute (Cleland, 2013; National Research Council, 2000).
What we have is a fully specified and internally consistent model of how growths in population and technology interact through the intermediary of Earth’s carrying capacity when the latter faces an ultimate limit. The technology and capacity patterns ((12) and (11)) inferred from the population pattern are highly hypothetical. Parts of them may be liable to independent verification, but this is outside the scope of the present study. Recall that our model assumes ultimate capacity as a constant that has acted at least since +400 as an ever more forceful brake on population increase. Human technology cannot push capacity beyond that level. But human pollution, including global warming, may well start reducing it. Thus, as far as future is concerned, our simple model represents an upper envelope.
For the ancient phase of population growth, (6) to (8) apply in principle, but data uncertainties make it hardly worthwhile calculating any numerical values for capacity and technology.
The limitations of the proposed model: Discussion
When it comes to world population over millennia, one might expect wide fluctuations around some central tendency. Instead, the pattern for the last 1600 years has been quite smooth (as has been observed not only by us, but in numerous other works too—see, e.g. Cohen, 1995a; Golosovsky, 2010; Lutz, 1996; Lutz et al., 2001; McEvedy and Jones, 1978). One can account for this in general terms. Technological development is steadily boosting the number of people Earth can nourish, and local fluctuations are smoothed out. While such a broad statement hardly raises eyebrows, following it up in quantitative detail may meet a different response. Viewing something as diverse as “technology” as a measurable quantity (Kuznets, 1960) may look oversimplified. Our population growth model may seem to presume more worldwide coordination than there could have been (see Liang, 2018). A steady move toward a numerically defined limit might seem to require people’s awareness of that limit centuries ahead, so as to act in accordance with it. Actually, only some coordination is needed.
Indeed, no instantaneous worldwide technology transfer is needed—only some contact during a span of centuries (and millennia, in the distant past), within the area where most people lived and most technological advance took place until recently—a broad zone from the Mediterranean to West Asia, India, and China. As for early awareness of a future limit, no more is needed than in the simplest experiment where bacteria growth in contained surroundings leads to a simple logistic pattern (Vandermeer, 2010). Once the inflection point is reached, an outside observer can guess at the eventual limit; the bacteria do not have to be informed. They react only to the momentary population size
When it comes to the future, our population growth model does encounter a major limitation: By its very structure it imposes an eventual steady state, excluding further increase or decrease (unlike, e.g. Bongaarts, 2016; Pearson, 2015 who model future decrease). Between the ancient and present phases, the world population remained around this ultimate carrying capacity “only” for around 500 years and then received an unexplainable boost around +400 which triggered the repetition of the same pattern. From today’s perspective, only a similar once-in-2000-years breakthrough could raise the ultimate level discerned in this research for the ongoing phase. On the other hand, a reduction can materialize in two ways. First, a lag time could cause an overbeat, followed by oscillation that could be much more severe than after +100. Second, depletion of nonrenewable resources and heating up the planet may well reduce its ultimate carrying capacity (Pimentel and Pimentel, 2006). While our population growth model includes
Could lag time and depletion of nonrenewable resources be worked into the model? This is possible in principle. But the values of constants describing the decrease could be determined only after it has begun. This is analogous to determination of ultimate level
Conclusion
This study opens up new vistas on the long-term growth pattern of human population. Our human ancestors one million years ago numbered about 60,000. How did we come to be almost 8 billion? To examine these trends, it is a challenge to find a mathematical equation that account for all three stages of the population increase—a slow growth in the beginning, an enormous acceleration, and a sudden slowdown (Law et al., 2003). We overcome these challenges by making use of the “tamed quasi-hyperbolic function” that has been shown to fit the steeper-than-exponential growth of the world population remarkably well (Taagepera, 2014).
The progress in modeling is achieved thanks to a novel way of graphing world population against time, both on logarithmic scales. Such a visualization approach highlights a pattern of two smooth upward curves from −25,000 (and possibly from −1,000,000 where we refer to the hominin ancestors of Homo sapiens) to −100 and again from +400 to +2020. They are divided by an unexplained kink around −100 separating the two phases, bringing population growth to a halt up to +400 (see Figure 3). The two smooth phases (“ancient” and “present”) can be fitted with quasi-hyperbolic equations for most of their durations but not when the asymptote of this pattern approaches. To extend the curve to fit to this part of the curves requires a more complex format, designated as T-function. This study refines a previous fit for the present phase and adds a fit for the ancient phase.
Attempts have been made earlier to account for the pattern in the present phase by a population-technology (Kremer, 1993; Taagepera, 1976) and a population-Earth’s carrying capacity interaction process (Cohen, 1995a; House and Williams, 1976). When unbounded, it leads to quasi-hyperbolic growth, with its asymptote pointing toward the infinite population (Cailleux, 1951; Meyer, 1958, 1974; Meyer and Vallee, 1975; Taagepera, 1979; von Foerster et al., 1960; von Hoerner, 1975). We interact all three factors—population growth (
The resulting model based on the “tamed quasi-hyperbolic function” projects to the population growth that has been visualized in Figure 3. It empirically fits the world population since +400 better than any single-inflection-point fit previously proposed, be they explicit equations or iterations from unsolved differential equations. Going beyond the conventionally studied period of the population growth covering the last centuries, we conduct a survey of the literature identifying 25 studies providing 873 world population size estimates from 1,000,000 BCE until 2100 CE. Remarkably, the same mathematical format, with just slightly different constant values, neatly fits the estimated population sizes regardless of the source. Hence, these findings suggest that the world population grew in two distinct phases: “ancient” and “present” with a temporary intervening halt for 500 years in-between. Considering that the population increase has been recently slowing down during the last decades (Bongaarts, 2016; Cohen, 1998: 28; Gerland et al., 2014; Lutz et al., 1997, 2001) and the pattern copies the trend from some 2000 years ago, the stall between −100 to +400 can provide relevant insights into what to expect from the decades to come.
One such relevant observation could be that world population not only stabilizes but tends to decrease by 10% at the very end of the ancient phase. This is due to lag times during growth to adulthood and depletion of nonrenewable resources. The decrease is likely to be starker in the present phase. Our population growth model projects to an upper limit of 11.2 ± 1.5 billion for the world population at its peak. Even though it cannot project the extent of later decrease (because the math would get unbearably complex), it is reasonable to expect that the total world population will drop somewhat drop after reaching the ceiling around 2100 CE. Only then it will likely remain stable somewhere around the resulting level.
Finally, it may feel uneasy to trust that world population growth has been as smooth as it appears from this research. The covered time period includes the cataclysmic Toba volcanic eruption 70,000 years ago when ashes blocked sunshine worldwide and freezing soil pushed humankind to the edge of extinction (Ambrose, 1998). In another major event around 1400, Black Death resulted in the deaths of up to 75–200 million (Ziegler, 1969). Yet, these events still caused only a temporary (and often minor) deviation from the long-term trajectories we identify. Events like Spanish flu, or recent COVID-19 pandemic caused barely noticeable blimps on the population growth trajectory (Harper, 2021; Viglione, 2020). Therefore, the approach of temporal extrapolation (see Van Den Bergh and Rietveld, 2004) provides some relevant insights for times to come. If—and only if—the average millennial patterns continue to hold, then our model would still align with the future. The future is not obliged to continue past trends; it just often does, which is the reason why extrapolations can provide valuable expectations about the future development. It cannot be ruled out that the ongoing digital revolution (see Haff, 2014) can boost the Earth’s carrying capacity thanks to more efficient resource distribution coordinated by computers (as proposed by Grumbach and Hamant, 2018). In fact, a similar technological shift must have contributed to the second phase of the population growth from 400 CE, as we demonstrated in this research. However, current slowdown in the population growth does not indicate this is already the case (Bongaarts, 2016; Cohen, 1995a; Livi-Bacci, 2017; Steffen et al., 2015). Nor can it be ruled out that human-induced global warming might reduce Earth’s ultimate carrying capacity and hence world population in a major way.
Supplemental Material
sj-pdf-1-anr-10.1177_20530196231172423 – Supplemental material for World population growth over millennia: Ancient and present phases with a temporary halt in-between
Supplemental material, sj-pdf-1-anr-10.1177_20530196231172423 for World population growth over millennia: Ancient and present phases with a temporary halt in-between by Rein Taagepera and Miroslav Nemčok in The Anthropocene Review
Footnotes
References
Supplementary Material
Please find the following supplemental material available below.
For Open Access articles published under a Creative Commons License, all supplemental material carries the same license as the article it is associated with.
For non-Open Access articles published, all supplemental material carries a non-exclusive license, and permission requests for re-use of supplemental material or any part of supplemental material shall be sent directly to the copyright owner as specified in the copyright notice associated with the article.