
Abstract
The remote Antarctic continent, distant from human industrial activity, should be one of the last places on Earth to capture Anthropogenic change. Hence, stratigraphic evidence of pollution and nuclear activity in the Antarctic provides proof of the global nature of the Anthropocene epoch. We propose an Antarctic Peninsula ice core candidate for the Global boundary Stratotype Section and Point (GSSP) to the onset of the Anthropocene. The Palmer ice core captures the first evidence of spheroidal carbonaceous fly ash particles (SCPs), resulting from high temperature combustion deposited in Antarctic ice. SCPs first appear in 1936 CE, preceding the rise in plutonium (239+240Pu) concentrations from 1945 CE onwards. GSSP 1952 CE occurs at a depth of 34.9 m, coincident with the peak in 239+240Pu the primary marker for this site.
Introduction
Antarctica’s remote location, distant from industrial sources and with no permanent or indigenous human population, makes it an ideal candidate for identifying the onset of the Anthropocene. Often referred to as the ‘last great wilderness’, Antarctica is assumed to be a pristine environment free from the influence of human activity. However, the presence of atmospheric pollutants, soot and black carbon from fossil fuel and biomass burning (Cordero et al., 2022), heavy metals from mining (Bargagli, 2008; Potocki et al., 2016) and microplastics (Aves et al., 2022) are a powerful reminder that the Anthropocene is a global phenomenon and even the most remote region on Earth bears its mark.
The Antarctic Peninsula was chosen as a location to identify the Global boundary Stratotype Section and Point (GSSP) for the Anthropocene Series due to its potential suitability as a GSSP and sensitivity to anthropogenic climate change. The preparatory activities of the Anthropocene Working Group (AWG), including events leading to the submission of GSSP proposals and the binding decision that the base of the Anthropocene should align with stratigraphic signals dating to the mid-20th century, are detailed in the introductory article to this special issue (Waters et al., 2023). In this paper we focus on the Palmer ice core from the Antarctic Peninsula, as an invited contribution to the AWG to propose a suitable Antarctic ice core GSSP site.
Here we present the Palmer ice core as a candidate for the Anthropocene series. We provide evidence from two Anthropogenic proxies, spheroidal carbonaceous fly ash particles (SCPs) and plutonium (239+240Pu). We also include the stable water isotopes (δ18O), snow accumulation and atmospheric methane (CH4) concentrations from this site as supporting material relating to climate and anthropogenic change. The Palmer ice core was selected from a transect of ice cores drilled along the spine of the Antarctic Peninsula since the mid-1990s (Thomas and Tetzner, 2018). Although arguably many other ice cores could have been proposed to represent the Antarctic GSSP, the Palmer ice core was selected based on the following criteria:
The exceptional chronology and sample resolution
The Antarctic Peninsula receives the highest amount of snowfall of all Antarctic regions, exceeding ~4 m per year in some areas (van Wessem et al., 2016). Snowfall is highest around the coast and areas of orographic uplift, such as the Palmer site. Deposition of anthropogenic proxies is likely related to snowfall (wet deposition) and thus the concentration of proxies is expected to be highest at coastal and high snow accumulation sites. Evaluation of reanalysis data (ERA-Interim, 1979–2010) confirms that the ice core site receives an estimated annual average precipitation minus evaporation of 49 cm (water equivalent). While lower elevation Peninsula ice cores have higher snow accumulation (Thomas et al., 2017), few extend beyond the past ~150 years (Emanuelsson et al., 2022b; Thomas and Tetzner, 2018). The Palmer ice core was selected to provide sufficient layer thickness to capture changes at sub-annual resolution, while ensuring a record that extends over the past ~300 years.
The sensitivity to Anthropogenic climate change
In contrast to much of the Antarctic continent, the Antarctic Peninsula is the only region to reveal strong and statistically significant warming trends since observations began in 1957 (Gonzalez and Fortuny, 2018; Jones et al., 2016). Paleoclimate observations from ice cores and moss peat banks suggest that the warming from 1957 onwards is part of a 100-year trend (Royles et al., 2013; Thomas et al., 2013) that began in the ~1920s. The rise in surface temperatures is accompanied by significant increases in snow accumulation (Medley and Thomas, 2019; Thomas et al., 2008, 2015, 2017), which has been linked changes in atmospheric circulation, sea ice conditions and the increased moisture content associated with a warming atmosphere (Medley and Thomas, 2019). The increased surface temperatures, together with the increased occurrence of warm and dry fohn winds descending over the Antarctic Peninsula, have been attributed to the collapse of Antarctic Peninsula ice shelves (e.g. Banwell et al., 2013).
The site has excellent sample preservation, not impacted by melt
Despite the evidence of increased surface temperatures during the 20th century (e.g. Jones et al., 2016), the occurrence of surface melt on the Antarctic Peninsula is limited to the floating ice shelves and low-elevation coastal locations (van Wessem et al., 2016). While the James Ross Island ice core, from the northern tip of the Antarctic Peninsula, reveals an acceleration in surface melting during the 20th century (Abram et al., 2013), there are very few visible melt features in the Palmer core. Therefore, the impact of melt on the climate and anthropogenic proxies at Palmer is assumed to be negligible. Indeed, a recent study revealed that the stable water isotope record (δ18O) from Palmer has the potential to reconstruct melt over the Larsen ice shelves (Emanuelsson et al., 2022a), even though the δ18O itself is not directly impacted by melting. Thus, the strategic location of the Palmer core makes it sensitive to climate variability, without being adversely impacted by it.
The link to long-range transport for anthropogenic proxies
Back-trajectory analysis confirms that the Amundsen-Bellingshausen Sea is the dominant source region for air-masses reaching the Palmer ice core site (Thomas and Bracegirdle, 2015). The geographical setting of the Antarctic Peninsula, which forms a barrier for the strong southern hemisphere westerly winds, deflects onshore (northerly) air-masses to the Palmer site. An observed seasonal migration in the trajectories (1979–2010 CE) is related to changes in the Amundsen Sea Low, a climatological low-pressure system that is driven by large-scale modes of climate variability (Thomas and Bracegirdle, 2015). These include the Southern Annular Mode (SAM), largest mode of variability in the Southern Hemisphere, and El Nino Southern Oscillation (ENSO). The shift to the positive phase of the SAM, in response to stratospheric ozone depletion (Lubin et al., 2008), constitutes one of the largest trends in the past 200 years (Jones et al., 2016). Antarctic Peninsula ice cores capture changes in the SAM, ENSO and tropical teleconnections in the western Pacific (Medley and Thomas, 2019; Thomas et al., 2008, 2013, 2015, 2017). The Palmer core specifically displays a strong relationship with the Inter-decadal Pacific oscillation (IPO) (Emanuelsson et al., 2022a). Thus, Palmer provides an optimal location to capture the deposition of anthropogenic proxies, due to the continent’s remote location, involves long-range atmospheric transport and a clear pathway of northerly air-mass incursions.
The availability of uncontaminated frozen sample with sufficient volume for new analysis
An advantage of the Palmer ice core, over many deep ice cores, is that it was drilled without drilling fluid. The high-density drilling fluid, used routinely to keep the ice core borehole open, is one of the main sources of chemical and biological contamination in ice cores (Alekhina et al., 2018). While most Antarctic ice cores which span the mid-20th century were drilled in the 1990s (e.g. Thomas et al., 2017), the Palmer core was drilled in 2012 and has therefore not experienced any potential degradation or damage associated with long-term storage. A key objective of the AWG was to undertake new analysis of anthropogenic proxies, requiring substantial ice volumes. Unlike more established and heavily sampled Antarctic ice cores, the Palmer ice core has sufficient sample volume for new analysis whilst meeting the GSSP requirements to maintain an archive.
Materials and methods
Geographic setting of core sites
The Palmer ice core was drilled in the Palmer Land region of the Antarctic Peninsula [73.86°S, 65.46°W] (Figure 1). The Antarctic Peninsula ice sheet sits within a 2000 m high mountain chain that extends ~1300-km northward from continental Antarctica towards the southern tip of South America. The ice core was drilled at 1897 m above sea level, close to the ice divide, where horizontal ice flow is expected to be minimal. The estimated ice thickness at the drill site is ~1000 m (Fretwell et al., 2013). With average 2 m temperatures of −28.5°C, and summer averages of −16.2°C, (ERA5 reanalysis data) this cold site is unlikely to be affected by surface melting. As one of the highest points on the ice sheet, the site is distant from any orographic disturbances, such as mountain peaks or areas of exposed rock. The closest rock outcrop is a small nunatak approximately 35 km from the drill site. The closest areas of human activity are the summer only stations of Sky Blu (1435 m a.s.l.), ~210 km to the southwest, which began operations in 1995 CE, and Fossil Bluff (92 m a.s.l.), ~300 km to the northwest which has been used intermittently since 1961 CE. The closest year-round research station, Rothera (4 m a.s.l.), is over 700 km to the north, which began operation in 1975 CE. Thus, the influence of local human activity or light industry is expected to be minimal at this remote location, especially prior to the 1960s.
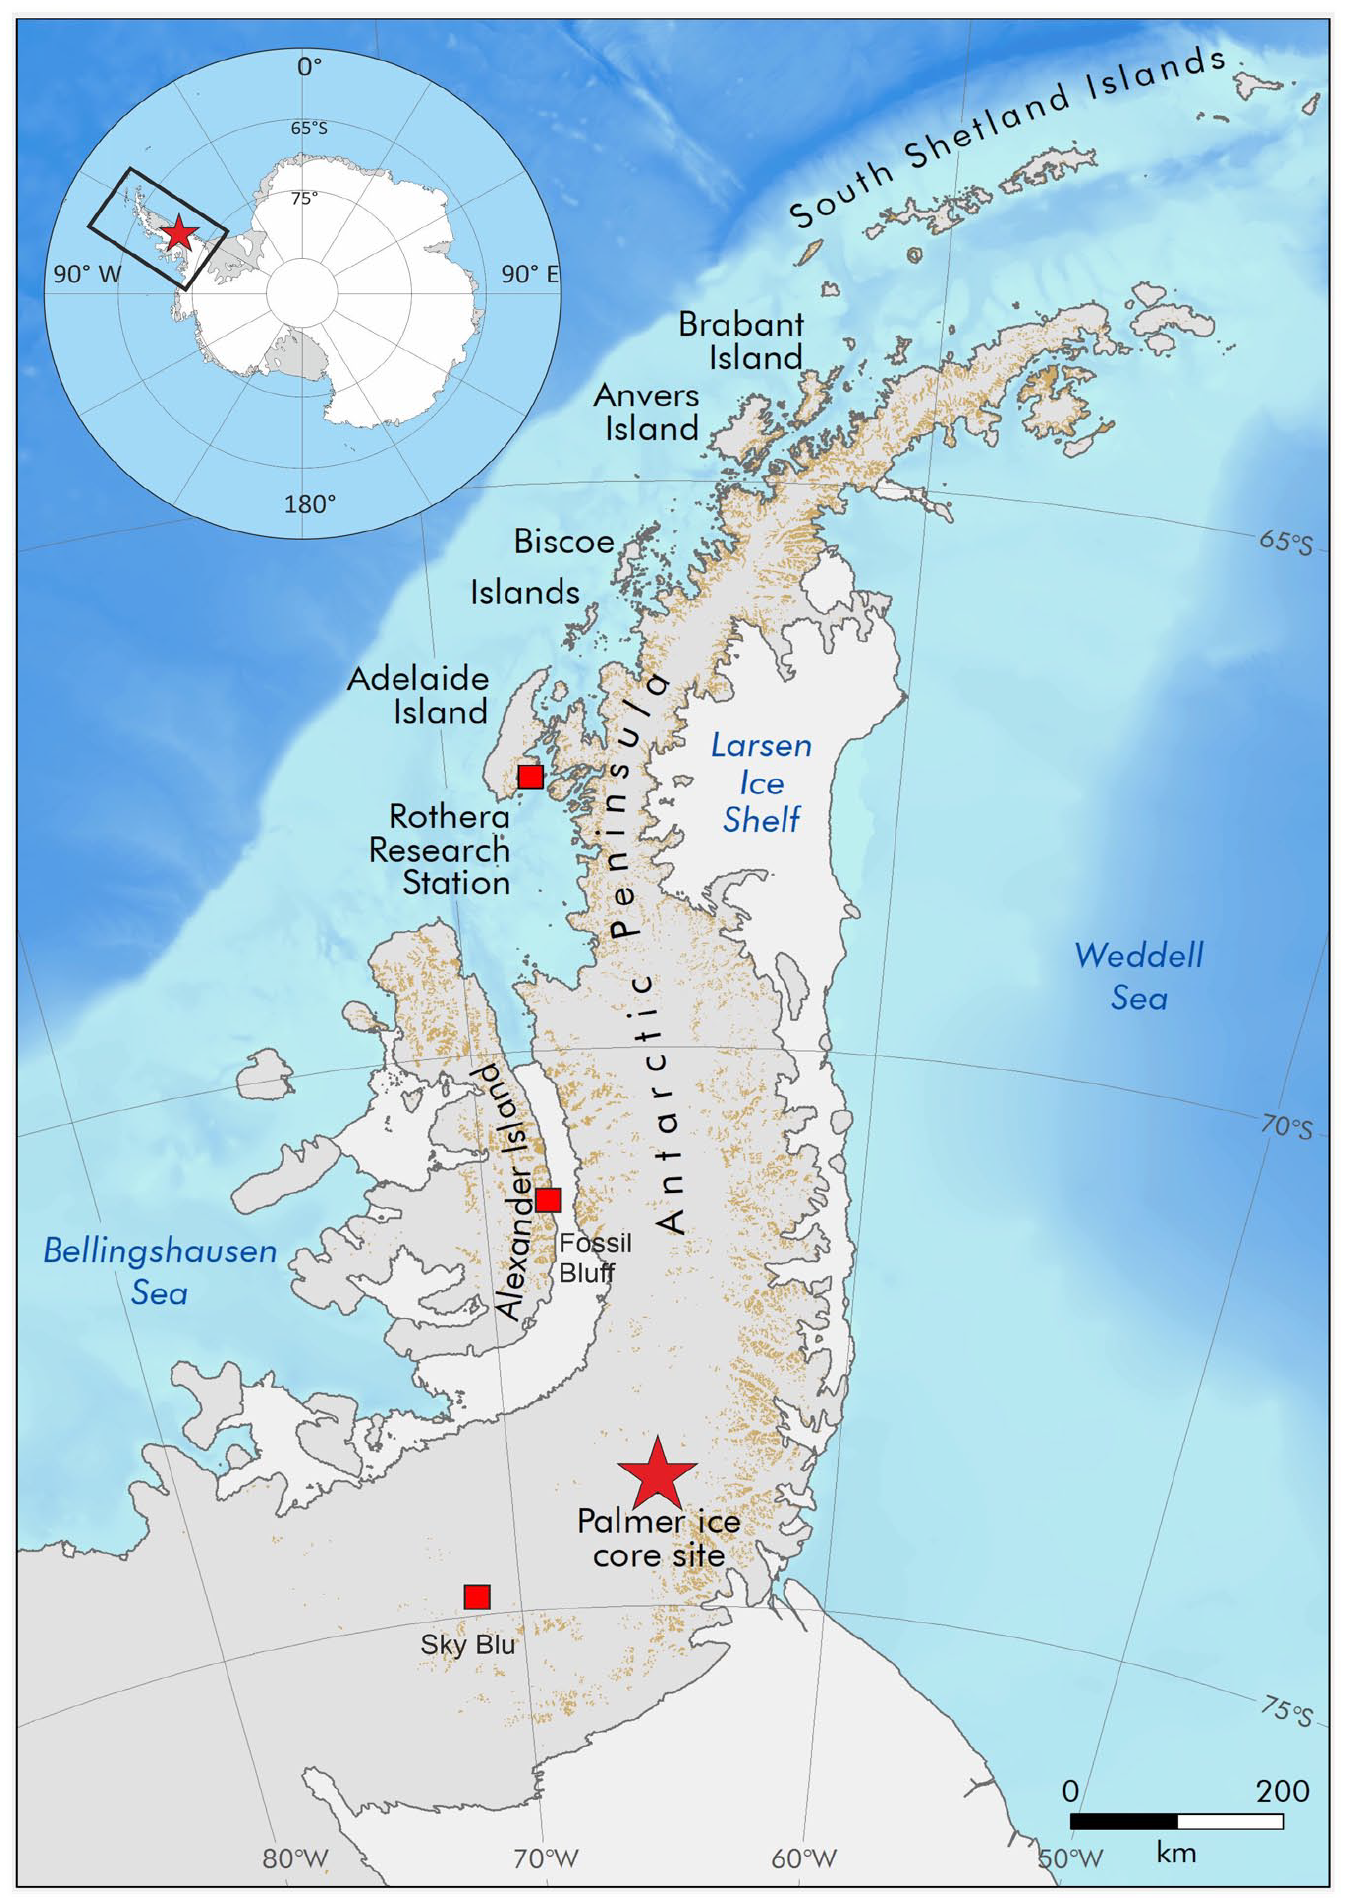
Map of the Antarctic Peninsula showing the Palmer ice core location (red star), and the location of research stations. Insert map of the Antarctic content, highlighting the Antarctica Peninsula (black rectangle). Copyright Laura Gerrish, BAS. Reproduced in colour in online version.
Field collection of core and sampling
The ice core was drilled over 6 days between the 24th and 29th December 2012. It was drilled using the British Antarctic Survey (BAS) electromechanical dry drill, which operates in a dry borehole without drill fluid. The final drilling depth was 133.45 m, drilled in approximate 1 m sections. The cores were cut to 85 cm length, using a cross-saw, and wrapped in pre-labelled layflat tubing. The cores were weighed and measured in the field before being loaded into insulated boxes, with polystyrene inserts to prevent core damage during transport. The boxes were stored in a trench in the field, where the atmospheric temperature remained below −20°C. The ice was transported via Twin Otter aircraft to Rothera research station, loaded into a −25°C refrigerated container and shipped to BAS for analysis and long-term storage. The ice samples, and remaining archive, are kept at −25°C in a monitored, temperature-controlled freezer facility in the dedicated BAS ice core laboratories in Cambridge, UK.
Chronological controls
A suite of chemical and isotopic species analysed using continuous flow analysis (CFA), using longitudinal ice sections (32 ×32 mm). Ice samples are loaded onto a heated melt head (in a −25°C freezer) and the sample stream of water and gas, from trapped air bubbles, are separated in a debubbler before being pumped into a series of analytical instruments (Grieman et al., 2022). The bespoke CFA system comprises Fast Ion Chromatography (FIC), Dionex ICS-3000, to measure major anions sulphate [SO42−], nitrate [NO3−], chloride [Cl−], and methane sulphonic acid [MSA−]. The FIC data acquisition is one 2.63 cm sample every 4 cm, thus providing an average depth resolution of 4 cm (Grieman et al., 2022). Hydrogen peroxide [H2O2] was measured using a FIAlab photomultiplier tube-fluorescence detector (PMT-FL), connected to the CFA. The estimated resolution for the fluorescence detection is ~1.4 ± 0.5 cm (Grieman et al., 2022). Water isotopes (δ18O) were measured using a Picarro analyzer (L2130-i) operating in a custom-made continuous-flow setup. Internal standards, calibrated to the V-SMOW2/Standard Light Antarctic Precipitation 2 (V-SMOW2/SLAP2) scale, were used to calibrate the isotope records. The average depth resolution for δ18O is ~4 cm.
The number of data points per year is dependent on the ice depth and annual snow accumulation rate. During the 30-year interval surrounding the proposed GSSP (1940–1970 CE), the average snow accumulation was 43 ± 27 cm snow per year. This provided an average of 10 (±6) data points per year for major ions and δ18O, and 30 (±10) data points per year for H2O2.
The ice core was dated using annual layer counting, based on seasonal deposition of chemical and isotopic species (Figure 2). Clear seasonal cycles are observed in sulphate [SO42−], which peaks during the austral summer (November–January) when marine productivity is highest, and hydrogen peroxide (H2O2), a photochemical species which peaks during the summer solstice. δ18O also displays a seasonal cycle, although with a weaker amplitude than [SO42−] and H2O2 (Figure 2d) (Emanuelsson et al., 2022b). The annual layers were counted manually, assigning years where a clear peak was observed in at least two of the chronological markers SO42− and H2O2, or δ18O. Years with only one clear marker, or during unavoidable data gaps (e.g. core breaks), were marked as uncertain.
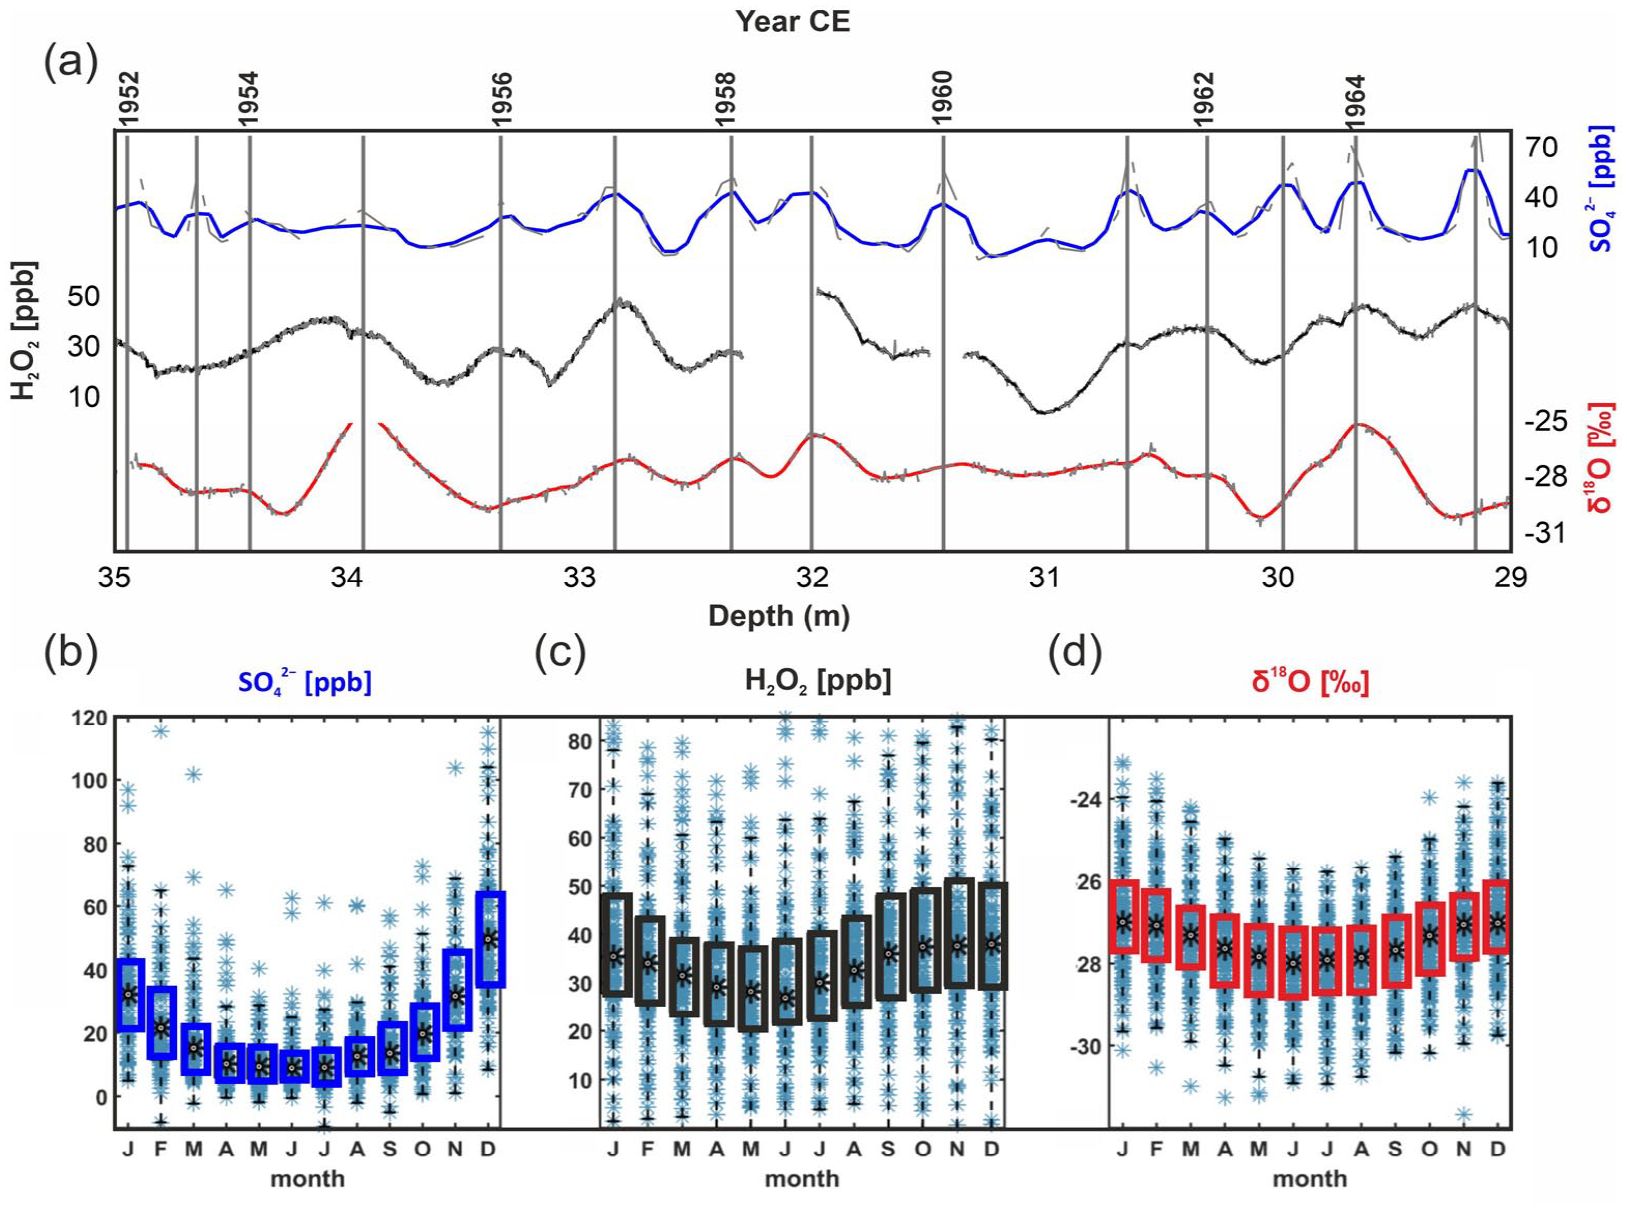
Annual layer counting. (a) Seasonal cycles in sulphate [SO42−] (blue), hydrogen peroxide [H2O2] (black), and stable water isotopes [δ18O] (red) from 1952-1965 CE. High resolution data for all species shown in grey dashed curves, solid lines represent a 3-point running mean (7-point running mean for [H2O2]). Seasonality plots modified from Emanuelsson et al. (2022b) for (b) [SO42−] (blue), (c) [H2O2] (black), and (d) [δ18O] (red). Monthly averaged values for each month, the coloured boxed indicating the 25th and 75th percentiles. Reproduced in colour in online version.
The age-scale is independently verified by identifying volcanic [SO42−] peaks, classified as [SO42−] values which exceed two standard deviations (2σ) above the mean (Figure 3a). To account for the natural variability in background [SO42−] we apply a running 200 data-point (approx. 10-years) mean and standard deviation (Figure 3b).
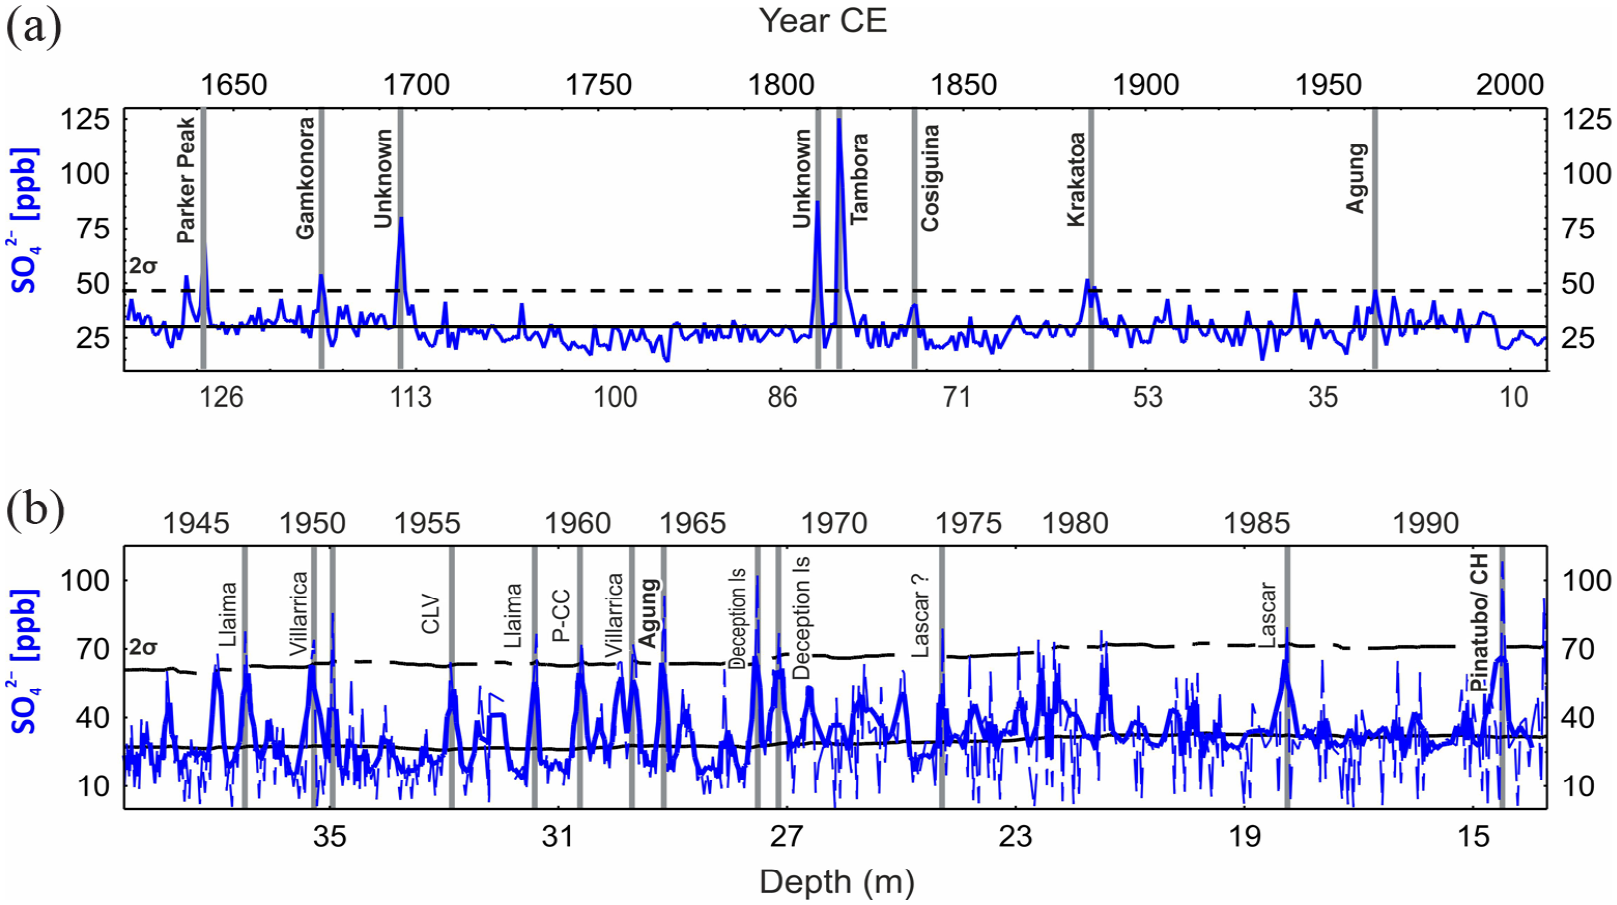
Volcanic reference horizons in the Palmer chronology plotted on a depth (bottom axis) and age-scale (top axis). (a) Annual average [SO42−], highlighting volcanic peaks (grey vertical lines) identified in other Antarctic and bi-polar ice cores. Solid horizontal line indicates record average and dashed horizontal line indicates 2σ above the record average. (b) Raw (~4 cm resolution) [SO42−] between 1942 and 1993 CE, highlighting both mid-latitude (Agung and Pinatubo, bold) and Southern Hemisphere eruptions (Global Volcanism Program, 2022). Solid vertical lines indicate peaks exceeding 2σ above a 200-point running average (solid black curve), with corresponding dated volcanic eruptions exceeding VEI 3. Cerro Hudson (CH), Carran-Los Venados (CLV) and Puyehue-Cordon Caulle (P-CC). Reproduced in colour in online version.
Anthropocene proxies
Radioisotopes
Discrete samples were cut to annual resolution, spanning the period 1930–1998 CE. The surface area of each annual sample was 11.4 cm2, and the sample volumes ranged between 64 and 430 mL. This reflects the varying snow accumulation during this period (1930-1998 CE), which can range between 0.11 and 0.57 m of water equivalent per year. Subsequently, the annual samples were combined to two-yearly resolution due to the extremely low sample concentrations detected. The average sample volume (1930–1998 CE) was 459 ± 366 mL.
All samples were analysed in the GAU-Radioanalytical Laboratories at the University of Southampton. Samples were spiked with Pu-242 recovery tracer, transferred into PTFE beakers, and evaporated to dryness. Samples underwent a series of acid treatments, with the residues evaporated to dryness after each treatment. First residues were dissolved using concentrated hydrofluoric acid (HF) solution (2 ×10 mL), followed by nitric acid (HNO3) (3×20 mL), and finally boiled undercover in 40 mL concentrated hydrochloric acid (HCl) for 2 hours. After this 2 g of boric acid was added and the samples were boiled again until complete boric acid dissolution (2 hours).
Solutions were evaporated to dryness, re-dissolved in 30 ml 1 M HNO3 and boiled again under cover until a completely clear solution was obtained. 10 mg of iron (Fe) carrier was added and 239+240Pu was co-precipitated with Fe(OH)3 using concentrated ammonia solution. Obtained precipitates were dissolved in HCl and acid molarity was adjusted to 9 M. Samples were loaded onto anion exchange columns (1 ×5 cm), previously conditioned with 9 M HCl. After the load solution passed the columns, columns were washed with further 30 mL of 9 M HCl followed by 50 ml of 8 M HNO3 and again 10 mL of 9 M HCl.
Finally, 239+240Pu was stripped from the columns using 9MHCl/NH4I (ammonium iodide) solution into clean beakers. Solutions were evaporated to dryness with 5 mL conc HNO3 added to remove excess iodide. Thin alpha-spectrometric sources were prepared using electrodeposition from diluted HCl/oxalate solution. Prepared sources were counted for 238Pu and 239+240Pu using Alpha Octete spectrometers with PIPS detectors and spectra analysed using Maestro 32 software. Detection limits were ca. 0.5 uBq/g.
Spheroidal carbonaceous fly-ash particles (SCPs)
SCPs are only produced by the high temperature, industrial combustion of coal-series and oil fuels (Rose, 2015). They are morphologically distinct under the light and scanning electron microscope making them unambiguous indicators of deposition from these sources (Rose, 2008). Two methods were applied to identify the presence of SCPs in the ice. The first approach used discrete samples cut from the archive section of the Palmer ice core. The second approach used scanning electron microscopy of filters of melt water collected as part of the CFA analysis.
Annual samples were provided between 1900 and 1998 CE. The ice core sample volumes provided ranged between 64 and 430 mL, and SCP analysis was conducted on every sample (total of 98) down-core. The surface area of each annual sample was 11.4 cm2.
Each ice core water sample, representing a single year, was filtered through a glass microfibre (GF/C) filter. The filtering apparatus was rinsed with deionised water between samples. The filter papers were then analysed for SCPs following a method adapted from Rose (1994), involving dissolution of the filter paper using hydrofluoric acid followed by a treatment with hydrochloric acid to remove any precipitate formed from the filter (Rose, 1994). Between acid treatments, the samples were washed with distilled water, centrifuged, and decanted. This was repeated twice as a final washing step to remove any remaining acid. SCPs are composed mostly of elemental carbon and are chemically robust and undamaged by the acid process. A known fraction of the final suspension was evaporated onto multiple coverslips and mounted onto microscope slides. The number and sizes of SCPs on the coverslips were counted using a light microscope at x400 magnification using criteria for SCP identification (Rose, 2008). Analytical blanks were included in duplicate for each sample batch, and no SCPs were observed in these blanks.
The second approach used the melt water produced while processing ice samples on the BAS CFA system (Grieman et al., 2022). Melt water from the CFA waste lines was collected in new and sealed low-density polyethylene (LDPE; Nalgene™) bottles. Melt water represents the effective deposition of snow and particles over a 6.53 cm2 surface. Samples were collected at annual resolution between 2011 and 1980 CE (33 samples), and between 5 and 8-year resolution between 1900 and 1979 CE (16 samples). Sample volumes ranged between 44 mL and 927 mL. Meltwater from each sample was then filtered through 13 mm diameter, 1.0 μm pore size Whatman™ Polycarbonate membrane filters, inside clean polypropylene Swinnnex™ filter holders. Each filter was then mounted onto an aluminium stub for analyses on a scanning electron microscope (SEM) in the Earth Sciences Department at the University of Cambridge. Filters were imaged on a Quanta-650F using back scattered electrons (BSE) on a low-pressure mode. Each filter was imaged at x800 magnification for SCPs identification, following the analysis strategy presented in Tetzner et al. (2021). SCPs were identified, based on their characteristic morphological and textural features. Analytical blanks were included every 15 samples in the filtration process. No SCPs were observed in the blanks.
Methane
The Palmer methane (CH4) record was measured using a continuous flow analysis (CFA) (Grieman et al., 2022; Stowasser et al., 2012). The melted water stream (with an average melt rate of 3–5 cm/min) is pumped through three steps of gas extraction; (1) a debubbler, where gravity takes away excess water, (2) a hydrophobic membrane, which separates gas bubbles from the water completely, and (3) a Nafion dryer, which absorbs water vapour on a molecular level. The dry gas sample stream is measured continuously with the commercially available laser spectrometer Picarro G2301 using wavelength-scanned cavity ring-down spectroscopy. The effective CH4 stratigraphic resolution is 1.5–17.5 cm. The instrumental CFA CH4 uncertainty is 10 ppb. The raw CH4 mixing ratio was calibrated to NOAA gas standards (https://gml.noaa.gov/ccl/airstandard.html) to obtain absolute values and corrected for solubility in the meltwater stream. NOAA primary air standards (405.8 and 869.1 ppb [CH4] calibrated against the WMO (World Meteorological Organization) X2004A reference scale Dlugokencky et al., 2005) were measured before and after the CFA analysis providing a slope of 1.034 and intercept of 3.708. The percentage of dissolved gas was calculated daily based on an experiment mimicking a melted water stream by mixing a working standard gas ([CH4] = 606.97 ppb) and deionised water. An average factor to increase the CH4 mixing ratio is 8.75%.
The age of the CH4 (or any other gas) is not equal to the age of the ice at a certain depth. The so-called gas-ice age difference (or ΔAge) (Lemieux-Dudon et al., 2010) relates to the atmospheric air trapping when the glacier ice forms. Pores between grains close at a certain depth (typically between 50 and 70 m in ice sheets but can be down to 120 m – (Buizert et al., 2021)), based on the snow and firn (granular snow that has not yet been compressed into ice) densification process.
The gas age at the depth that the pores lock-in (56.8 m for Palmer) is 0 year, because the air is exchanged in the opened pores with the atmospheric air on the surface. Throughout the lock-in zone bubbles close steadily, and the air defuses until the close-off depth. This occurs at 62.8 m, where the ΔAge is 17 years. The ΔAge is unique to each ice core site and often assumed to be constant for calculation convenience. One can identify ΔAge either by firn densification modelling (see e.g. Buizert et al., 2021) or by synchronising with existing atmospheric gas records (Blunier et al., 2007). In this study, synchronisation to the Law Dome CH4 record (Rubino et al., 2019) is adopted, matching the absolute values and slopes of the two records. The ΔAge was verified using the community firn model (Stevens et al., 2020) implemented using a varying snow accumulation rate, ranging from 0.17 to 0.33 m w.e. yr−1 based on measured density, annual layer depths (Emanuelsson et al., 2022a) and an annual average surface air temperature estimate of −28.5°C (ERA 5 reanalysis). The ΔAge from the community firn model approach ranges from 112 to 162 years, in agreement with the ΔAge estimate based on gas synchronisation of 90 to 140 years.
Numerical analysis
Change points in CH4 detected using a Bayesian Estimator of Abrupt change, Seasonal change, and Trend (BEAST) (Zhao et al., 2019). It is a decomposition algorithm with built-in Bayesian model averages. It allows identification of a time stamp of a long-term trend change in a noisy time series. For CH4, the change-point analysis was run using 5-yearly averages (to reflect the mixing in the firn column) and presented with an estimated error of ±5 years.
Results
Chronology
The Palmer ice core covers 391 years, 1621–2011 CE, and is one of the oldest records from the Antarctic Peninsula. The annual layer counted age scale is verified using the dates of known volcanic eruptions that have been detected in ice cores from both Antarctic and Arctic ice cores (Sigl et al., 2013). Six distinct peaks are observed in the annual averaged [SO42−] (Figure 3a) corresponding to volcanic eruptions documented in the WAIS divide ice core (Sigl et al., 2013). This includes Parker peak (1640), Gamkonora (1673), Tambora (1815), Cosiguina (1835), Krakatoa (1883), and Agung (1963) Two additional peaks are assigned to eruptions of unknown sources (1694 and 1809), which have been widely documented and identified in other Antarctic and Arctic sites (Emanuelsson et al., 2022b). The chronological error is established by evaluating the absolute age differences of volcanic horizons in Palmer, compared with documented ages in the WAIS divide ice core (Sigl et al., 2013). The maximum age difference is 6-months and thus our chronological error is ±0.5-year.
The 1963 eruption of Agung, Indonesia, provides the closest tie-point for the proposed GSSP. While the annual average [SO42−] does not exceed the threshold of 2σ above the mean, the threshold is exceeded in the raw (~4 cm) data, at a depth of 29.2 m corresponding to 1964 (Figure 3b). The 1991 eruption of Pinatubo, Philippines, is another well-documented eruption visible in many polar ice cores (Sigl et al., 2013). The threshold of 2σ is also only exceeded in the raw data, as a distinct [SO42−] peak at 14.5 m corresponding to 1992 (Figure 3b). A delay of between 1 and 3 years is expected between the volcanic eruption and the deposition of [SO42−] at an Antarctic ice core site (Cole-Dai et al., 1997).
A number of smaller, more proximal, eruptions provide additional age constraints during the mid-20th century (3b) (Global Volcanism Program, 2022). Deception island, located in the South Shetland islands to the north of the Antarctic Peninsula is known to have been active between 1968 and 1970 with a volcanic explosivity index (VEI) of 3. This is coincident with multiple [SO42−] peaks that exceed 2σ (and 3σ) above the running 200-point average between 29.5 and 27.09 m (1968–1969 CE). Two peaks in [SO42−] at 36.5 m and 34.9 m most likely correspond to documented eruptions of Llaima (1945 CE) and Villarrica (1948/1949 CE), two stratovolcanoes from southern Chile with documented VEI 3 eruptions (Global Volcanism Program, 2022). These peaks are used to constrain the lower portion of the GSSP period.
Radioisotopes
The 239+240Pu activity concentrations are presented in Figures 4 and 5. The first evidence of 239+240Pu in the Palmer ice core is at 37.16 m depth, corresponding to years 1945–1946 CE. This constitutes the lowest concentration (0.39 µB/g) in the Palmer record. The concentrations of 239+240Pu at Palmer increase after 1945, through a subsidiary maximum in the early 1950s, reaching an absolute maximum (1.38 µB/g) at 30.48 m by 1960–1961.
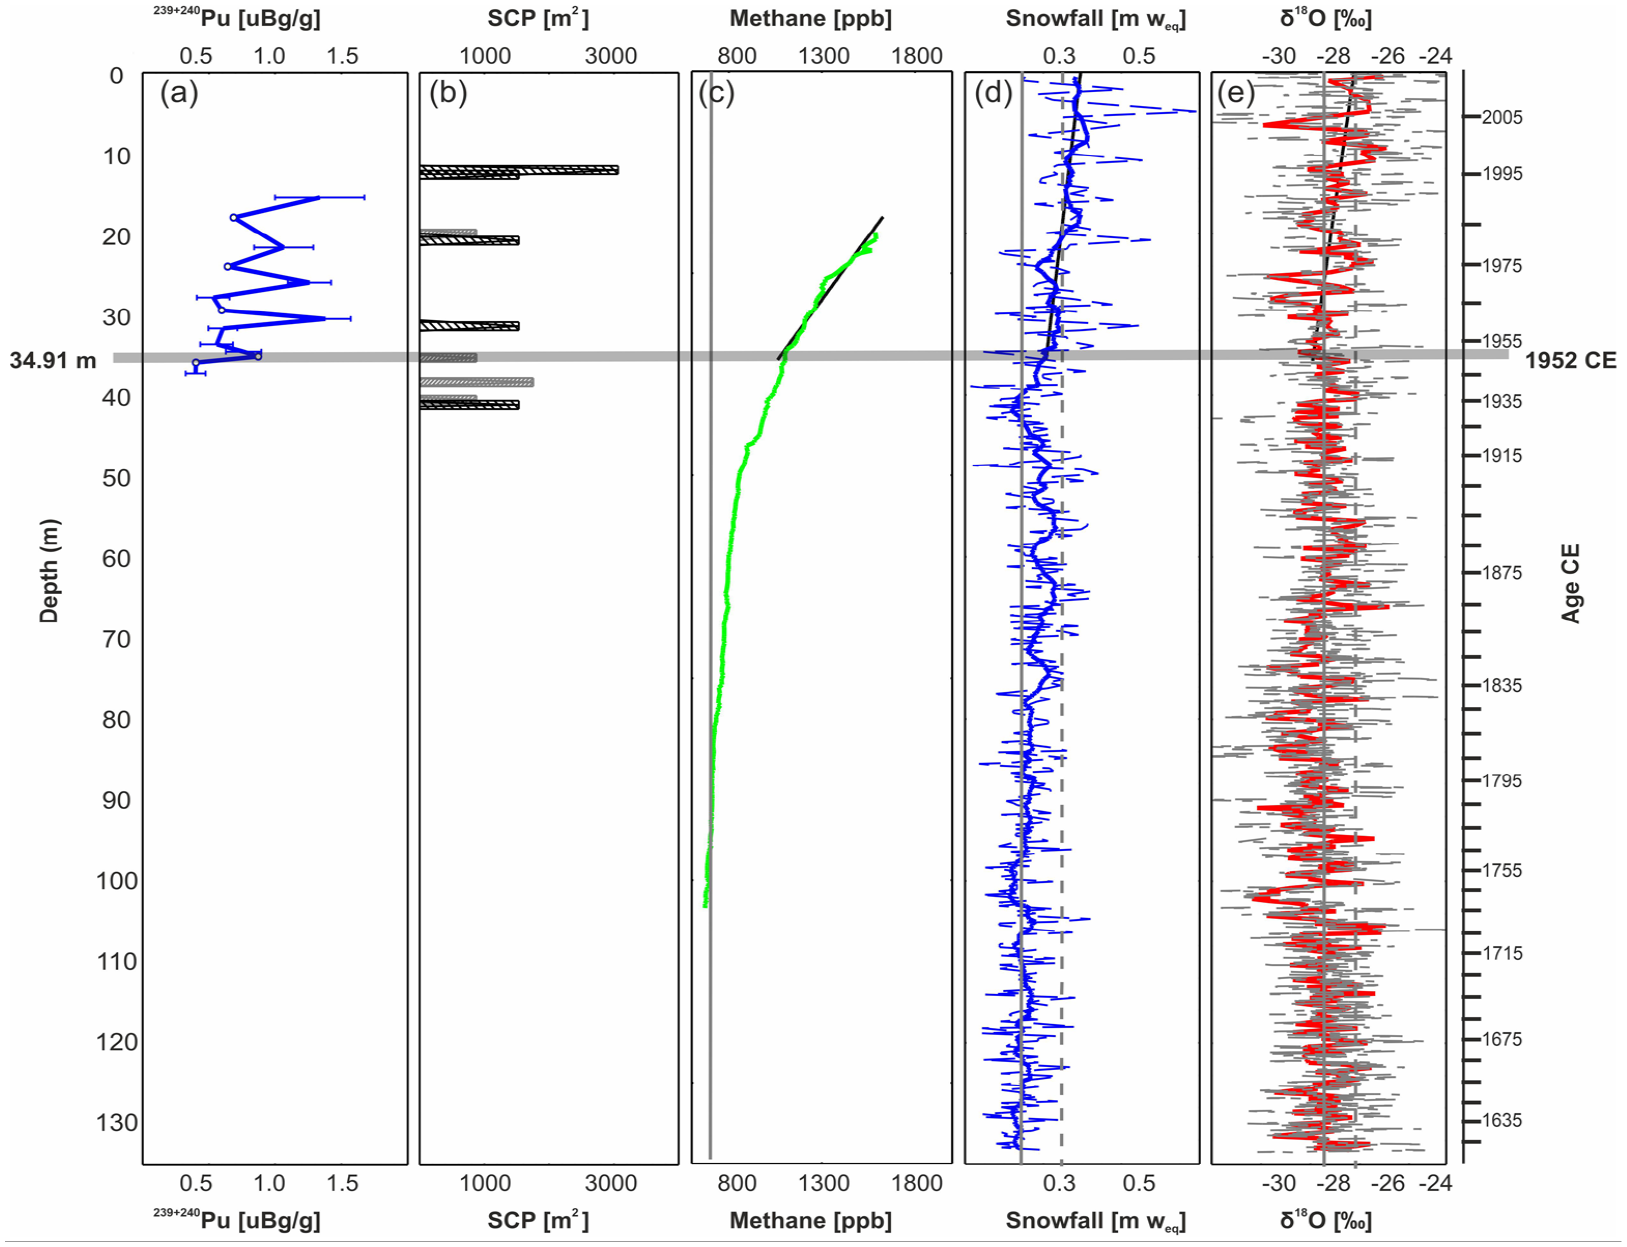
Anthropogenic proxies in the Palmer ice core in the context of the last 391 years. (a) Plutonium (239+240Pu) [µBg/g] (solid), with error bars, presented as 2-yearly resolution. Open circles indicate data below detection limit. (b) SCPs [m2] determined using discrete sampling (black bars, annual resolution) and continuous sampling (grey bars, 1–5-year resolution). Auxiliary climatological records (c) (CH4 [ppb], (d) annual snowfall (meters of water equivalent) (dashed line) with running decadal mean (thick solid curve) and (e) δ18O (‰) at 4 cm resolution (grey dashed curve) and annual averages (solid red curve). All data plotted on a depth scale (left axis), with age-scale shown on right axis. The proposed GSSP is highlighted in the grey line corresponding to depth 34.91 m (1952 CE). Reproduced in colour in online version.
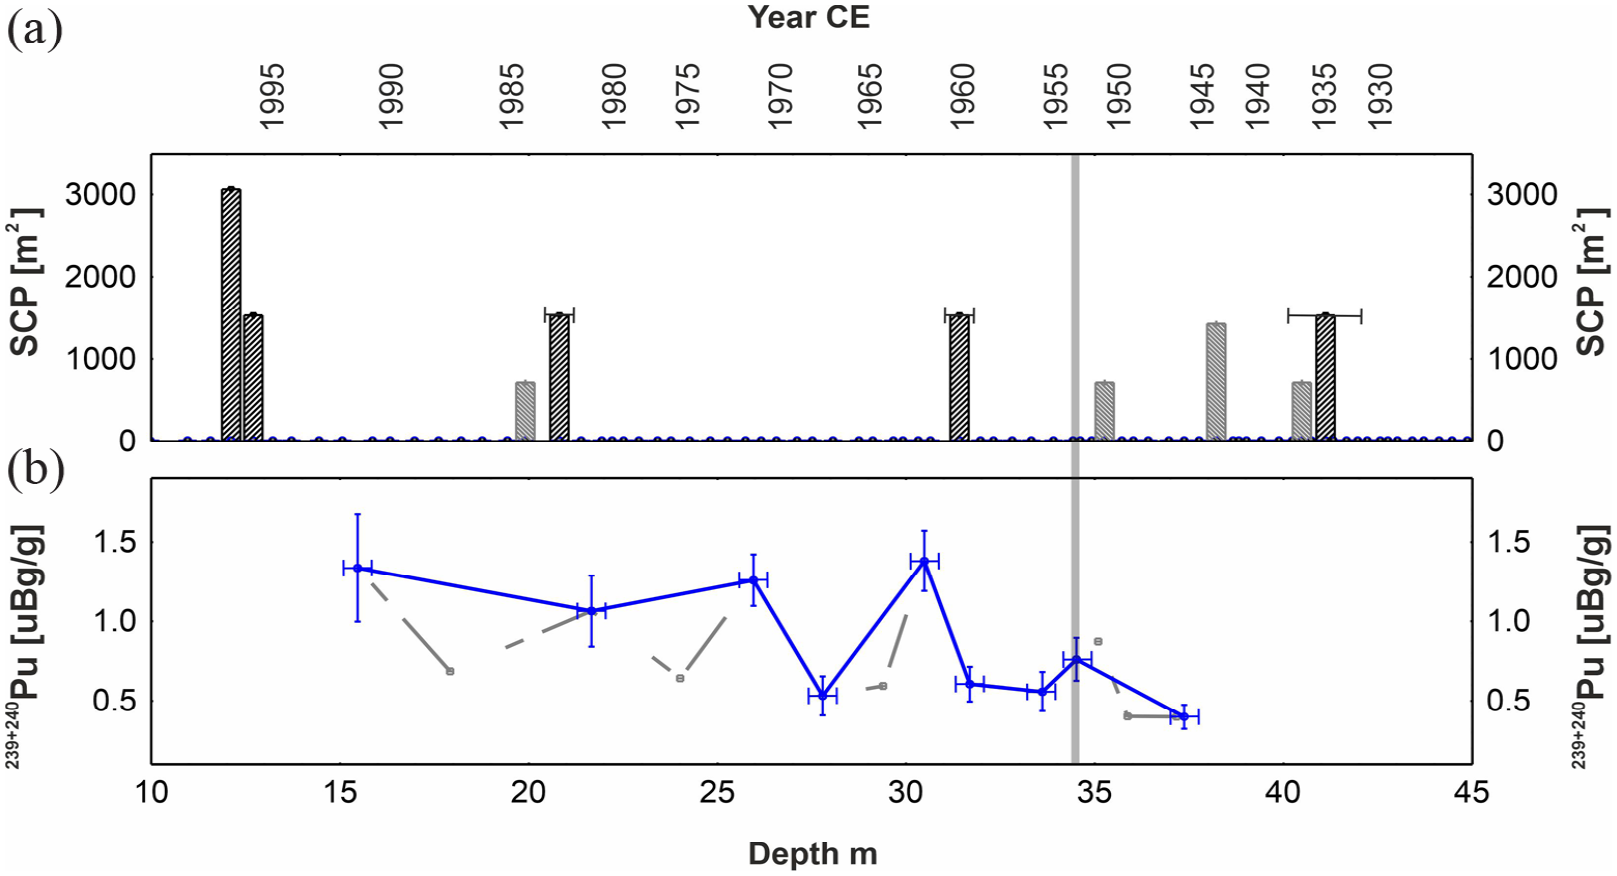
Anthropogenic proxies in the Palmer ice core between 1930-1998 CE. (a) SCPs [m2] determined using discrete sampling (black bars, annual resolution) and continuous sampling (grey bars, 1–5-year resolution). Blue dots indicate samples analysed where no SCPs were found. (b) Plutonium (239+240Pu) [µBg/g], measured at bi-annual resolution from 1946 to 1991 CE (grey dashed curve). Values which exceed the limit of detection shown in blue (presented in Figure 4). Error bars in the x-axis denote depth resolution and error in the y-axis denote analytical uncertainty. Vertical grey line denotes the proposed GSSP horizon at 34.91 m (1952 CE). Reproduced in colour in online version.
The low concentrations are consistent with previous 239+240Pu measured in Antarctic ice cores (Arienzo et al., 2016), which are considerably lower than concentrations measured in Greenland ice cores or Alpine ice cores (Gabrieli et al., 2013) or other mid-latitude archives (Waters et al., 2015). Temporal trends are also broadly similar to those reported previously (e.g. Arienzo et al., 2016), with two exceptions, in the date of first detection of Pu in the ice core, and post-1980 concentration trends. In previous studies, the first detected Pu in Antarctic ice cores was 1952 CE, while in Alpine cores it was as late as 1954 CE. The earlier detection in the Palmer ice core may reflect the different analytical approaches, which has previously been measured using Inductively Coupled Plasma – Sector Field Mass Spectrometer (ICP-SFMS) (e.g. (Gabrieli et al., 2013). However, the proximity to the test sites (surrounding the Pacific region) may also explain the earlier detection on the Antarctic Peninsula. Back-trajectory analysis indicates that the Pacific sector of the Southern Ocean is the dominant source region for the 5-day air-parcels reaching Palmer (Thomas and Bracegirdle, 2015). An apparent secondary increase in 239+240Pu in 1990 (albeit with low precision, with concentrations close to detection limits), if real, may be a result of increased aerosol or dust supply, and likely reflects local processes rather than any regional fallout process.
Novel materials
Fly-ash (SCPs)
A total of five SCPs were identified using method 1 (discrete sampling), with a further six SCPs identified using method 2 (continuous meltwater). These 11 particles constitute the first evidence that SCPs have been deposited in Antarctica (Rose, 2015), and to our knowledge are the first dated record of deposition in an Antarctic ice core. The SCP record is presented as a concentration (m2) in Figures 4 and 5. The first SCP observed using method 1 is in the ice layer corresponding to 1936 CE (40.48 m). For the continuous method (methods 2) the first SCP is identified in the sample centred on 41.12 m depth, which incapsulates years 1930–1937 CE.
Geochemical proxies for climate
Stable water isotopes
δ18O are commonly used to reconstruct past surface temperature from Antarctic ice cores (e.g. Stenni et al., 2017). The stable water isotope record from Palmer displays evidence of seasonal cycles, ranging from −33.12 ‰ (winter) to −20.51‰ (summer). When converted to decadal averages, the values from the most recent decade (2001-2010 CE) are the most isotopically enriched (−26.82‰), thus suggesting that temperatures during the first decade of the 21st century were warmer than any decade since 1621 CE. δ18O has been increasing at a rate of 0.22 ‰ per decade since 1950 CE (Figure 4). This is consistent with other ice cores from the Antarctic Peninsula, which display an isotopic warming during the late 20th century (Stenni et al., 2017; Thomas et al., 2013 Thomas and Tetzner, 2018), consistent with observations.
Snow accumulation
The amount of snowfall (snow accumulation) per year is determined as the sum of precipitation, sublimation, evaporation, and melt (Thomas et al., 2017). Snow accumulation is measured using the distance between chronological peaks (SO42− and H2O2) and converted to metres of water equivalent per year (m weq yr−1) based on the measured density. The record is corrected for ice thinning and horizontal flow using the Nye model, which assumes thinning is proportional to burial and is appropriate to use in the upper 10%–15% of the ice sheet (Nye, 1963).
The snow accumulation increases from a decadal average of 0.24 m weq yr−1 at the beginning of the record (1621–1630 CE) to a decadal average of 0.38 m weq yr−1 in the final decade (2001–2010 CE). Snowfall has been increasing at a rate of 1.5 cm per decade since 1950 CE (Figure 4). This increase is consistent with other Antarctic Peninsula ice cores (Porter et al., 2016; Thomas et al., 2015) and is part of a regional trend, which began in the ~1920s (Thomas et al., 2015, 2017). Snow accumulation variability in the Antarctica Peninsula is driven by changes in tropical sea surface temperatures, regional sea ice conditions (e.g. Porter et al., 2016; Thomas et al., 2015, 2017) and large scale modes of atmospheric circulation, most notably the SAM (Medley and Thomas, 2019). However, the underlying trend in snow accumulation can also be explained by the observed atmospheric warming (Medley and Thomas, 2019).
Methane
The oldest CH4 measurement corresponds to approximately 1719 CE (±5 years) with a concentration of 645 ± 10 ppb. Concentrations of CH4 increase throughout the record, with a marked acceleration during the 20th century (Figure 4). The concentrations of CH4 have doubled by 1969 CE. The concentration at the lock-in depth (56.8 m) is 1839 ± 10 ppb, which corresponds with modern CH4 concentration in the atmosphere. At the pore close-off depth (62.8 m) the concentration is 1511 ± 10 ppb, which in terms of gas age is approximately 1977 CE. The corresponding concentration in the Law Dome ice core in 1977 CE is 1476 ± 5 ppb (Rubino et al., 2019). The earliest observational monthly data, from air collected in glass flasks at the Palmer Station in Antarctica (Lan et al., 2022) from NOAA Global Monitoring Laboratory, began in January 1983 with a CH4 concentration of 1557 ppb.
Change point analysis identifies two significant changes in the 5-yearly averaged CH4 below the critical depth (1977 CE). The change-points correspond to 1958 and 1883 CE, with probabilities of 99% and 82% respectively. We emphasise that due to the gradual gas trapping and residence time in the atmosphere (9.1 ± 0.9 years, Prather et al., 2012), the CH4 change points cannot be interpreted as an exact year. However, the record suggest that the most significant decadal change detected in the 264-year CH4 record is centred on 1958 (±5 years) CE.
Discussion
The Palmer ice core meets the requirements of a GSSP site. The ice layers are of adequate thickness to support global correlation, with an accurate chronology independently verified using well-dated volcanic horizons. The Agung eruption of 1963 provides a well-dated reference horizon observed in other Antarctic and Greenland ice cores (Sigl et al., 2013) in close proximity to the GSSP depth. The Palmer location is also sensitive to volcanic [SO42−] deposition from South American volcanos, with six [SO42−] peaks in the 20-year window surrounding the GSSP (1952) coincident with dated Chilean eruptions (Figure 3) (Global Volcanism Program, 2022). Snowfall is continuous, with small variations in seasonal deposition (Thomas and Bracegirdle, 2015), ensuring the record is not seasonally biased. The risk of reworking is small, with redistribution of surface snow estimated at just 5% (van Lipzig et al., 2004). The ice layers, and anthropogenic proxy data they contain, are continuous and unaffected by tectonic and sedimentary movements, or metamorphism. For this ice core specifically, the high elevation (1897 m) and southerly latitude (74°S) ensure that the site is not at risk of surface melting. Even under extreme future warming scenarios, the proposed marker for the onset of the Anthropocene is 34.91 m below the surface.
Antarctica is a unique location, governed by the Antarctic Treaty as a continent for peaceful purposes, freedom of scientific investigation and scientific observations and results that shall be exchanged and made freely available. The Protocol on Environmental Protection designated Antarctica as a ‘natural reserve’ in 1998, ensuring that future scientific exploration of the Palmer site is not at risk of exploitation or political changes. The Palmer ice core site is easily accessible by Twin Otter aircraft from several international research stations on the Antarctic Peninsula, and from other Antarctic gateways (e.g. South America, South Africa, New Zealand, and Australia). Thus, despite its remote location, future access for repeat drilling is feasible, achievable, and uniquely protected. The Palmer ice core used in this study is stored at a government funded research facility in the United Kingdom, ensuring safe, long-term storage and accessibility for the public and academics.
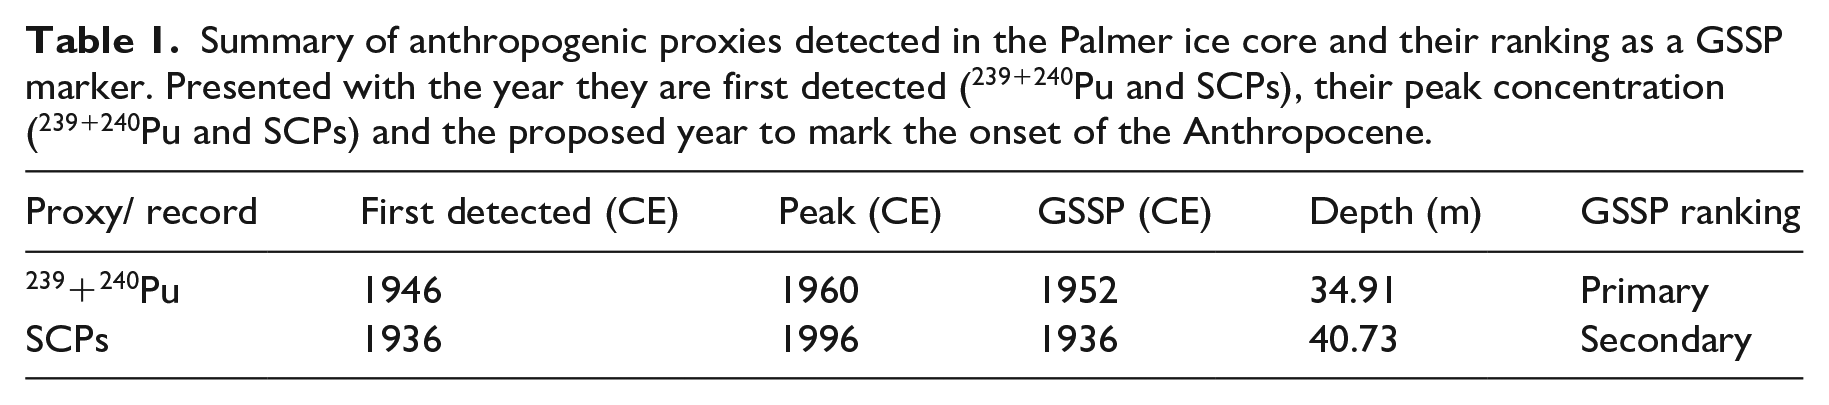
The Palmer ice core provides clear evidence that anthropogenic proxies, in the form of SCPs and radionuclides (Pu), have been deposited in Antarctica. Both proxies have no known natural source but are evident in the Palmer ice core from the mid-20th century onwards. SCPs have been recorded in the records of coastal mainland and sub-Antarctic lakes sediments (Rose et al., 2012), and in near-shore marine sediments (Martins et al., 2010). However, the SCP data presented here are the first for Antarctic ice and demonstrate for the first time that these markers of heavy industry (high temperature combustion) reached this more remote part of the Antarctic continent as early as 1936 CE (Table 1). The most likely source region of these SCPs is the South American or Australian continents, where coal powered energy industry was delayed relative to the United Kingdom and other nations (Rose and Appleby, 2005). However, the low analytical detection and transport mechanisms may also in part explain the delayed appearance relative to other global locations.
Summary of anthropogenic proxies detected in the Palmer ice core and their ranking as a GSSP marker. Presented with the year they are first detected (239+240Pu and SCPs), their peak concentration (239+240Pu and SCPs) and the proposed year to mark the onset of the Anthropocene.
The presence of 239+240Pu in the samples corresponding to 1945/46 CE indicate that even the earliest bomb tests, which began in July 1945 CE, are detected in the Palmer ice core. The earlier tests were fission weapons, with fallout in the lowest layers of the atmosphere (Aarkrog, 2003). Despite the extremely low concentrations, the detection of 239+240Pu cannot be attributed to any natural source or emission scenario. Tropospheric transport of volcanic ash from South American and mid-latitude volcanoes has been observed reaching West Antarctica just 2–3 weeks following an eruption (Koffman et al., 2017). Thus, we hypothesise that Palmer’s location in the Western Antarctic Peninsula, with strong teleconnections with the tropical Pacific (e.g. Thomas et al., 2013), facilitated the tropospheric transport of 239+240Pu to the ice core, making it possible to detect the fall-out from the first explosions in 1945/46 CE (Table 1).
It was not until after 1952 CE, and the first thermonuclear tests, that stratospheric transport was sufficient to produce a global signal detectable at other polar (Arienzo et al., 2016) and mid-latitude ice core sites (Gabrieli et al., 2011, 2013). While ash layers in ice cores can be used to demonstrate rapid tropospheric transport, the sulphate emitted from explosive volcanic eruptions can often take several years to be detected in Antarctic ice (Koffman et al., 2017). This may explain the delayed deposition in of 239+240Pu at other polar and mid-latitude locations. While the first detection of 239+240Pu occurs in 1945/1946 CE, the first recorded peak in values (significantly above the detection limit) corresponds to 1952/53 CE. This is consistent with the first thermonuclear tests and is a globally identifiable feature (Waters et al., 2015).
The highest concentrations of 239+240Pu (1960/61 CE) are coincident with the largest nuclear test (Tsar Bomba) in October 1961 CE. The radioactive debris from such large thermonuclear explosions can remain in the stratosphere for between 15 and 18-months (Zander and Araskog, 1973). Thus, despite the extremely distant source region for this test (Novaya Zemlya, Arctic Russia), the sufficiently long time-window for global stratospheric transport is feasible. This is also supported by other well documented stratospheric transport and deposition of particles and chemical species in the Antarctic ice core record (e.g. volcanic eruptions) (Koffman et al., 2017; Sigl et al., 2013). The brief drop to lower concentrations during years 1963-1967 CE, may reflect the reduction in nuclear testing following the partial test ban treaty in 1963 CE. A sharp decrease in deposition corresponding to 1967 CE has previously been observed in an ice core from the Alps (Gabrieli et al., 2011), demonstrating the sensitivity of the ice core record to detect changes in 239+240Pu emissions. By 1970 CE, the concentrations of 239+240Pu returned to the 1960/61 CE levels, despite most of the testing being moved underground. This may reflect the delayed and ongoing stratospheric 239+240Pu deposition. The analogous stratospheric transport of sulphate aerosols has been documented in the Antarctic ice core record several years after the eruption took place (Koffman et al., 2017). 239+240Pu is still detected as recently as 1990/1991 CE.
Both SCPs and 239+240Pu are distinct markers of the Anthropocene, with no known natural source. The long half-life of 239Pu (24,110 years), together with the high weathering resistance of the SCPs, mean they will both be preserved in the ice as a near-perpetual marker. Thus, the presence of both could be used as a primary stratigraphic marker that defines the lower boundary of the Anthropocene. However, based on the globally synchronous detection of 239+240Pu corresponding to the first thermonuclear tests, we propose that 239+240Pu be the primary marker at this site. The SCPs provide a clear secondary marker for the Palmer GSSP, visible under magnification.
In addition to the clear evidence of Anthropogenic proxies (SCPs and 239+240Pu), the auxiliary climatological records confirm that the Palmer site has experienced significant climate and environmental change since the 1950s. The observed isotopic warming, and positive trend in snow accumulation, since 1950 is consistent with regional observations (e.g. Stenni et al., 2017; Thomas et al., 2017), suggesting warmer atmospheric surface temperatures and increased precipitation. CH4 provides a unique record of past atmospheric conditions that place this proposed GSSP site in a global context. Although produced by a variety of natural processes, the acceleration of CH4 in the atmosphere in recent centuries has been linked to changes in land use, landfills, agricultural activity, industrialisation, and coal mining (Kirschke et al., 2013), the latter directly linked to the SCP record, as a marker for coal combustion. As a more potent greenhouse gas than carbon dioxide, CH4 accounts for more than one-quarter of the radiative imbalance (IPCC, 2013) and plays a major role in driving present and future climate. CH4 does not represent a spike, or a single stratigraphic point, and is thus not proposed as a GSSP marker. However, change point analysis identifies a statistically significant marker centred around 1958 CE (±5 years), which is broadly coincident with the first recorded 239+240Pu peak (1952/1953 CE). Thus, we have included CH4 in this study to provide a unique global context to support this GSSP proposal
To conclude, we propose the Palmer ice core as a candidate for the Global boundary Stratotype Section and Point (GSSP) to mark the onset of the Anthropocene. Based on the first peak in 239+240Pu, our primary marker, we propose that the onset of the Anthropocene was 1952 CE observed at a depth of 34.91 m (Table 1).
While ice cores have been used as previous GSSP sites (Walker et al., 2009), to date, there are no GSSP sites in Antarctica. Thus, if this site is selected as the GSSP for the Anthropocene we propose it be named the ‘Antarctican’. The anthropogenically driven mass loss from the Antarctic ice sheet, observed since the mid-20th century, is predicted to produce 5 cm of global mean sea level rise by 2100 (DeConto et al., 2021). Thus, it seems especially fitting that this new epoch be named for the continent that will arguably play the largest role in governing the planet’s future habitability.
Footnotes
Acknowledgements
Analysis of the Palmer ice core was facilitated by the collaborative research project between the British Antarctic Survey and the Anthropocene Working Group (AWG) to ratify the stratigraphic Anthropocene. We would like to acknowledge the Haus der Kulturen der Welt (HKW, Berlin) for collaborating with the Anthropocene Working Group in the assessment of the candidate GSSP-sites. The collaboration was realised in the framework of HKW’s long-term initiative Anthropocene Curriculum, an international project for experimental forms of Anthropocene research and education developed by HKW and the Max Planck Institute for the History of Science (MPIWG, Berlin) since 2013. We acknowledge the support of Julius Rix, Catrin Thomas, Elsa Benton and the BAS logistics team at Rothera for support in the field. We are grateful of laboratory support provided by Emily Ludlow, Shaun Miller, and James Veale.We thank two anonymous reviewers for their helpful and constructive comments.
Declaration of conflicting interests
The author(s) declared no potential conflicts of interest with respect to the research, authorship, and/or publication of this article.
Funding
The author(s) disclosed receipt of the following financial support for the research, authorship, and/or publication of this article: This work was supported by the Natural Environment Research Council, through British Antarctic Survey core funding, supported by funding from Haus der Kulturen der Welt.
Data availability
The Palmer data is available from the UK Polar Data Centre (UKPDC) https://doi.org/10.5285/b3eca350-79aa-49b2-bd6b-ffee86ad6559, and ![]() .
.