
Abstract
For assessment of the potential of the Beppu Bay sediments as a Global boundary Stratotype Section and Point (GSSP) candidate for the Anthropocene, we have integrated datasets of 99 proxies. The datasets for the sequences date back 100 years for most proxy records and 1300 years for several records. The cumulative number of occurrences of the anthropogenic fingerprint reveal unprecedented increases above the base of the 1953 flood layer at 64.6 cm (1953 CE), which coincides with an initial increase in global fallout of 239Pu+240Pu. The onset of the proliferation of anthropogenic fingerprints was followed by diverse human-associated events, including a rapid increase in percent modern 14C in anchovy scales, changes in nitrogen and carbon cycling as recorded by anchovy δ15N and δ13C, elevated pollution of heavy metals, increased deposition of novel materials (spheroidal carbonaceous particles, microplastics, polychlorinated biphenyls), the occurrence of hypoxia (Re/Mo ratio) and eutrophication (biogenic opal, TOC, TN, diatoms, chlorophyll a), unprecedented microplankton community changes (compositions of carotenoids, diatoms, dinoflagellates), abnormally high spring air temperatures as inferred from diatom fossils, and lithological changes. These lines of evidence indicate that the base of the 1953 layer is the best GSSP level candidate in the stratigraphy at this site.
Introduction
Beppu Bay, Japan (Figure 1), has been a stable tectonic depressional basin for around 0.7 million years (Itoh et al., 2014). The bottom sediments in the deepest area of the innermost bay are covered by anoxic waters, causing restriction of benthic bioturbation and facilitating the formation of fine seasonal laminations in the bottom sediments for the last 2800 years (Kuwae et al., 2013). The sedimentation rates in the deepest area of the bay are relatively high, between 0.3 and 1.2 cm/year (Kuwae et al., 2013), and provide sufficient sample volumes to analyze for diverse proxies with high temporal resolution (annual) using the sediment cores. These sedimentary features allow the proposal of the Anthropocene GSSP level which requires annual time-resolution in proxy records. The sequences also appear to provide high-quality sedimentary records from at least the mid-Holocene (~7300 cal BP) to the present (Takemura, 1995). Earlier studies have reconstructed variation in Japanese sardine and anchovy populations using fossil fish scales and revealed the effects of Pacific-wide decadal-to-centennial climate variability and global climate changes in the late Holocene (Kuwae et al., 2017), as well as explored the use of sedimentary DNA as a means of reconstructing the composition of eukaryotic organisms (Kuwae et al., 2020; Segawa et al., 2022). These lines of geological backgrounds suggest that Beppu Bay sediments are an excellent paleoenvironmental archive.
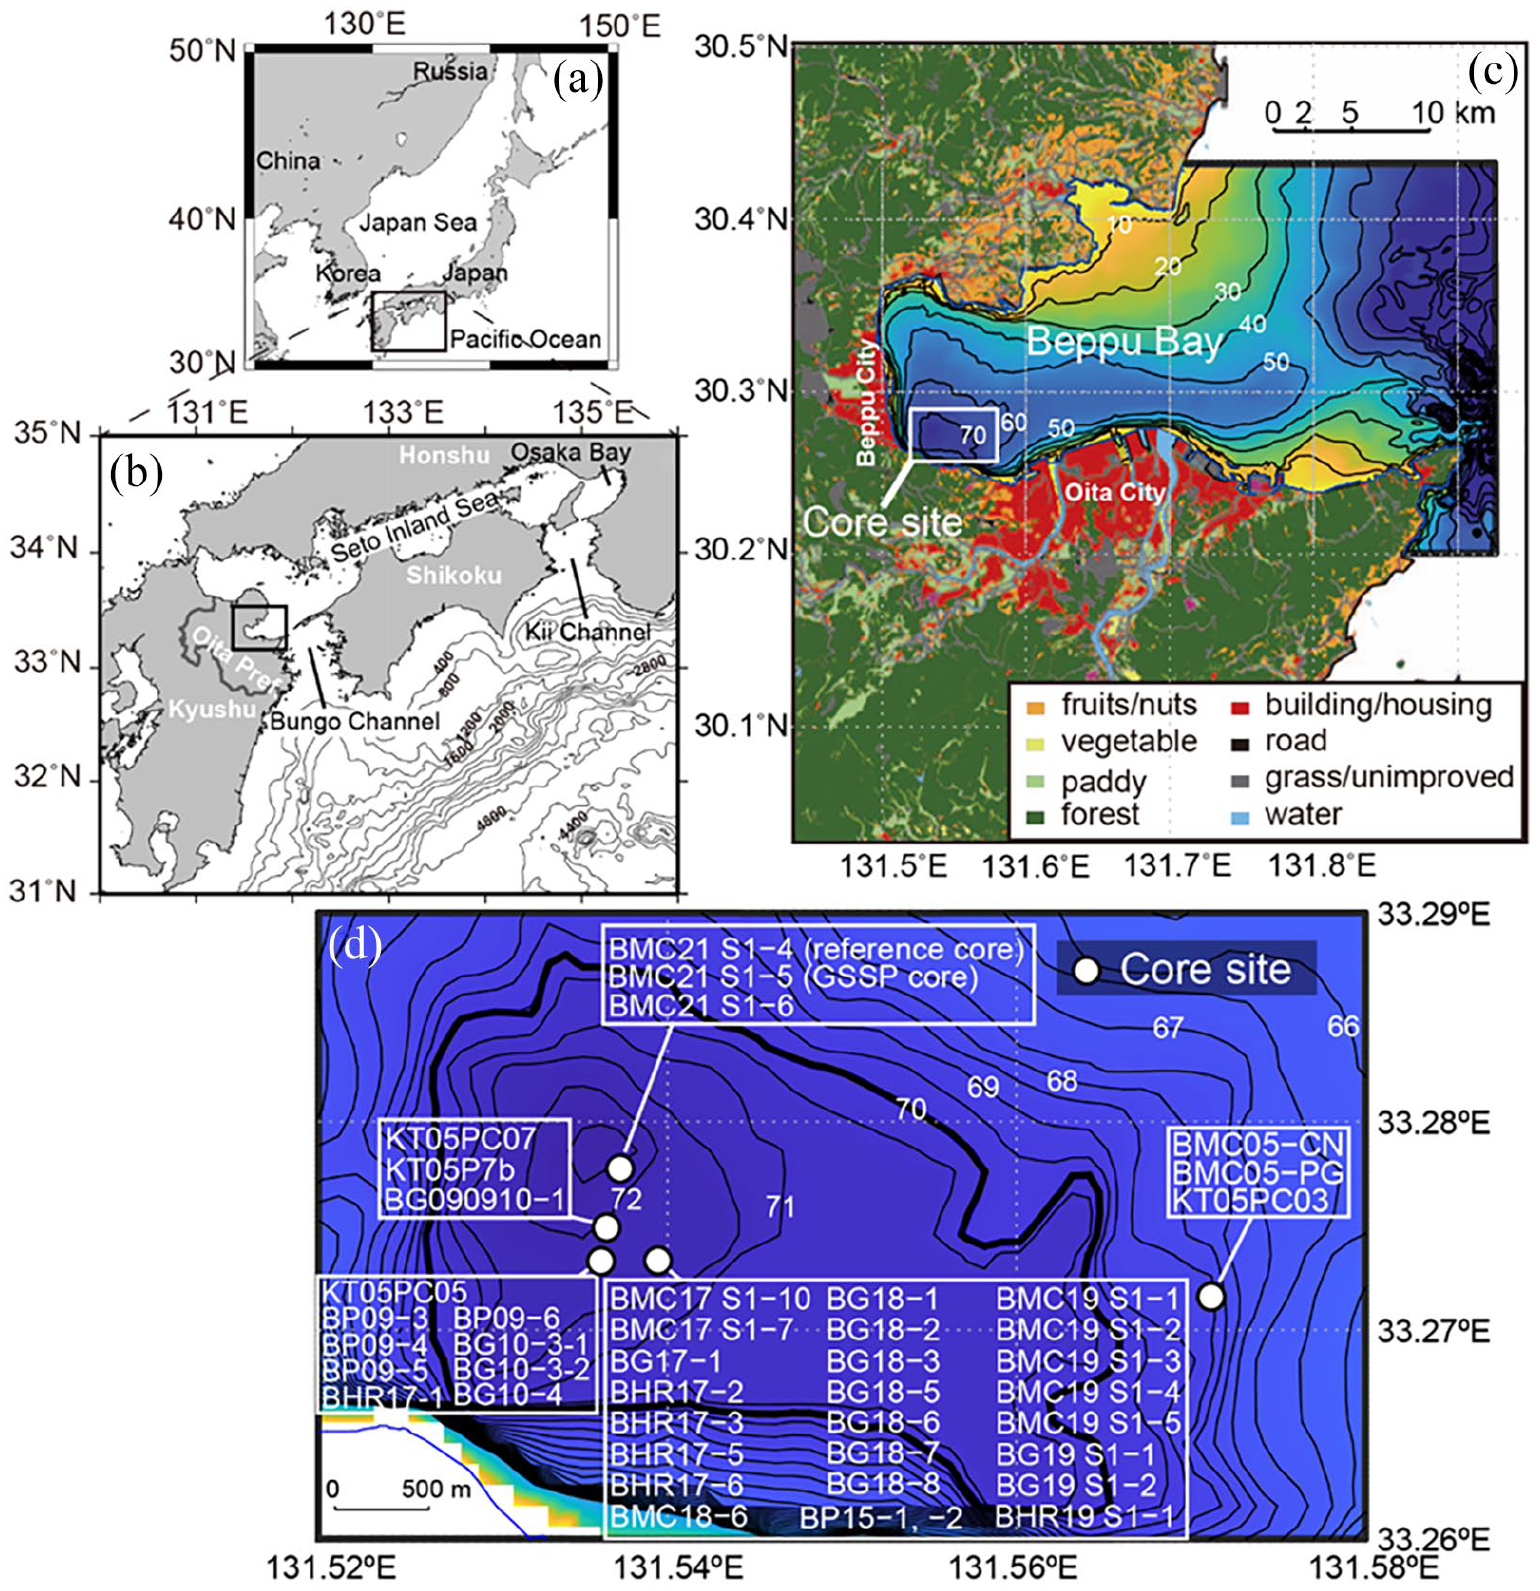
Study area and core sites. (a) study area in Japan, (b) Beppu Bay in the Seto Inland Sea (open black rectangle), (c) the surrounding land use, and (d) the core sites in the open white rectangle in (c). (a and b) from Kuwae et al. (2022a). (c and d) modified from the figure of Kuwae et al. (2022a). GSSP core: BMC21 S1-5; the reference core: BMC21 S1-4. Reproduced in color in online version.
Hominids have inhabited Kyūshū island since the Pleistocene, while Kyūshū itself is the site of the oldest-class Jômon pottery fragments which date to 15,000 cal. BP (Kitagawa, 1994), and the first rice paddy farming by the Yayoi people 2300 years ago (Walker, 2015). Large-scale forest clearance occurred in the catchments around Beppu Bay after 1250 CE in the Kamakura era, with concomitant increases in the use of fertilizer, and construction of shrines and temples (Shimada et al., 2022). After the rapid economic growth in Japan in the mid-20th century, the human population and urban extent of the Oita Prefecture increased abruptly, resulting in formation of one of the major chemical industry districts in Japan, while the city of Beppu grew due to rapid development of spa facilities. Along with a substantial increase in fruit orchards around Beppu Bay, this industrialization and urbanization led to a rise in the amount of pollutants and fertilizers entering the bay, which caused unprecedented eutrophication of the water from the 1960s (Kuwae et al., 2022a).
Diverse sedimentary markers and records of human and environmental change have been developed by the Beppu Bay research project team. These studies demonstrate that sediments record the maximum global fallout of nuclear bomb testing materials in the form of diverse radionuclide records, including 137Cs (Takahashi et al., 2020), 240Pu+239Pu (Yokoyama et al., 2022), 236U/238U (Takahashi et al., 2022), 129I/127I (this study), and 14C (this study). Further, the depth profile of plutonium radio isotopes could serve as a reliable primary marker of the base of the proposed Anthropocene (Yokoyama et al., 2022). Analyses of sediments also record the timing of an initial inclusion of novel materials, such as spheroidal carbonaceous particles (SCPs, aka “fly ash”) (Inoue et al., 2022), polychlorinated biphenyls (PCBs, Takahashi et al., 2020), dichloro-diphenyl-trichloroethane (DDT) (Nishimuta et al., 2021) and brominated flame retardants (BFRs) (Hoang et al., 2021) after the mid 20th century. Each record reflects rapid industrialization of Japan during the Great Acceleration (Steffen et al., 2015), an array of global and near-synchronous signals ~1950 CE, including abrupt changes of socio-economic factors, biophysical processes and consequent environmental and climatic change (see the details in the introductory article to the special issue: Waters et al., 2023).
Increased supply of organic pollutants and nutrients, along with population concentration and agricultural land expansion to the coast, has led to marked marine ecosystem degradation, eutrophication, and hypoxia after 1960—patterns which are recorded in sedimentary sequences from microfossils, inorganic, and biogeochemical proxies (Kuwae et al., 2022a; Matsuoka et al., 2022). By aligning the plentiful regional fingerprints of anthropogenic impact with the primary stratigraphic mark of global human activity, plutonium isotopes, Beppu Bay sediments provide a defensible date and type location for an Anthropocene GSSP.
Here we combine new proxy data with published records of anthropogenic proxies to define the GSSP. New proxies include iodine isotope ratios, 137Cs activities, stable carbon and nitrogen isotope ratios, radiocarbon in fossil fish scales, bulk elemental ratios Re/Mo and Mo/U, lead isotope ratios, and diatom-inferred temperatures. Specifically, we propose use of an inflection point in cumulative rates of change of anthropogenic fingerprints (coincident with the base of the 1953 flood layer named as “1953 HWL” in the following figures) as a definition of the GSSP level, and introduce this interval as the onset of significant impacts on the geological environments by the Great Acceleration. All data in 20th-century strata are reported with varve counting-based chronology to support the chronostratigraphic reliability of the proposed GSSP level. Furthermore, we assess anthropogenic fingerprints to help define the GSSP level, and discuss the merits and demerits of the Beppu Bay site as a candidate for the Anthropocene GSSP.
Materials and methods
Geographic setting of core sites
Beppu Bay is located in Oita Prefecture, the northeast coast of Kyushu, one of Japan’s five main islands (Figure 1). The bay opens onto the Seto Inland Sea located between Kyūshū and two other Japanese islands, Honshū and Shikoku, and is connected to the Pacific Ocean through the Bungo Channel and the Kii Channel. Beppu Bay is bordered by two cities (Figure 1): Beppu, with a population of around 120,000, and Oita, with around 470,000 inhabitants. The Ohno River, the Oita River, and the Asami River drain from catchments of Mounts Aso/Kuju, Yufu, and Tsurumi, respectively, and through the cities before entering the bay (Supplemental Figure 1). These rivers bring terrestrial organic and chemical materials from urban and industrial areas that include several steel, petrochemical, electronics and power plants. There are numerous hot springs in Beppu, which make the city a popular tourist attraction. Orchards have been developed in the northern part of the watershed (Figure 1).
The cores used in this study are collected from the innermost area of Beppu Bay at a depth of 65–72 m (Figure 1 and Table 1). The candidate GSSP core is BMC21 S1-5, which was collected on 21 June, 2021 from the deepest area of Beppu Bay (33.2778°N; 131.5373°E) at a water depth of 71.1 m. Since the latest Quaternary deglaciation, sea level in the Seto Inland Sea rose up to −10 m at 7500 cal BP, and peaked at +1–+2 m at 5000 years ago, followed by a gradual decline to the present (Masuda and Itomoto, 2015).
Descriptions of cores used in this study, including length, latitude/longitude, water depth, a date of core collection, implemented lithological analysis, and analyzed 99 proxies from each core.
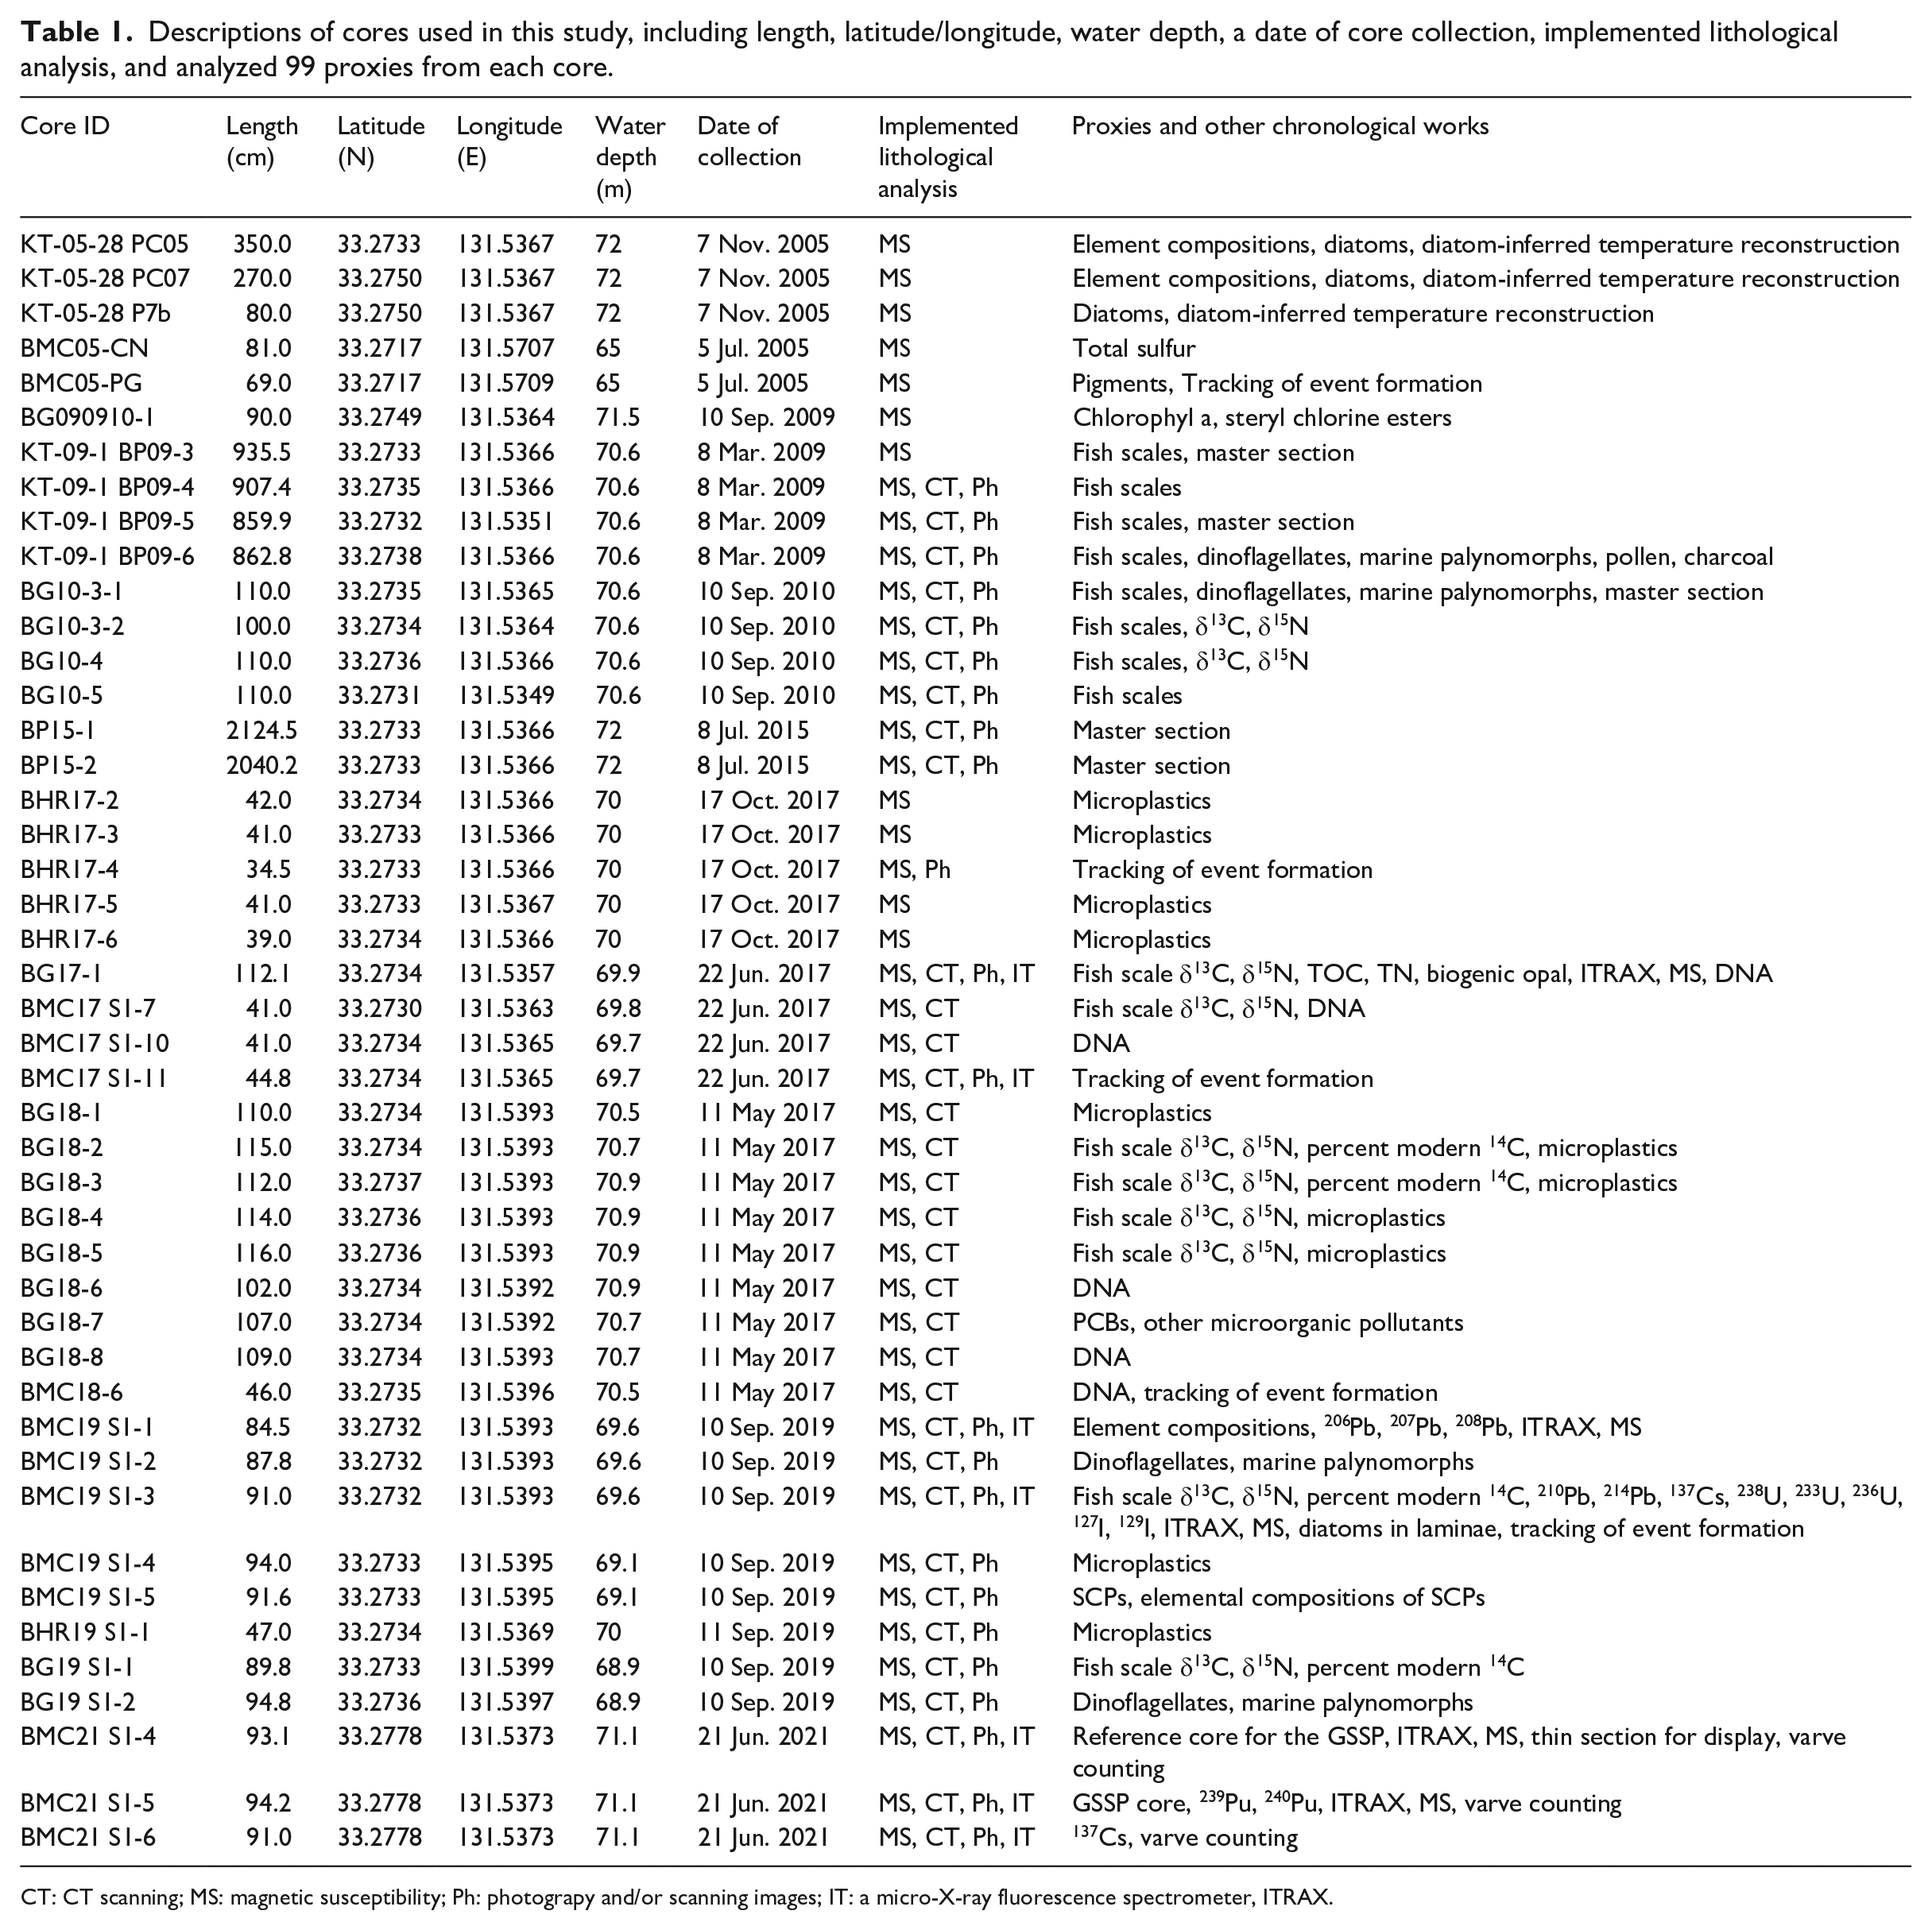
CT: CT scanning; MS: magnetic susceptibility; Ph: photograpy and/or scanning images; IT: a micro-X-ray fluorescence spectrometer, ITRAX.
Core collection, sampling, and imagery
Core BMC21 S1-4, S1-5, and S1-6 were collected using a 120 cm-long multiple corer (Ashura, RIGO Co. Ltd., Saitama, Japan; core ID was denoted as BMC), and were 93.1, 94.2, and 94.2 cm in length, respectively. Because of the best preservation of fine laminations in the older layers dating back to the early 20th century in the deepest area in the bay, BMC21 S1-5 and BMC21 S1-4 are assigned to the reference core and to the sub-reference core, respectively, for the GSSP candidate. For analyzing surface layers, we collected 40 cm-long core samples (e.g. BHR17-2) by using a 50 cm-long HR-type gravity core sampler (model HR, RIGO Co. Ltd, Saitama, Japan; core ID was denoted as BHR). For analyzing deeper layers, we collected 110 cm-long core samples (e.g. BG18-1) with a 120 cm-long gravity corer (model HRL, RIGO Co. Ltd, Saitama, Japan; core ID was denoted as BG). All the cores were kept vertically in the core tubes and transported to a refrigerated (4°C) processing room in the Center for Advanced Marine Core Research (CMCR), Kochi University. Several cores, including BMC21, were stored in lightproof containers with a frozen gel pack inside soon after collection. Four and ten m-long piston cores (e.g. KT-05-28 PC05) were collected during the cruise of R/V Tansei-maru of The University of Tokyo.
To examine internal micro-structures in the strata, split, unsplit, and slab core sections (Supplemental Figure 2) were imaged using a medical X-ray CT scanner (Radix-Pratico, Hitachi Medical Corporation, Tokyo, Japan) at CMCR. In addition, the magnetic susceptibility (MS) of piston, BMC, and BG cores was measured on split samples at 1-cm intervals using a multi-sensor core logger (MSCL-S, GEOTEK Ltd.; sensor, Bartington Instruments Ltd.) at CMCR.
Elemental contents of several cores, including the prospective GSSP core BMC21 S1-5, were measured at 200 or 400 μm intervals using a micro-X-ray fluorescence spectrometer (ITRAX; COX-001, Gothenburg, Sweden) at CMCR.
Depending on the nature of the analyte (e.g. microplastics in BHR17-2 and BG18-1), cores were sectioned vertically in intervals of 1-, 2-, or 5-cm by vertically extruding sediment from the core tube after CT imaging.
The coring site in innermost Beppu Bay is easily accessible using a moderate-sized boat, open to all stratigraphers regardless of nationality, and available for responsible re-sampling by geologists. Local permission including the local fishery cooperative, civil engineering office, port, and security agency and Japanese colleagues are necessary for sampling.
Chronological controls
Identification of event layers
For chronological constructions of all cores, we identified high density, high MS event layers that were formed by floods, high waves, earthquakes, and tsunamis. Previous investigations (e.g. Kuwae et al., 2013) identified major event layers of >1 cm thickness (Event [Ev] 0, 1, 2, 3, etc.), and minor event layers of <1 cm thickness (Ev 0a, 0b, etc.) based on visual inspection, CT images, and MS data of the cores (Supplemental Figure 3). In this study, we further identified event layers for the upper portion of the stratigraphy (above Ev 0a) from visual inspections of the high-resolution images, CT 2D or 3D images of cores BMC21 S1-5 and BMC21 S1-4 (Supplementary high-resolution photos). Event ID for chronological controls is listed in Supplemental Table 1.
Layer counting for varve chronology
For chronology of the uppermost layers (above Ev 0a), we used varve counting-based chronology (thereafter, varve chronology). Identification of an annual layer was based on color of laminae in the high-resolution photo images together with density analysis of CT images of cores BMC21 S1-5 and BMC21 S1-4 (Supplementary high-resolution photos). A typical annual varve included a high-density, pale lamina and a low-density dark color layer (see Results). High-density event layers as well as low-density massive event layers were omitted for the counting process. To reduce counting errors due to erosion beneath individual event layers, event ages were set in advance to those of corresponding historical events within age errors derived from a CRS age model. Markers included effects of three high wave events (HWV) from typhoons (1964, 1993, 2005 CE; Hinata et al., 2023), earthquakes or tsunamis (Ev -1a, Hyuga-nada earthquake; Kuwae et al., 2022a, 2022b), and 13 floods resulting in high water levels (HWL) observed in the Oita River and the Ohno River and thick massive sediment layers (1953, 1959, 1982 CE). Corresponding event layer ID is reported as 1964 HWV, 1993 HWV (same as Ev -1b), and 2005 HWV (same as Ev -1cL) for the high wave events and as 1953 HWL, 1959 HWL, and 1982 HWL for flood events (Figure 2). The HWV event layers can be identified by an inclusion of sands, and the earthquake event -1a, by an inclusion of gravels (maximum clast size: 30 mm). Detailed identifications of turbidite layers corresponding to historical high waves, floods, and earthquakes are described in the Supplemental Materials. Identification of the thick massive layers (HWL event layers) is described later because of their importance for determining the proposed GSSP level (Figure 2). Plutonium and uranium isotope signatures were not used as chronological markers but instead were applied to check the consistency between the age model and the known age of elemental deposition maxima.
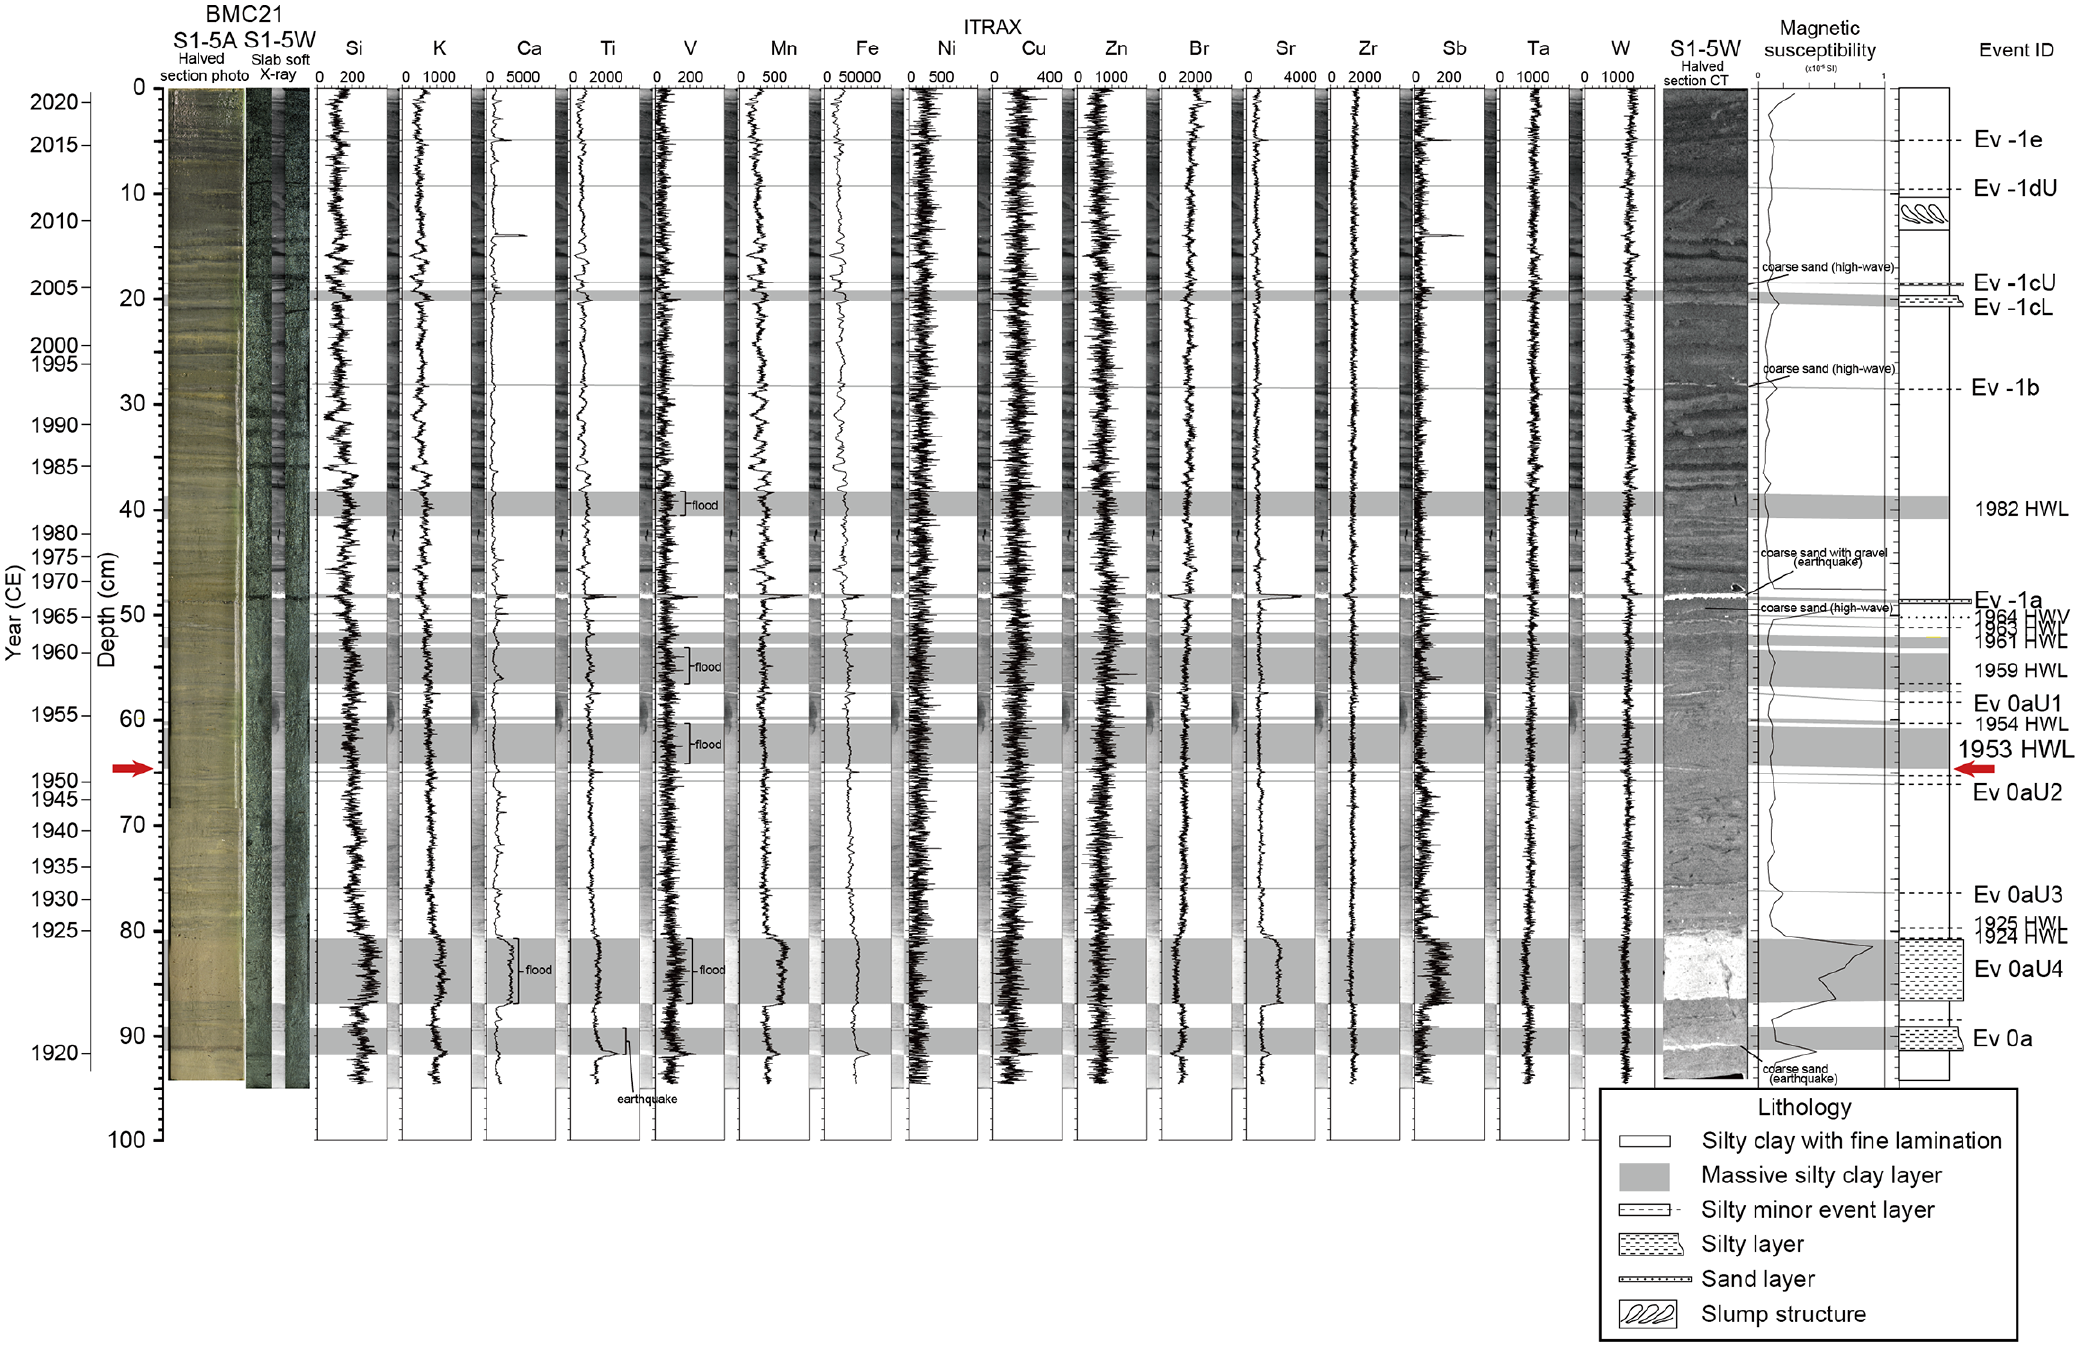
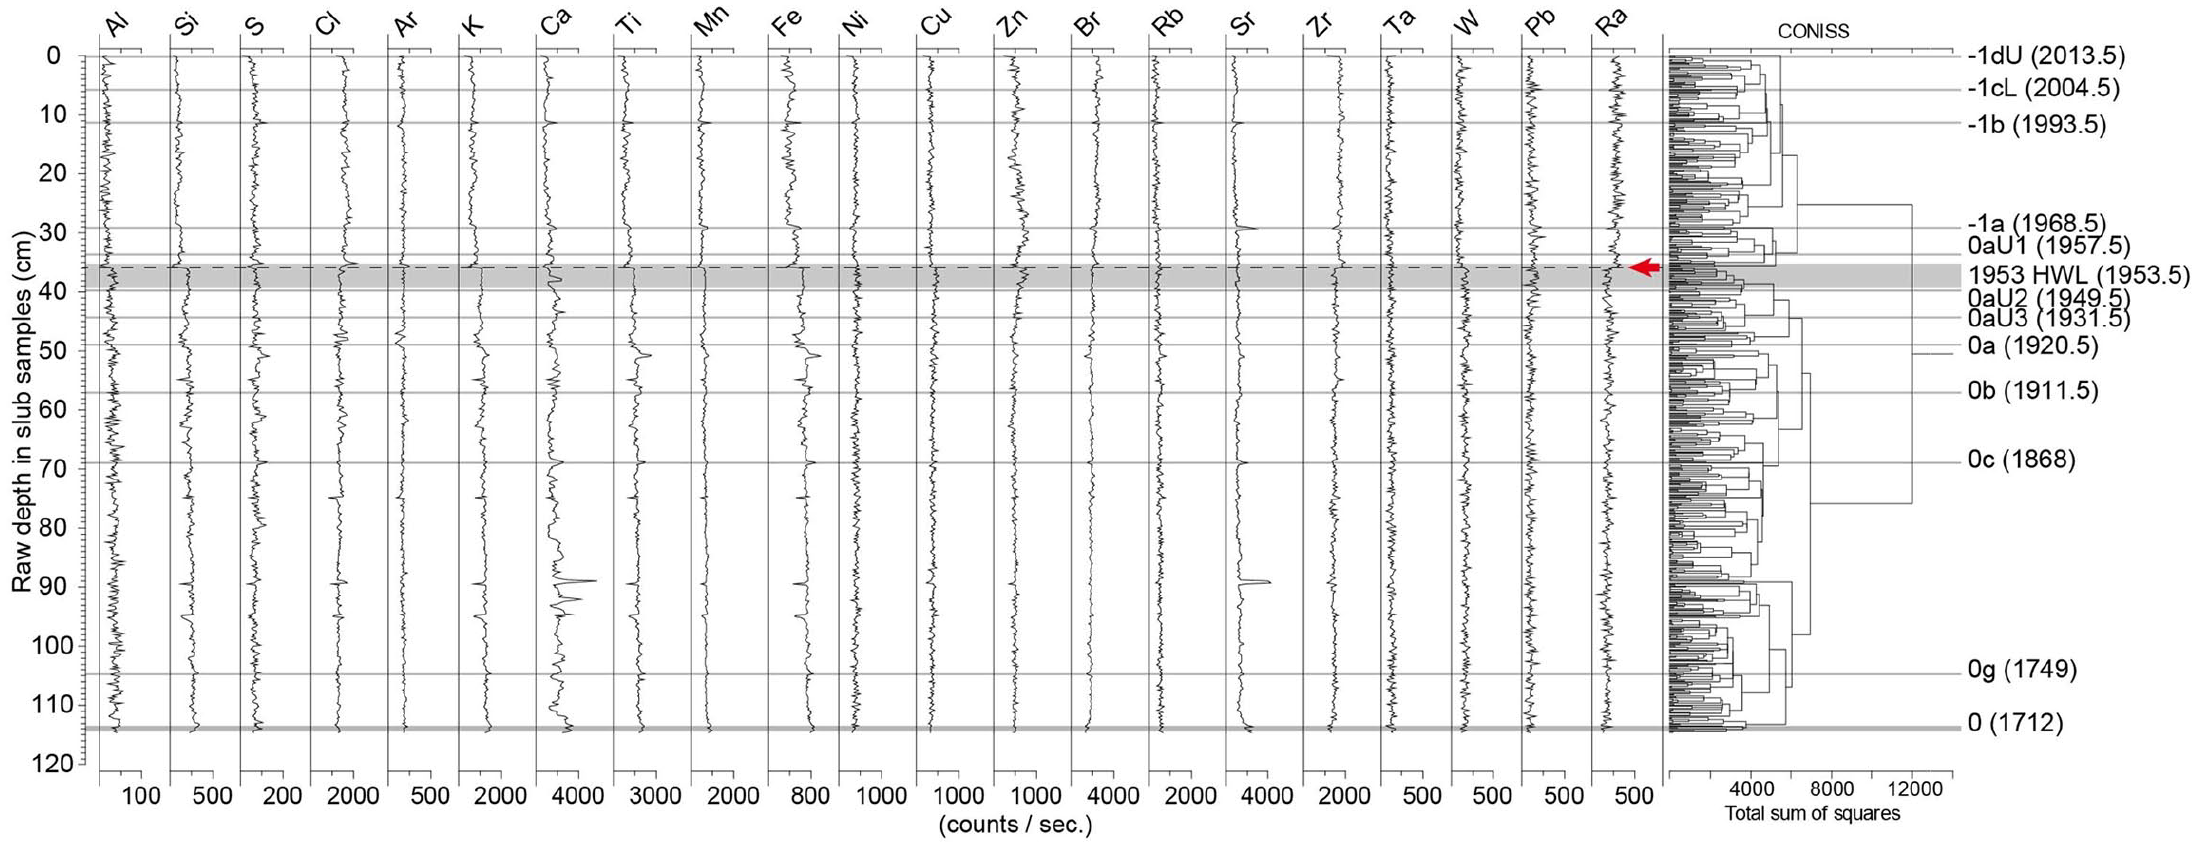
Sediment core photo, ITRAX soft X-ray image, ITRAX-derived element contents, CT, magnetic susceptibility and lithology for core BMC21 S1-5. Scale of each element content is expressed by counts/sec. Dark and light colors for CT images represent low and high density, respectively. Age scale on y-axis was based on the varve counting chronology. Gray line and shade denote thin and thick event layers. For Event ID, HWV: high wave event, HWL: high water level event in the Oita and Ohno River. Red arrow denotes the proposed GSSP level. Reproduced in color in online version.
For chronology of the deeper layers below Ev 0, ages for sample depths were obtained based on event ages reported in Kuwae et al. (2013) and linear interpolation of the ages and the depths of two successive event layers. Sample ages between the levels of Ev 0a and Ev 0 were obtained based on linear interpolation of the ages and depths of the events.
Composite depth
Not all the records addressed here were from the GSSP core, but from other cores with different depth scales because of variability in thicknesses of annual layers, turbidite layers, and in some cases slumps. For the purpose of viewing stratigraphic positions of chronological constraints and detected anthropogenic signatures on a common depth scale, we constructed composite depth. We defined “composite depth” (CD) as the depth scale of a simple stack of master sections: the uppermost master section is from the core top to the base of the Event 0a in BMC21 S1-5, with; the second master section, from the base of Ev. 0a to the base of Ev. 0 in BG10-3-1, and; the third master section, if present, which is made up of lower sections in other cores like BP09-3 (see Supplemental Figure 4). Each of the sections is bordered by two event layers that serve as contemporaneous horizons between each core and the master core and best preserves the most original facies among the cores. All the cores were then converted from raw depth (RD) in centimeters (cm rd) to CD (cm cd) based on the event layer correlations and linear interpolation between the RD and CD of two successive event layers (see detail in “Construction of CD and EFD” in the Supplemental Materials).
210Pb chronology
Dry samples for 210Pb, 214Pb, and 137Cs analyses were collected at 2- to 12-cm intervals in core BMC19 S1-3 (Takahashi et al., 2020). Radioactivities were determined by gamma spectroscopy using a germanium detector (GXM25P, EG&G ORTEC, Tokyo, Japan) equipped with a multichannel analyzer (MCA7700, SEIKO EG&G, Tokyo, Japan) at CMES. The Radioactivity Standard Gamma Volume Source Set from the Japanese Radioisotope Association was used as a reference standard. Core chronology for the core BMC19 S1-3 was determined using the constant rate of supply (CRS) calculation of 210Pb based on 210Pbexcess inventory (Appleby and Oldfield, 1978).
Calculation of flux rates
Sedimentation rates and sediment mass accumulation rates of BMC21 S1-5 were determined from varve chronology and thickness or mass per unit area of each layer. Lamina thicknesses were measured from the master photograph of the split core. Mass per unit area of a layer was calculated from the difference of mass depths of the top and base of an individual layer, which were estimated from linear interpolation of the mass depths of 1-cm intervals. Mass depths were obtained from cumulative values of dry bulk density measured at 1-cm intervals.
Anthropocene proxies
We analyzed 99 proxies (Table 2), most of which have been published. This section describes brief methods only for the new data provided in this study. The full methodology of the sampling and the analysis are described in the Supplemental Materials.
Anthropogenic markers analyzed.
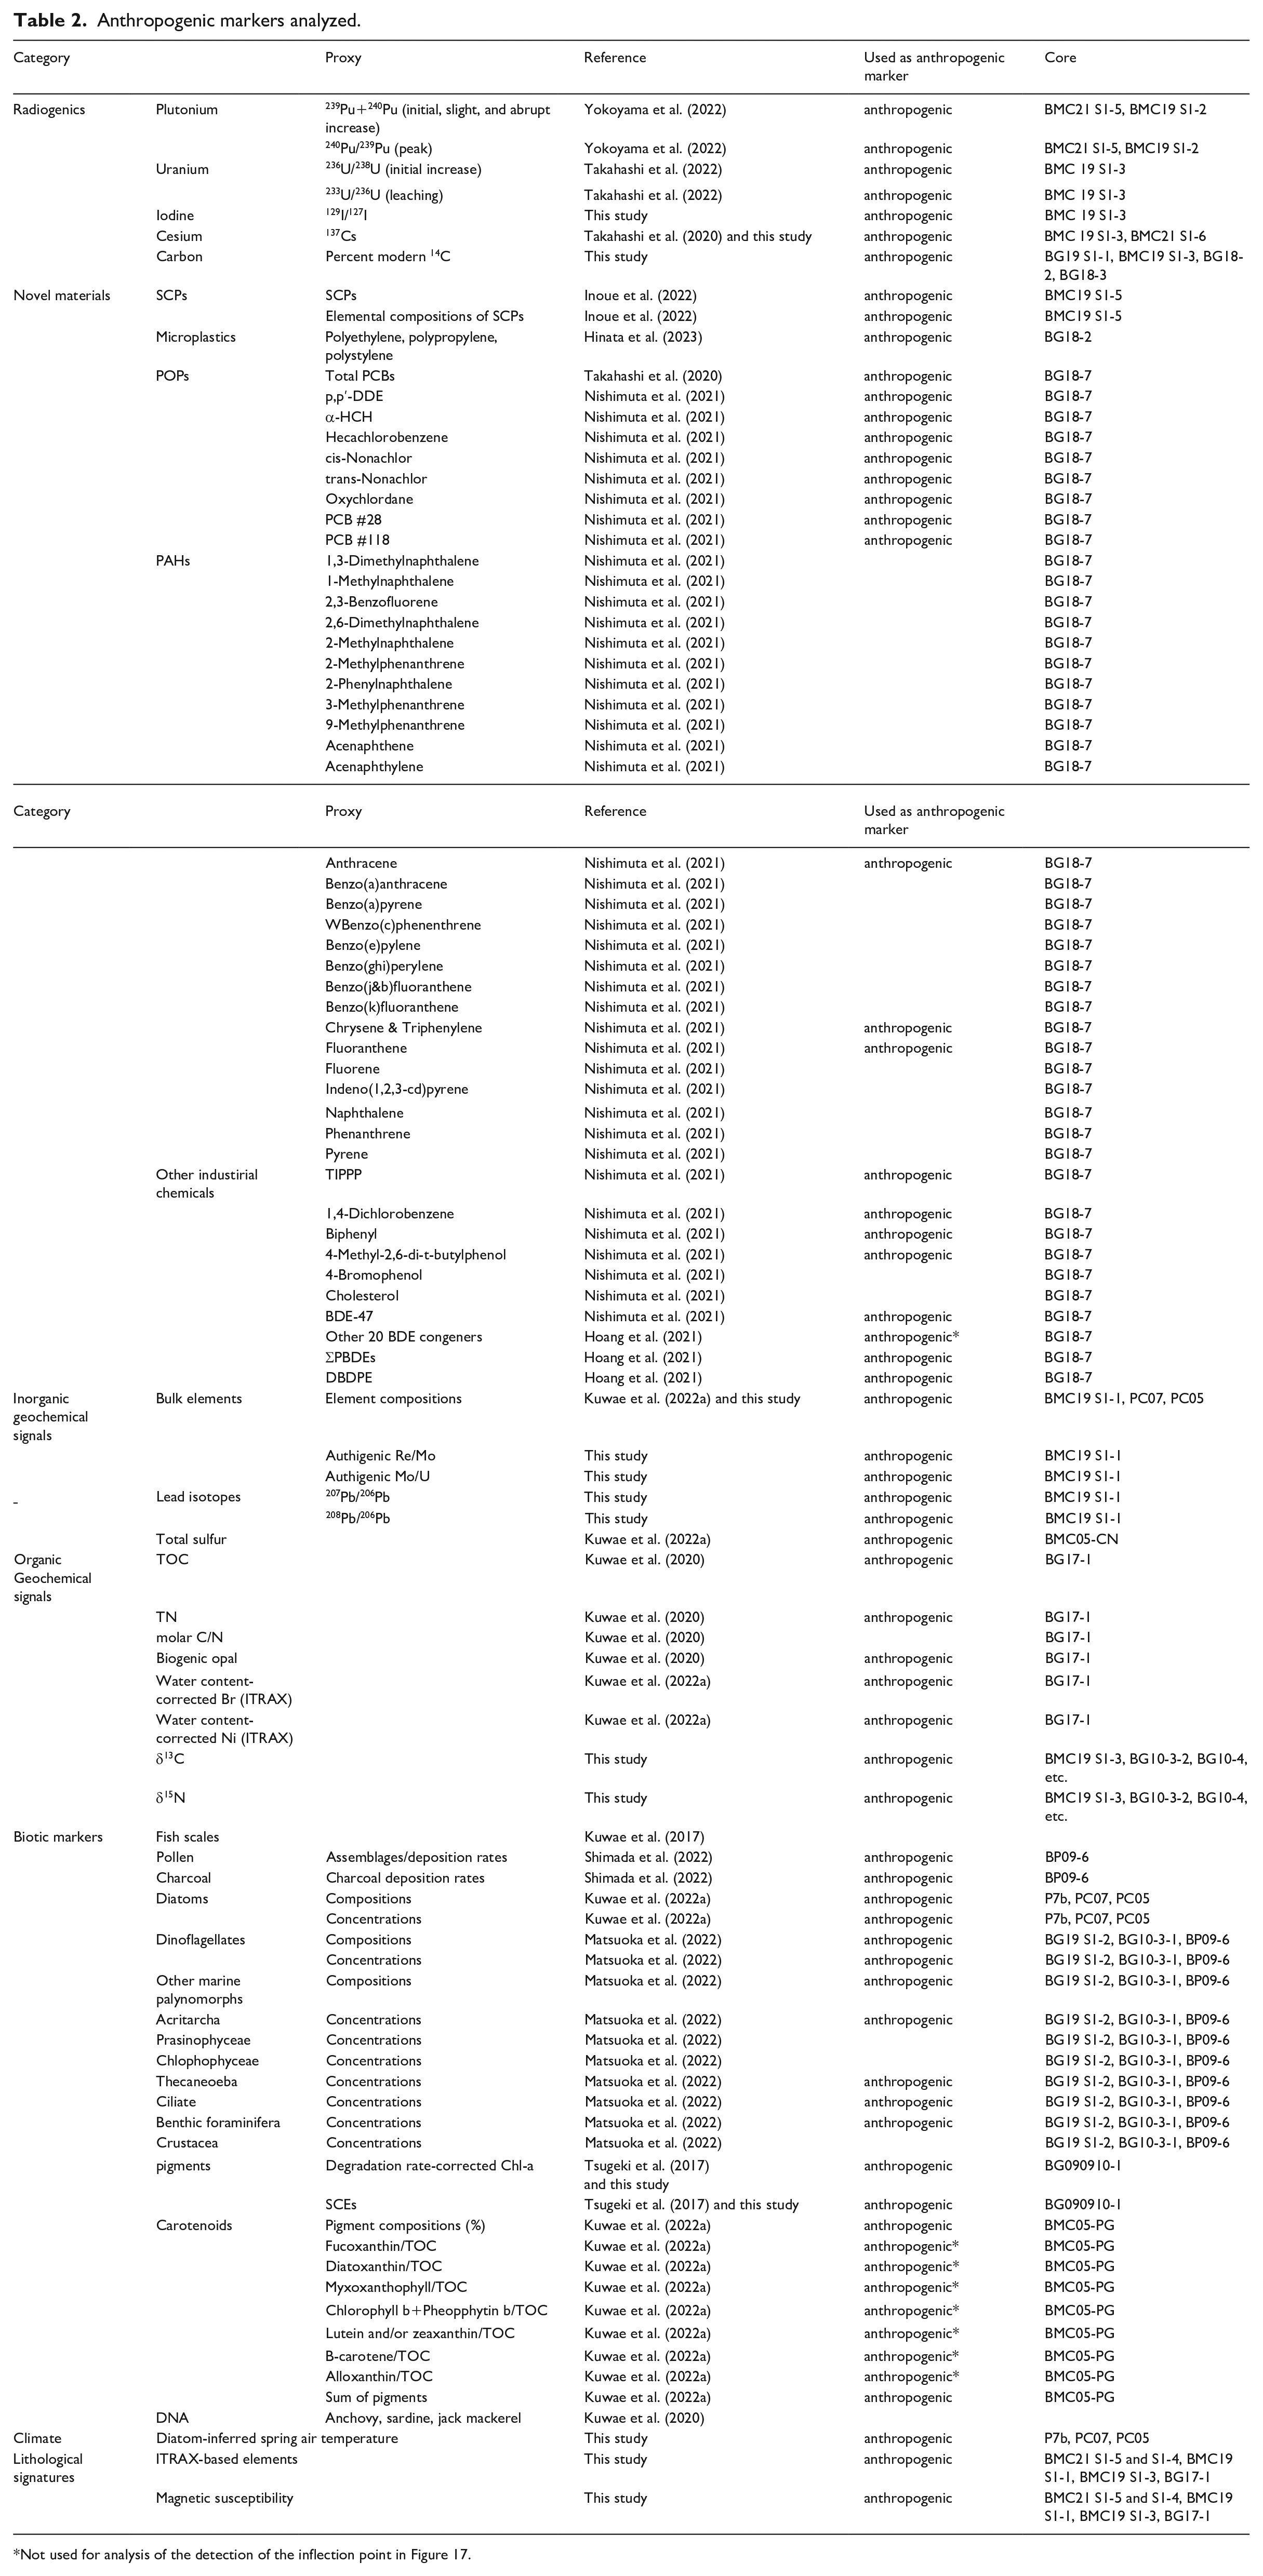
Not used for analysis of the detection of the inflection point in Figure 17.
Iodine radioisotopes
Iodine (127I) concentration in core BMC19 S1-3 was analyzed using an inductively coupled plasma mass spectrometer (ICP-MS) (Agilent 7700), with 185Re as an internal standard, after appropriate pretreatments of sediments reported by Ueda et al. (2018). Measurements using AMS of the 129I/127I isotopic ratios were also performed for the samples at the University of Tsukuba Tandem Accelerator Complex. S-Purdue (Z95-0597: 129I/127I ratio of 8.378 × 10⁻¹²), a reference material, was measured as a standard for normalization of the obtained values for 129I/127I ratios.
Cesium-137
Additional measurements of 137Cs were performed using sediment samples of core BMC19 S1-3 with higher-resolution than that given by Takahashi et al. (2020). In addition, 14 samples from BMC21 S1-6 were analyzed. All analytical procedures were the same as previously mentioned.
Carbon-14
Fish scales from sediment cores, BG19 S1-1, BMC 19 S1-3, BG18-1, and BG18-3 were extracted by washing a wet sediment sample over a 500 μm-mesh sieve. Ten to twenty anchovy fish scales were cleaned under a dissecting microscope to remove stains on/in the scales, dried, and rinsed with dichloromethane. Scale samples were acidified to remove carbonates, and cleaned with purified water. Freeze-dried scale samples were introduced into the elemental analyzer (vario ISOTOPE select, elementar), combusted, and separated into CO2 gas. By a hand-made automated graphitization system in The University Museum, The University of Tokyo, the CO2 was then reduced using 4.0 mg of Fe with high purity hydrogen gas, producing 100 µgC AMS target material (Fe3C). Measurements of 14C as well as δ13C for correction of the isotopic fractionation were performed by AMS in the museum. Data were reported as percent modern 14C (%).
Stable carbon and nitrogen isotope ratios
Fish scales were recovered from wet core samples (BG10-3-2, BG10-4, BMC17 S1-7, BG17-1, BG18-2, 3, 4, and 5, BMC19 S1-3, BG19 S1-1) that had been sliced vertically at 1-cm or 2-cm intervals, and washed onto a 500-μm-mesh sieve. Scales were identified and stains on them were removed under a dissecting microscope. Acid-washed (1 M HCl) samples were combusted in a Costech 4010 HCNS elemental analyzer at the Stable Isotope Laboratory at Idaho State University to determine the TOC and total nitrogen (TN) concentrations. The analyzer was coupled with a Finnigan Deltaplus Advantage isotope ratio mass spectrometer at the Stable Isotope Laboratory at Idaho State University for δ13C and δ15N measurements. Replicate measurements of internal δ13C and δ15N standards yielded 1σ standard deviations of 0.19‰ and 0.20‰, respectively.
Element analysis by XRF core scanner
Elemental content of cores BG17-1, BMC19 S1-3, BMC21 S1-4 and BMC21 S1-5 was analyzed using a micro-X-ray fluorescence spectrometry core scanner (ITRAX, COX Analytical Systems) (Rothwell and Croudace, 2015) at CMCR. We reported raw counts of elemental contents (counts/sec) for detecting anthropogenic events. For marine biological proxies, including Br and Ni, we also reported water content-corrected element contents calculated by the ln-ratio of the element counts second−1 with a Geometric mean of counts second−1 of all high-precision elements (Weltje et al., 2015). For quantification of elemental contents with high precision, core BMC19 S1-1 was analyzed by ITRAX in the National Institute of Advanced Industrial Science and Technology (AIST) with longer exposure time (100 seconds) and shorter step size (200 μm).
Bulk element and stable lead isotope analysis
Sediment digestion followed the methods of Amano et al. (2011). About 0.1 g sediment sample from core BMC19 S1-1 was treated with HNO3 and HF and heated with a microwave (Ethos Easy, Milestone S.r.l., Sorisole, BG, Italy). To remove HF, solutions of digested sediment were evaporated by heating with a microwave. The residue was dissolved in HNO3 and diluted with ultrapure water. Concentrations of metals were measured by ICP-MS (Agilent 7800, Agilent Technologies, Inc., Santa Clara, CA, United States) using Rh as an internal standard. Heat vaporization atomic absorption spectrometry (HV-AAS) was used to detect Hg in the sediment samples directly. Analytical accuracy was confirmed by analyzing standard reference material (NMIJ CRM 7302-a Trace Elements in Marine Sediment) provided by the National Metrology Institute of Japan (NMIJ), AIST. The recoveries of metals were in the range of 78%–108% of the certified values. Similar methods were used for bulk elemental analysis of deeper samples obtained from cores KT-05-28, PC03 and PC05.
To investigate changes in oxidation-reduction (redox) conditions, we used the Re/Mo ratio and Mo/U ratio as proxies of reducing conditions on the sea floor (Salvatteci et al., 2016). As turbidites are likely composed mainly of terrestrial detrital materials, they were used as an appropriate representation of the detrital background of the Beppu Bay sediments and could be used to estimate the authigenic concentration of each trace element. The trace elements to aluminum mass ratios in the event layer 0a from core BMC 19 S1-1 are as follows: Re/Al = 1.1 × 10⁻⁶, Mo/Al = 0.00037, and U/Al = 0.00028. Then, the fraction of detrital metal X of a sample was calculated as: Xdetrital = (X/Al)Ev0a × Alsample. Finally, the authigenic fraction of element X in a sample was calculated as Xtotal – Xdetrital.
For Pb isotopic ratios, 207Pb/206Pb and 208Pb/206Pb were determined with an ICP-MS using 1000 scans per measurement and 30 seconds integration time. The obtained isotopic ratios were normalized by comparison with NMIJ CRM 3681-a Lead Isotopic Standard Solution (NMIJ, AIST, Tsukuba, Japan). The relative standard deviation of measurements was less than 0.001%.
Air temperature reconstructions using the transfer function of diatom assemblage-temperature
Oita meteorological observatory have recorded temperatures and precipitation from 1889 CE, and Oita Prefectural Agriculture, Forestry and Fisheries Research Center have conducted the stationary oceanographic observations from 1972 CE. Using the dataset of the diatom species compositions in the cores KT-05-28 P7b, PC07, and PC05 (data from Kuwae et al., 2022a) and environmental variables, weighted averaging (WA) regression and calibration techniques were used to calculate diatom species optima and tolerances as well as to develop and test diatom inference models for air temperature. The models were developed using the program C2, version 1.7.7 (Juggins, 2003).
Chlorophyll a and steryl chlorine esters
Concentrations of fossil pigments in core BG090910-1 were quantified by high-performance liquid chromatography (HPLC) following (Tani et al., 2009). The pigments were collected by three time-extraction by acetone from the frozen sediments. The combined extract was purified with an aqueous solution of NaCl followed by evaporation to dryness under N2. The purified residue was dissolved in acetone together with an internal standard, mesoporphyrin IX dimethyl ester (Sigma–Aldrich, St. Louis, MO, USA), and analyzed by HPLC (LC-10AD, Shimadzu, Kyoto, Japan) using a photodiode array detector (SPD-M10AVP, Shimadzu). The pigments analyzed in this study were chlorophyll a, its derivatives, and steryl chlorine esters (SCEs) which is a biomarker of zooplankton biomasses (Kuwae et al., 2022b). The sum of chlorophyll a and its derivatives (pheophytin a, pyropheophytin a, and “pheophorbide a”) is denoted here “Chl-a.”
Numerical analysis
To detect levels of major changes in compositions of species (diatoms, pollen, pigments, and elements, etc.), stratigraphically constrained cluster analysis was conducted using the Tilia ver. 1.7.16 program (Grimm, 1987) using the incremental sum-of-squares method. Dissimiliarity coefficients were based on standardized Euclidean distances for concentration data or Edwards & Cavali-Sforza’s distance for relative (%) percentage data. The data were standardized to a mean of 0 and a standard deviation (SD) of 1 for concentrations (e.g. bulk elements) or square-root transformed for percentages (e.g. diatom species) prior to analysis. The percentage data of species with values greater than 3% in at least one sample were used for the cluster analysis.
Results
We report most of the data using a raw depth scale, but for some data covering longer timeseries we use a composite depth scale combining Ashura, gravity, and piston cores.
Lithology and seasonal laminae
The cross-section of the core sample showed most laminations consisted of a dark-colored layer, a light-colored layer, and a brownish black-colored layer (Supplemental Figure 6). Overall, colors became relatively lighter downcore (Supplemental Figure L7). Dark (black and olive black) layers exhibited relatively low density, whereas light layers were of higher density (Supplemental Figure 6). Notably high-density layers (white on the CT images), that is, event layers, were brownish black/gray with low saturation, whereas the normally-deposited sediments are light olive gray, olive black, or black; therefore, the event layers can be distinguished by color (Supplemental Figure 6). Elemental analysis shows that the dense, light-colored layers had relatively high concentrations of clastic elements such as K, Ca, Ti, Mn, and Fe, and relatively low concentrations of Br (Supplemental Figure 5), which had abundant organic matter. Dark layers showed the opposite tendency. The event layers (-1cL, -1b, -1a, etc.) with notably high density showed prominent peaks in clastic elements; V also showed the same pattern in content as the clastic elements and was relatively higher in the turbidite layer 0aU4 (e.g. 80.8–86.8 cm rd in BMC21 S1-5) than in the preceding and following layers (Figure 2 and Supplemental Figure 5). This layer may be attributed to a flood event, as stripe-like structures were recognized as internal structures.
Vanadium was also abundant in slightly dense massive layers, 60.8–64.6 cm (59.2–62.4 cm in core BMC21 S1-4, 1953 HWL), 53.6–57.2 cm (52.4–55.9 cm in core BMC21 S1-4, 1959 HWL), 38.6–41.0 cm (336.1–40.0 cm in core BMC21 S1-4, 1982 HWL). These layers showed multiple spikes of high V content in the massive layer (Figure 2 and Supplemental Figure 5 for BMC 21 S1-4). These massive layers showed slight disturbance of the internal structures, and CT 3D observations recorded no bioturbation along them, possibly indicating that the structures were formed during deposition. Taken together, we infer that the massive layers were not normally-deposited sediments, but were instead flood-derived materials. Such massive layers can be clearly correlated laterally within Beppu Bay (Supplemental Figure 7). In particular, the massive layer at 60.8–64.6 cm in BMC21 S1-5 (1953 HWL) was characterized as thicker than the other recent similar layers.
Analysis of diatom composition within sets of laminae (Supplemental Figures 8 and 9) demonstrated that winter diatom species were abundant within pale/high-density layers, most likely formed in winter, while winter diatom species were fewer in the dark-colored/low-density and the high-density laminae, likely deposited during summer and fall (Supplemental Figure 10). Together, these patterns suggest that an annual varve couple is composed of a pale/high-density layer combined with a dark-colored/low-density lamina.
Varve chronology
The varve counting-based age model for core BMC21 S1-5 showed that event ages were within age errors obtained by 210Pb-derived chronological models for core BMC19 S1-3 (Figure 3) (Takahashi et al., 2020). Results of varve counting showed that ~cm-thick massive layers with low density occurring at 60.8–64.6, 53.6–57.2, and 38.6–41.0 cm in core BMC 21 S1-5 corresponded to flood events in 1953 (the 10th highest water level in Ohno, the highest in the Oita River), 1959 (the seventh highest in the Ohno River), and 1982 (the 25–38th highest in the Ohno River) (Supplemental Table 1).
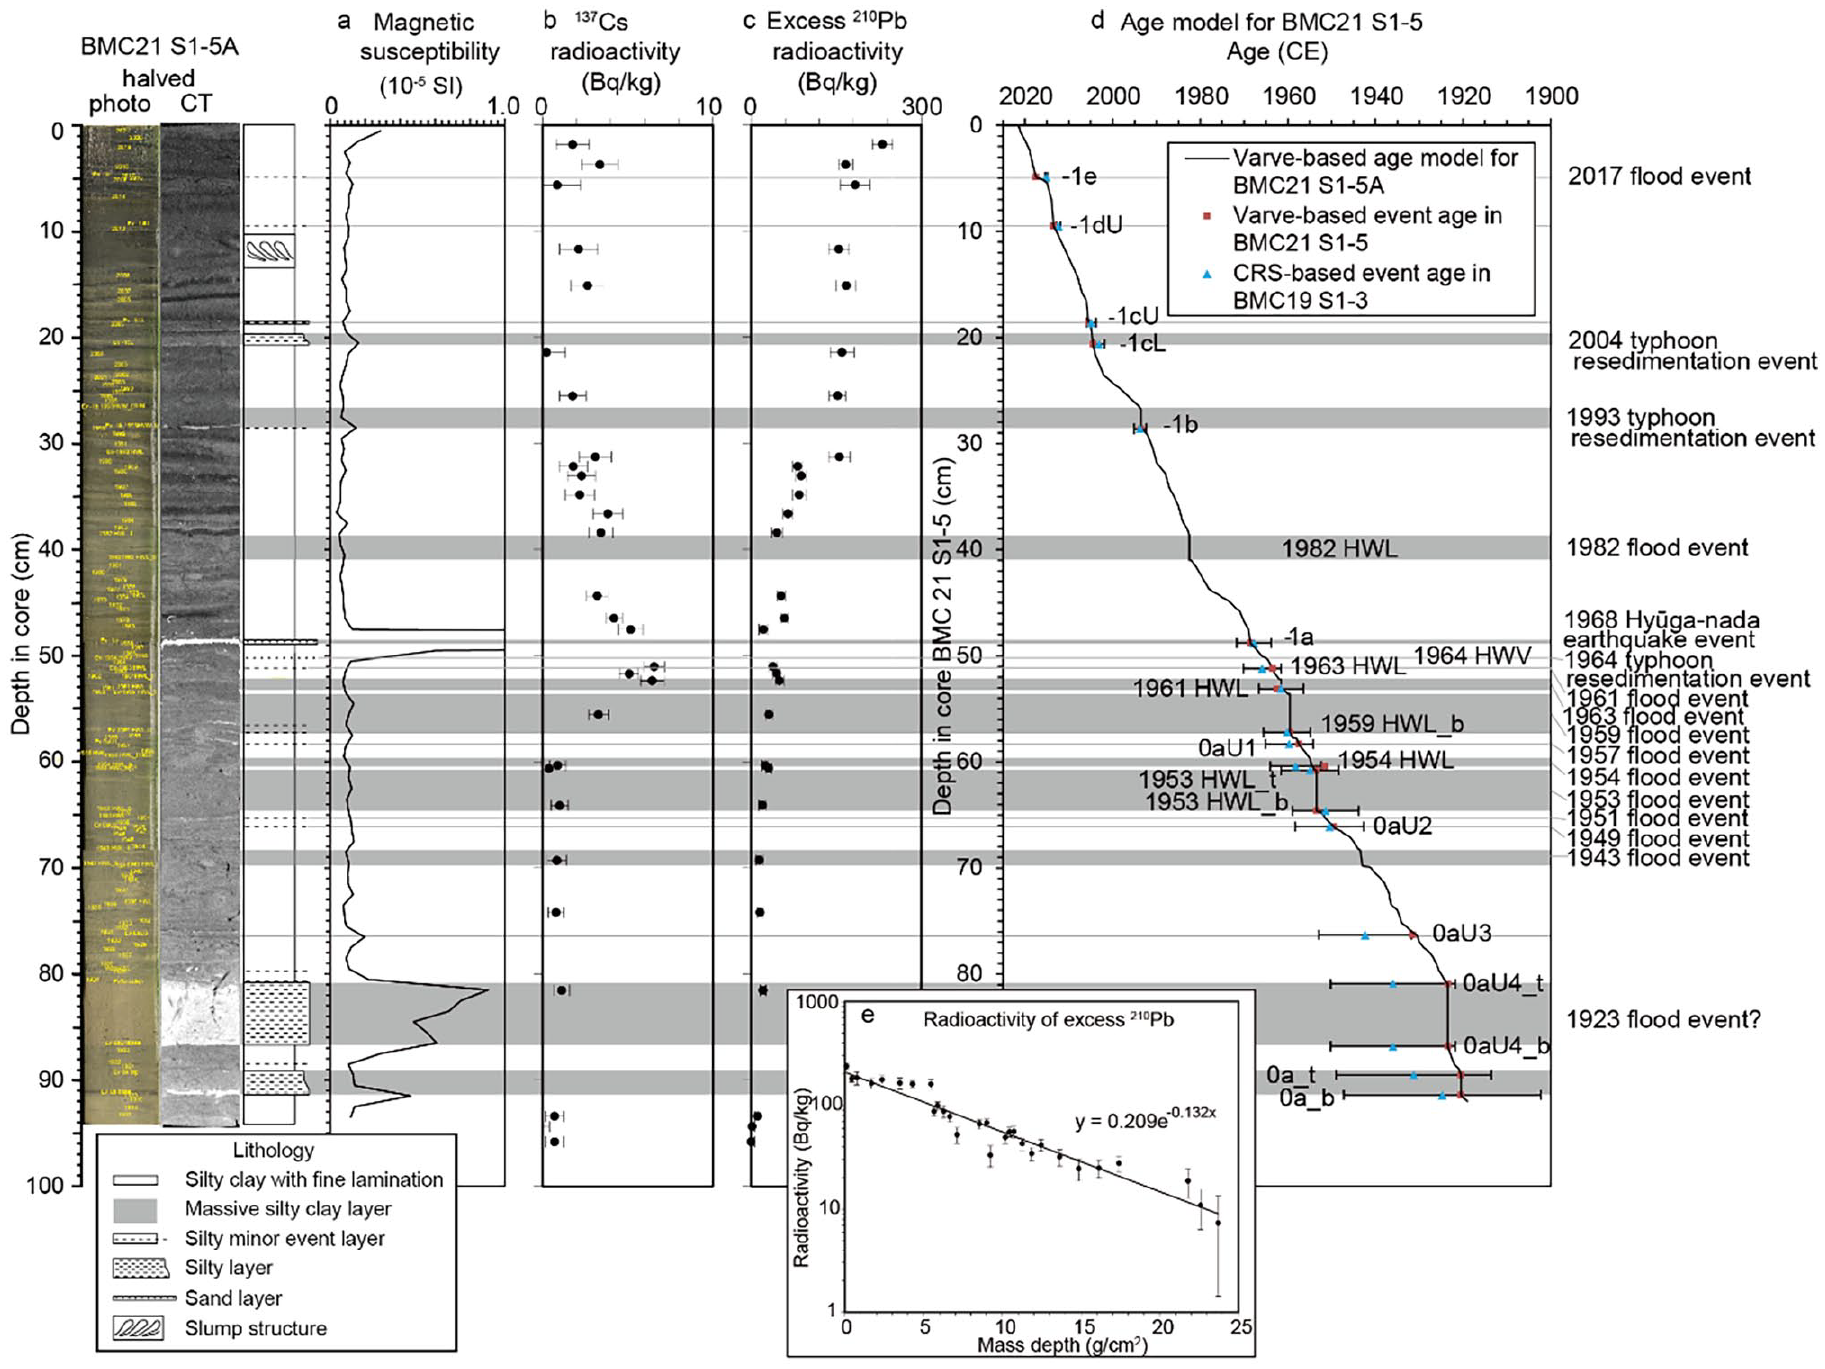
GSSP core photo, CT, lithology, magnetic susceptibility (a), 137Cs (b) and excess 210Pb radioactivity (c) and comparison between varve-based age model for core BMC21 S1-5 and 210Pb-based age model for core BMC19 S1-3 (d). (e): radioactivity of excess 210Pb against cumulative weight. The error bars in panels (b–e) show ±1SD errors. (d): age model (blue triangle) projected against the GSSP core depth from that estimated from the constant rate of supply (CRS) model of excess 210Pb data reported in Takahashi et al. (2020). Reproduced in color in online version.
Sedimentation rates and sediment mass accumulation rates
Both sedimentation rates and sediment mass accumulation rates were high in the massive layers and high-density layers and low in the laminated layers, ranging from 0.6 to 11.8 cm/yr in sedimentation rate and from 0.5 to 5.4 g/cm2/yr in sediment mass accumulation rate. Excluding the massive layers and the high-density layers, mean sedimentation rates and sediment mass accumulation rates in the laminated sediments were 0.64 cm/yr and 0.15 g/cm2/yr, respectively (Figure 4).
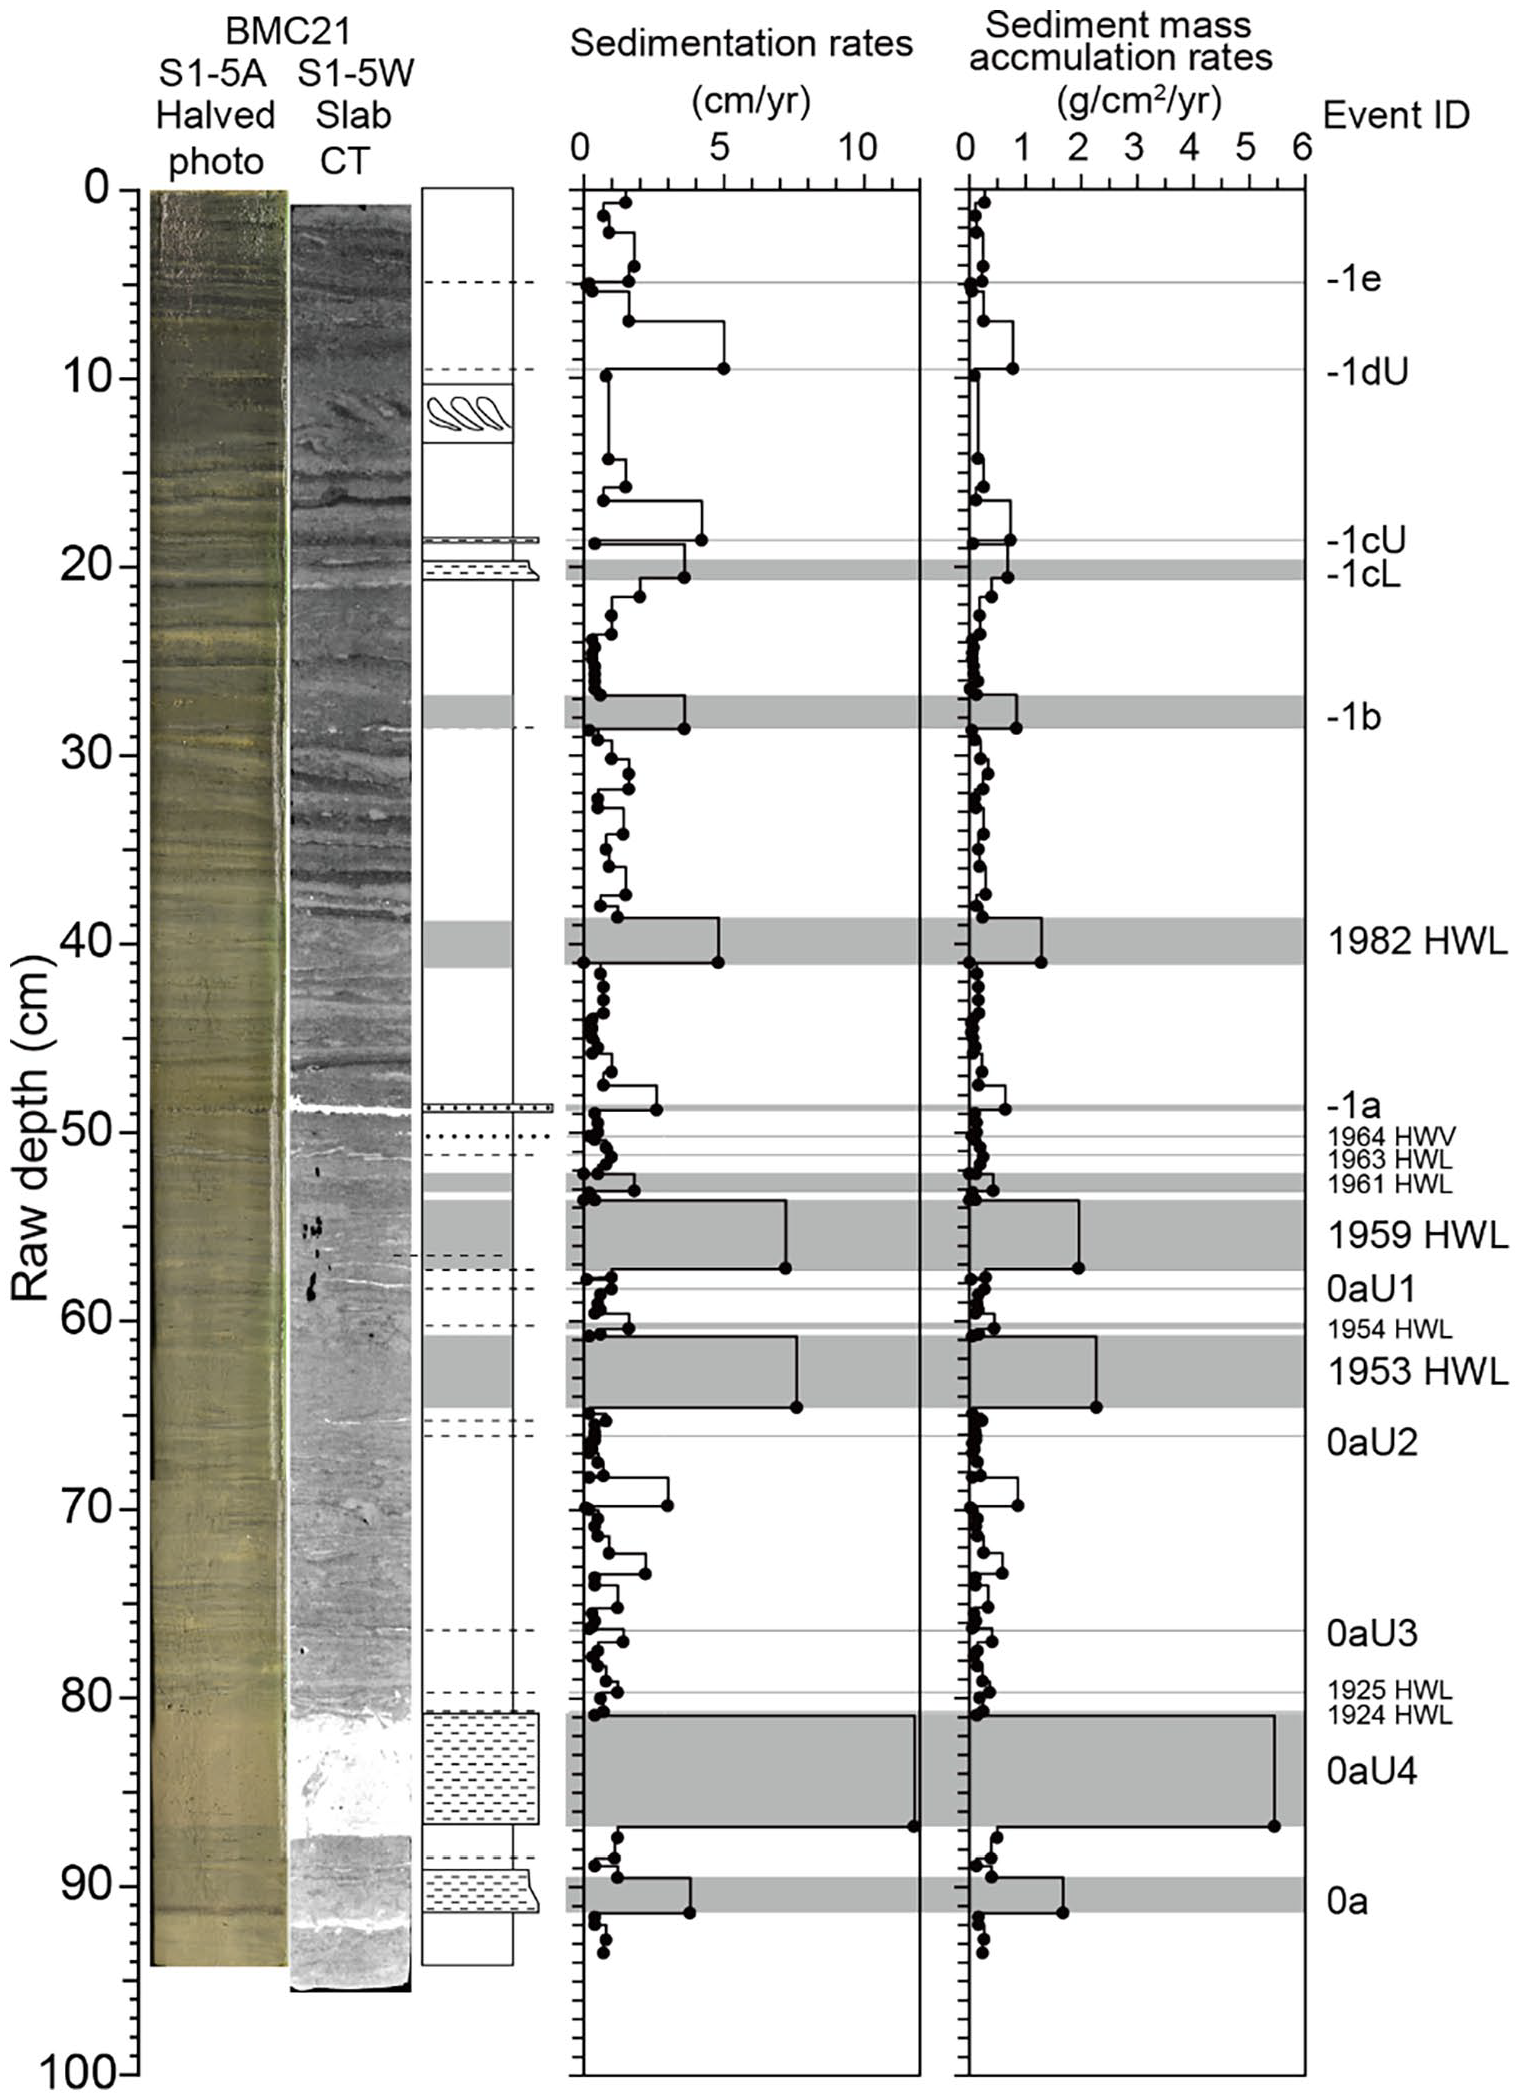
Sedimentation rates and sediment mass accumulation rates for BMC21 S1-5. Black closed circle denotes a rate plotted at the base of a layer. Reproduced in color in online version.
Anthropogenic markers
For the purpose of demonstrating the GSSP level, here we describe only the occurrence of anthropogenic sedimentary fingerprints detected by each marker. Most of figures below are shown by a raw depth (cm rd). Several figures are shown by a composite depth (cm cd) scale, in which depth above Ev 0a at 89 cm cd is the same as the raw depth of the candidate GSSP core, BMC21 S1-5, because the GSSP core is a master section in this interval. Several metrics were used to define the occurrence of anthropogenic fingerprint, including: a level with (1) an initial detection of the signature (e.g. first detection of microplastic); (2) initial increase in values (e.g. plutonium radioactivity and uranium ratios); (3) first abrupt increase in values; (4) first detection of the value exceeding the range below the layer of Ev 0aU2 (66.1 cm cd, 1949.5 CE; vertical blue shade, right side of Figure 14); (5) major change of composition (e.g. diatoms and elements) expressed within a stratigraphically-constrained cluster analysis, and; (6) a spike of value (PPG-derived 239Pu/240Pu and 233U/236U, charcoal deposition rates). In the main text, depth profiles with the marked positions of the level are provided only for the primary markers, but most of the rest of the markers are provided in the Supplemental Materials. The detected levels of all anthropogenic fingerprints are summarized in Figure 5 (in cm cd) and Supplemental Table 3.
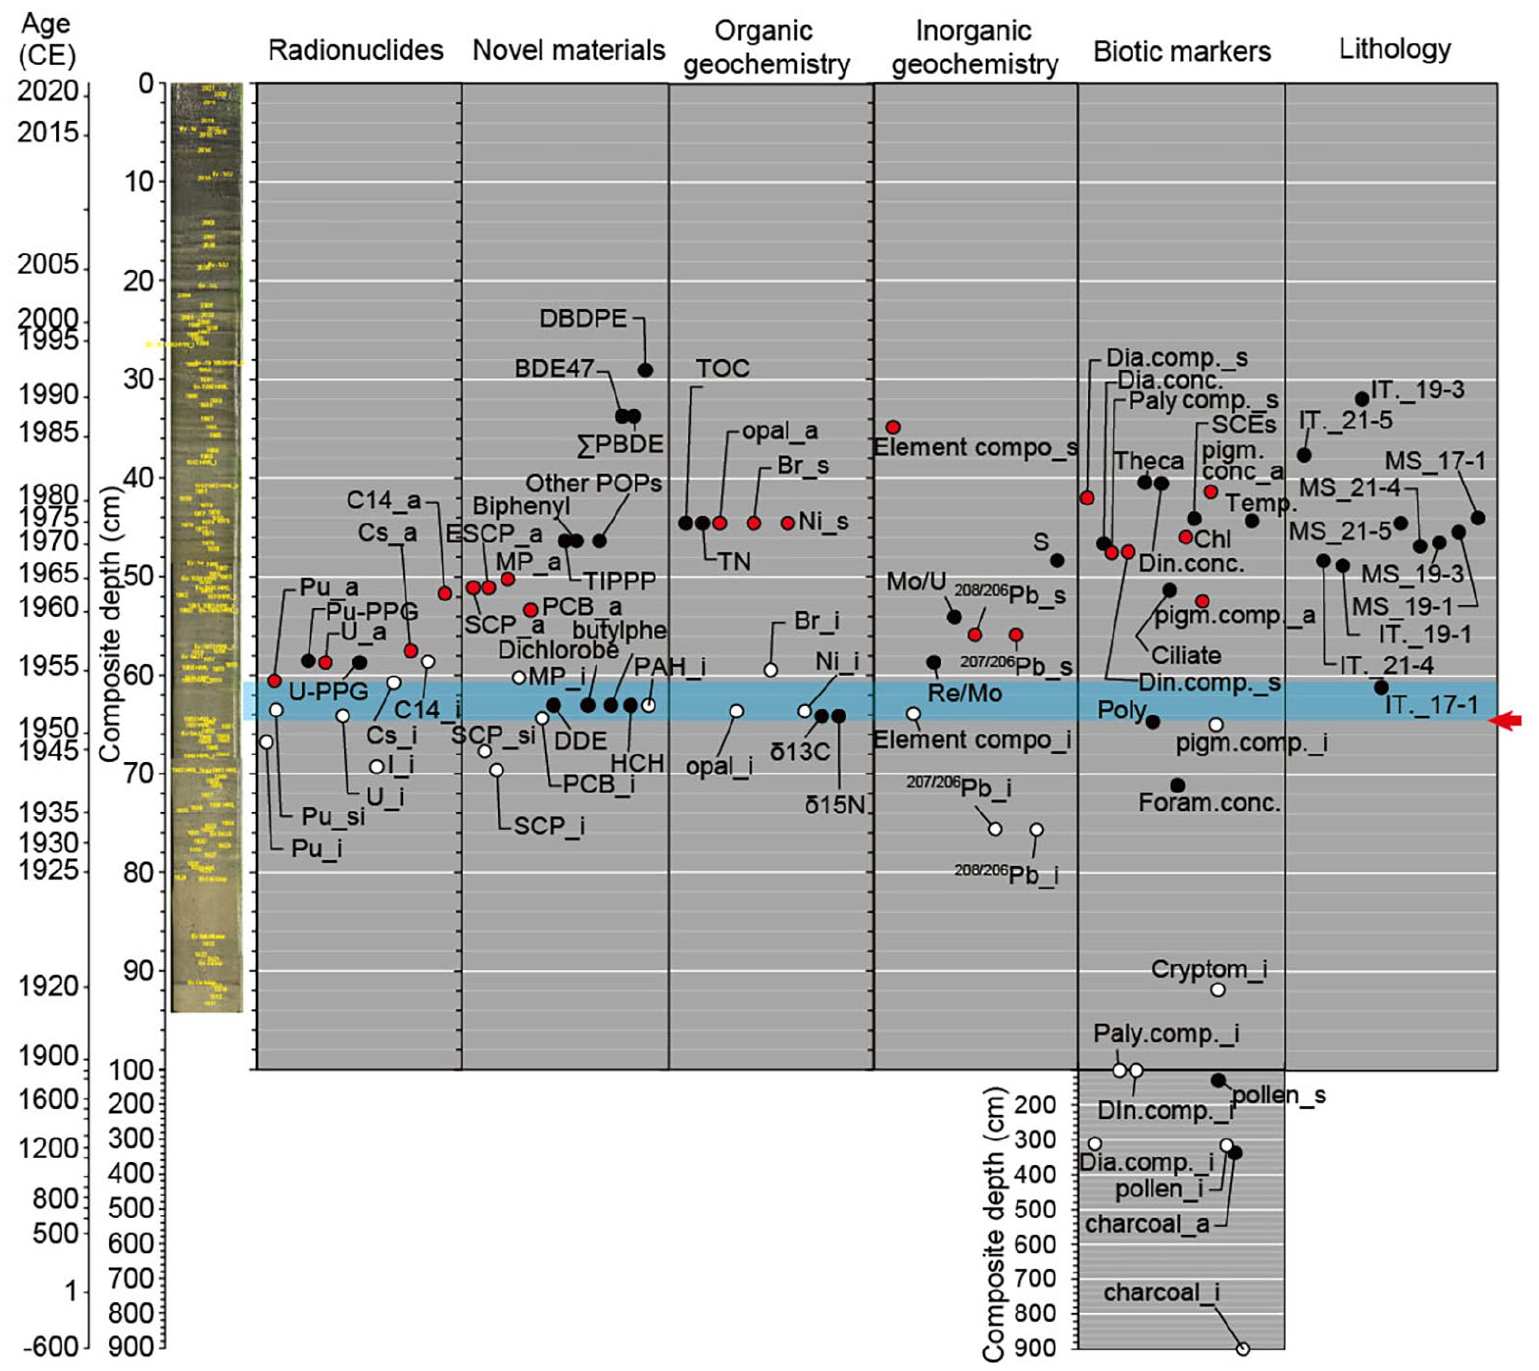
The detected levels of anthropogenic fingerprints in the Beppu Bay sequences. Open circle denotes an initial occurrence level of the anthropogenic fingerprint detected for a given marker (named as e.g. Pu_i for an initial detection of the signature in 1947 CE, followed by Pu_si for an slight increase in 1953). Closed red circle denotes the secondary change level (e.g. Br_s) or the abrupt change level (e.g. Pu_a) for the given marker. Closed black circle denotes an occurrence level of the first detection or unprecedented change in the marker record. Pu: plutonium, U: uranium, I: iodine, Cs: cesium, C14: carbon-14, PPG: Pacific Proving Ground, butylphe: 4-Methyl-2,6-di-t-butylphenol, Dichlotobe: 1,4-Dichlorobenzene, HCH: α-HCH, PAH: chrysene & triphenylene, fluoranthene, and anthracene, SCP: Spheroidal carbonaceous particles, ESCP: elemental compositions of SCPs, MP: microplastics, DDE: DDT derivatives, PCB: total PCBs, BDE/∑PBDE/DBEPE: chemicals of brominated flame retardants, Element compo: Element compositions, Re/Mo: rhenium/molybdenum ratio, Mo/U: molybdenum/uranium ratio, 207/206Pb and 208/206Pb: lead isotope ratio, opal: biogenic opal, δ13C and δ15N: stable carbon and nitrogen isotope ratio of anchovy scales, Br and Ni: bromine and nickel contents, TOC: total organic carbon, TN: total nitrogen, S: total sulfur, dia. comp.: diatom compositions, Paly. comp.: marine palynomorph compositions except for dinoflagellates, Din. comp.: dinoflagellate compositions, Poly: Polykrikos kofoidii concentrations, Theca: Thecamoeba concentrations, Pollen: pollen grain compositions, Cryptom: Cryptomeria japonica pollen grain deposition rates, Foram conc.: benthic foraminifera concentrations, Dia. conc.: diatom concentrations, pigm. comp.: pigment compositions, Din. conc.: dinoflagellate concentrations, Chl: chlorophyll a concentrations, SCEs: steryl chlorine esters, Temp: spring air temperatures, pigm. conc.: pigment concentrations, Ciliate: ciliates, IT (with core ID): element compositions analyzed by ITRAX, MS (with core ID): magnetic susceptibility. Horizontal light blue shade denotes the level of 1953 HWL event and red arrow denotes the level of the base, which is the proposal GSSP level. Reproduced in color in online version.
Radioisotopes
Plutonium
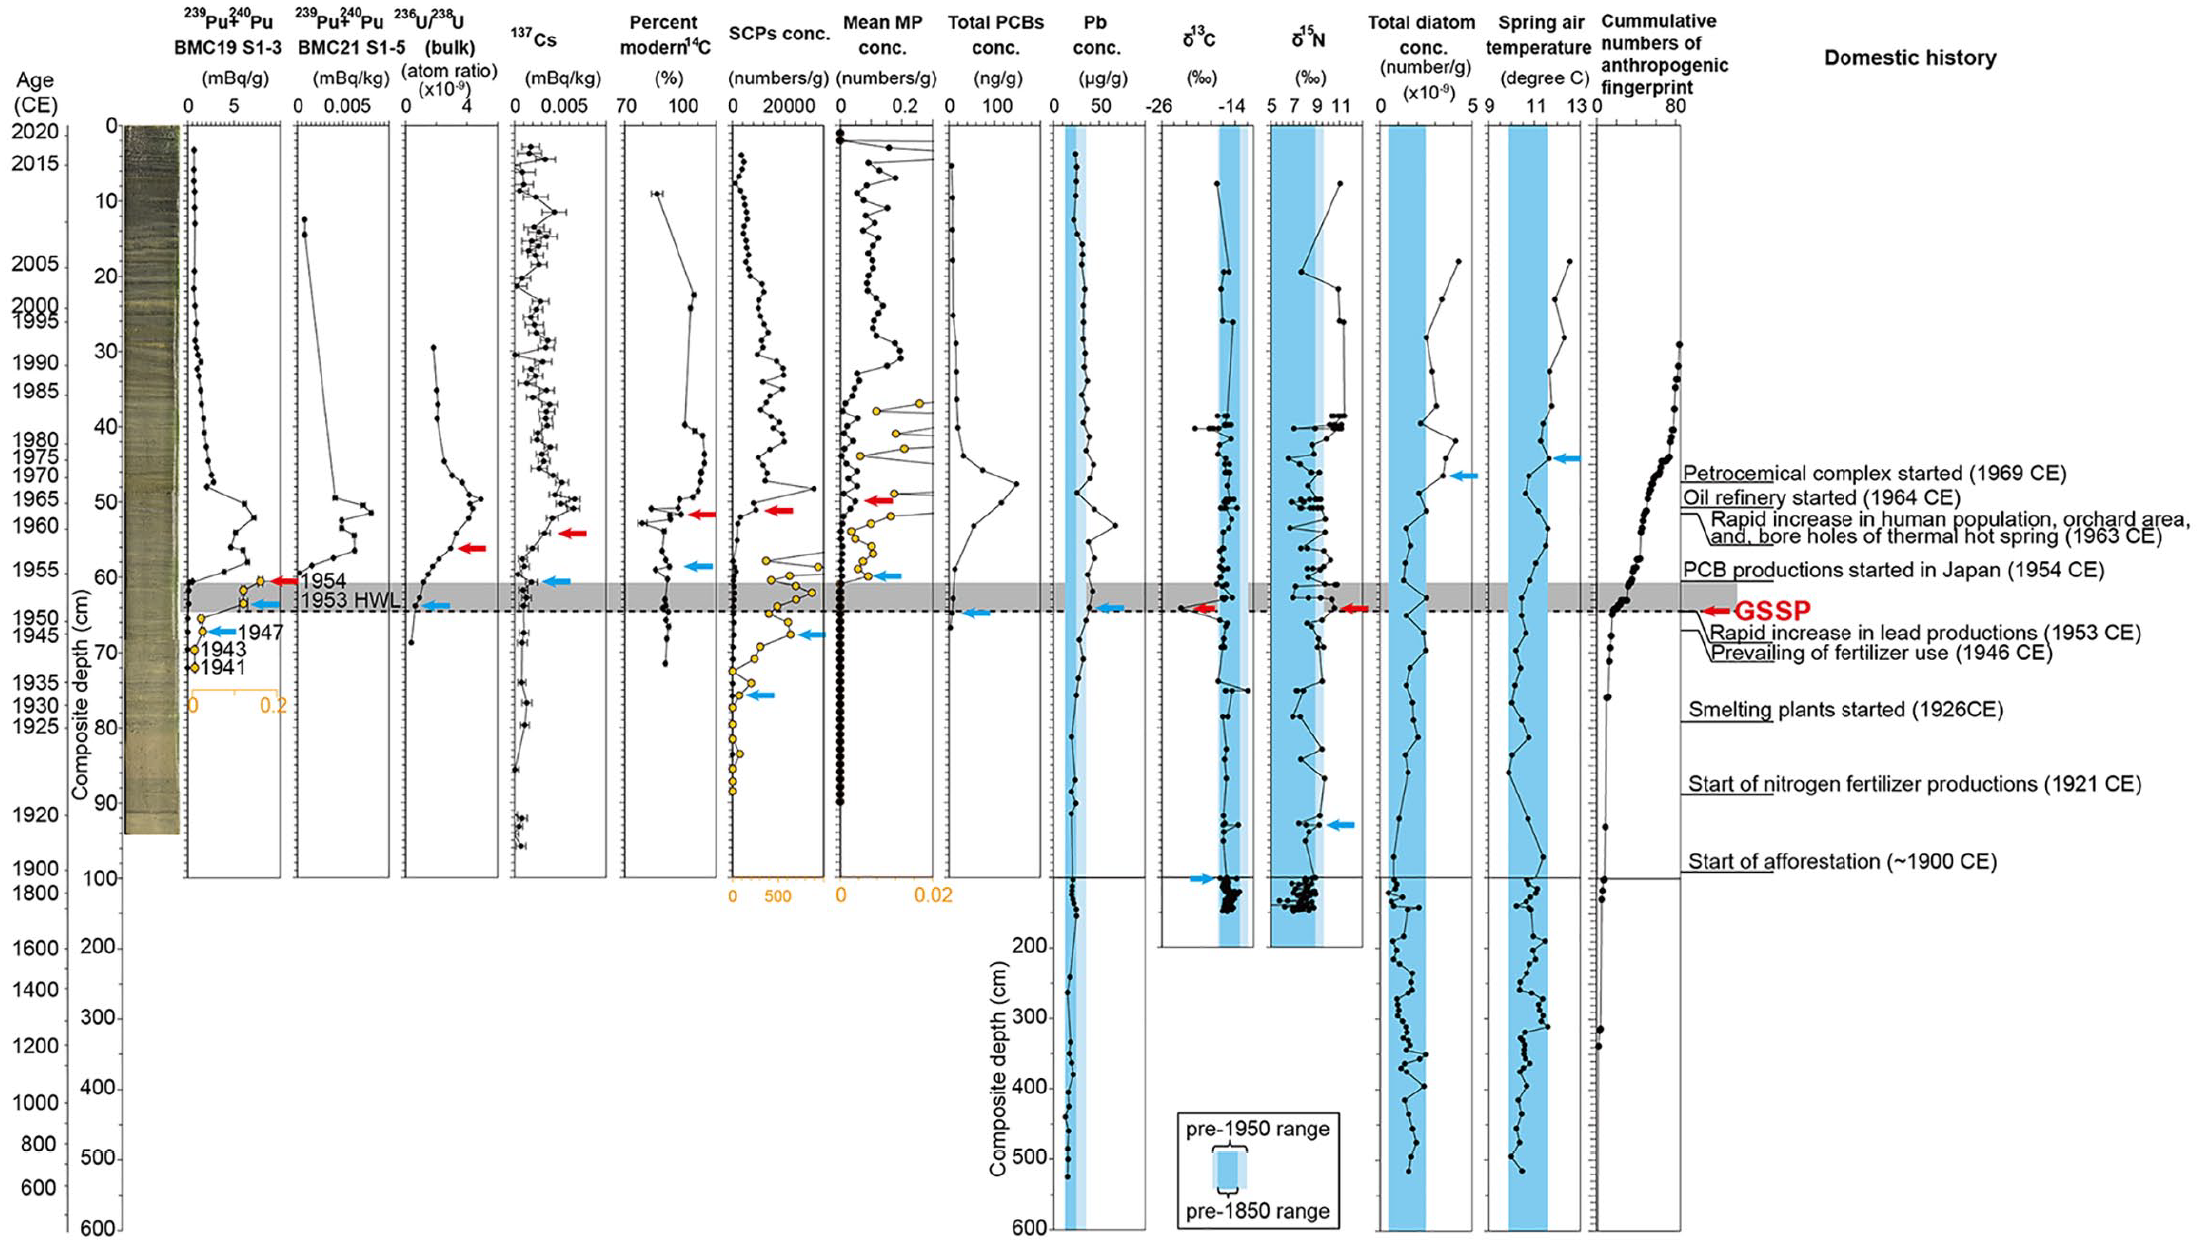
The record of Pu radioisotope signatures (Figure 6) showed a slight increase in 239Pu+240Pu at 59.5 cm in rd (hereafter, cm rd) (63.5 cm in cd) in the event layer 1953 HWL in core BMC19 S1-2 after an initial increase at 63.5 cm in rd (67.3 cm in cd, 1947 CE) from the base level at 67.5-65.5 cm rd (72.1-69.7 cm cd in 1941-1943 CE) (Yokoyama et al., 2022). The records also showed an abrupt increase in 239Pu+240Pu between the event layers 1954 HWL and 0 aU1 (1957 HWL) in both core BMC21 S1-5 and BMC19 S1-2. A spike of 239Pu/240Pu ratio was also recorded between the event layers in the both cores (58.5 cm rd/cd in BMC21 S1-5). A double peak of 239Pu+240Pu was visible, with a deeper peak between 0aU1 and 1959 and a shallower peak at 1963 HWL in both cores.
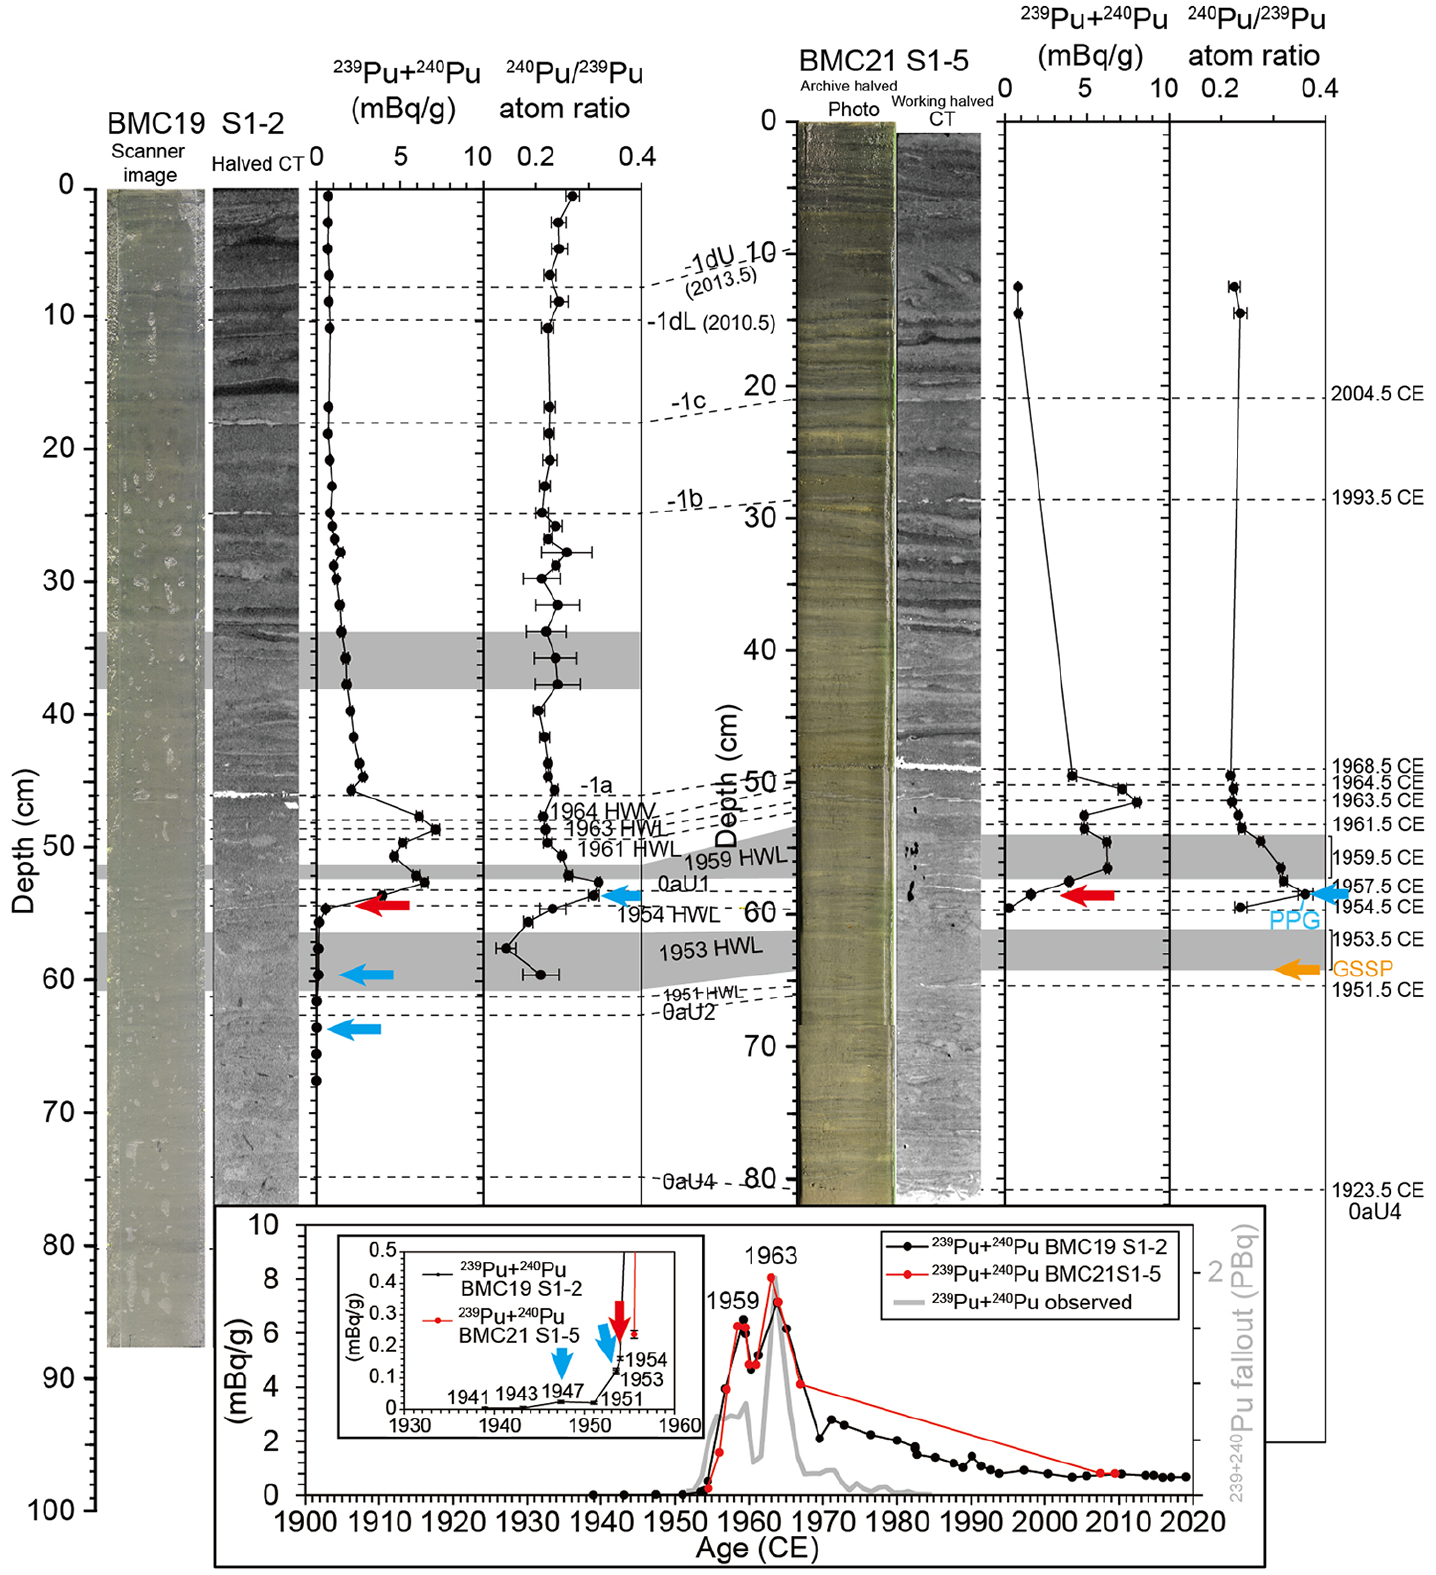
Depth profiles of plutonium isotope signatures along with core photo and CT image and the temporal changes. Proposed GSSP level is the base of the 1953 HWL (orange arrow). A horizontal dashed line and a gray shade denote stratigraphic correlations of a thin and thick event layer, respectively. Light blue and red arrows denote the initial increase and the abnormal change in the profile, respectively. Event IDs and CD are listed in Supplemental Table 1. Plutonium data from Yokoyama et al. (2022). Lower window denotes temporal changes in sedimentary radioactivity of 239Pu+240Pu and gray bold line denotes a record of radiogenic fallout from nuclear weapons testing from Hancock et al. (2014). Panel in the window denotes the same, but enlarged in the vertical scale. Reproduced in color in online version.
Uranium
The 236U/238U ratios in core BMC19 S1-3 (Figure 7) were low at 66.5 cm rd, increased slightly at 62.5 cm rd in the 1953 HWL event layer, increased abruptly at 55.5 cm in rd, and reached a maximum of at 52.5–50.5 cm rd (Takahashi et al., 2022). The second sharp peak occurred within a flood-derived layer, the 1982 HWL event at 40.5 cm rd. The 233U/236U ratio showed a spike abruptly at 55.5 cm rd.
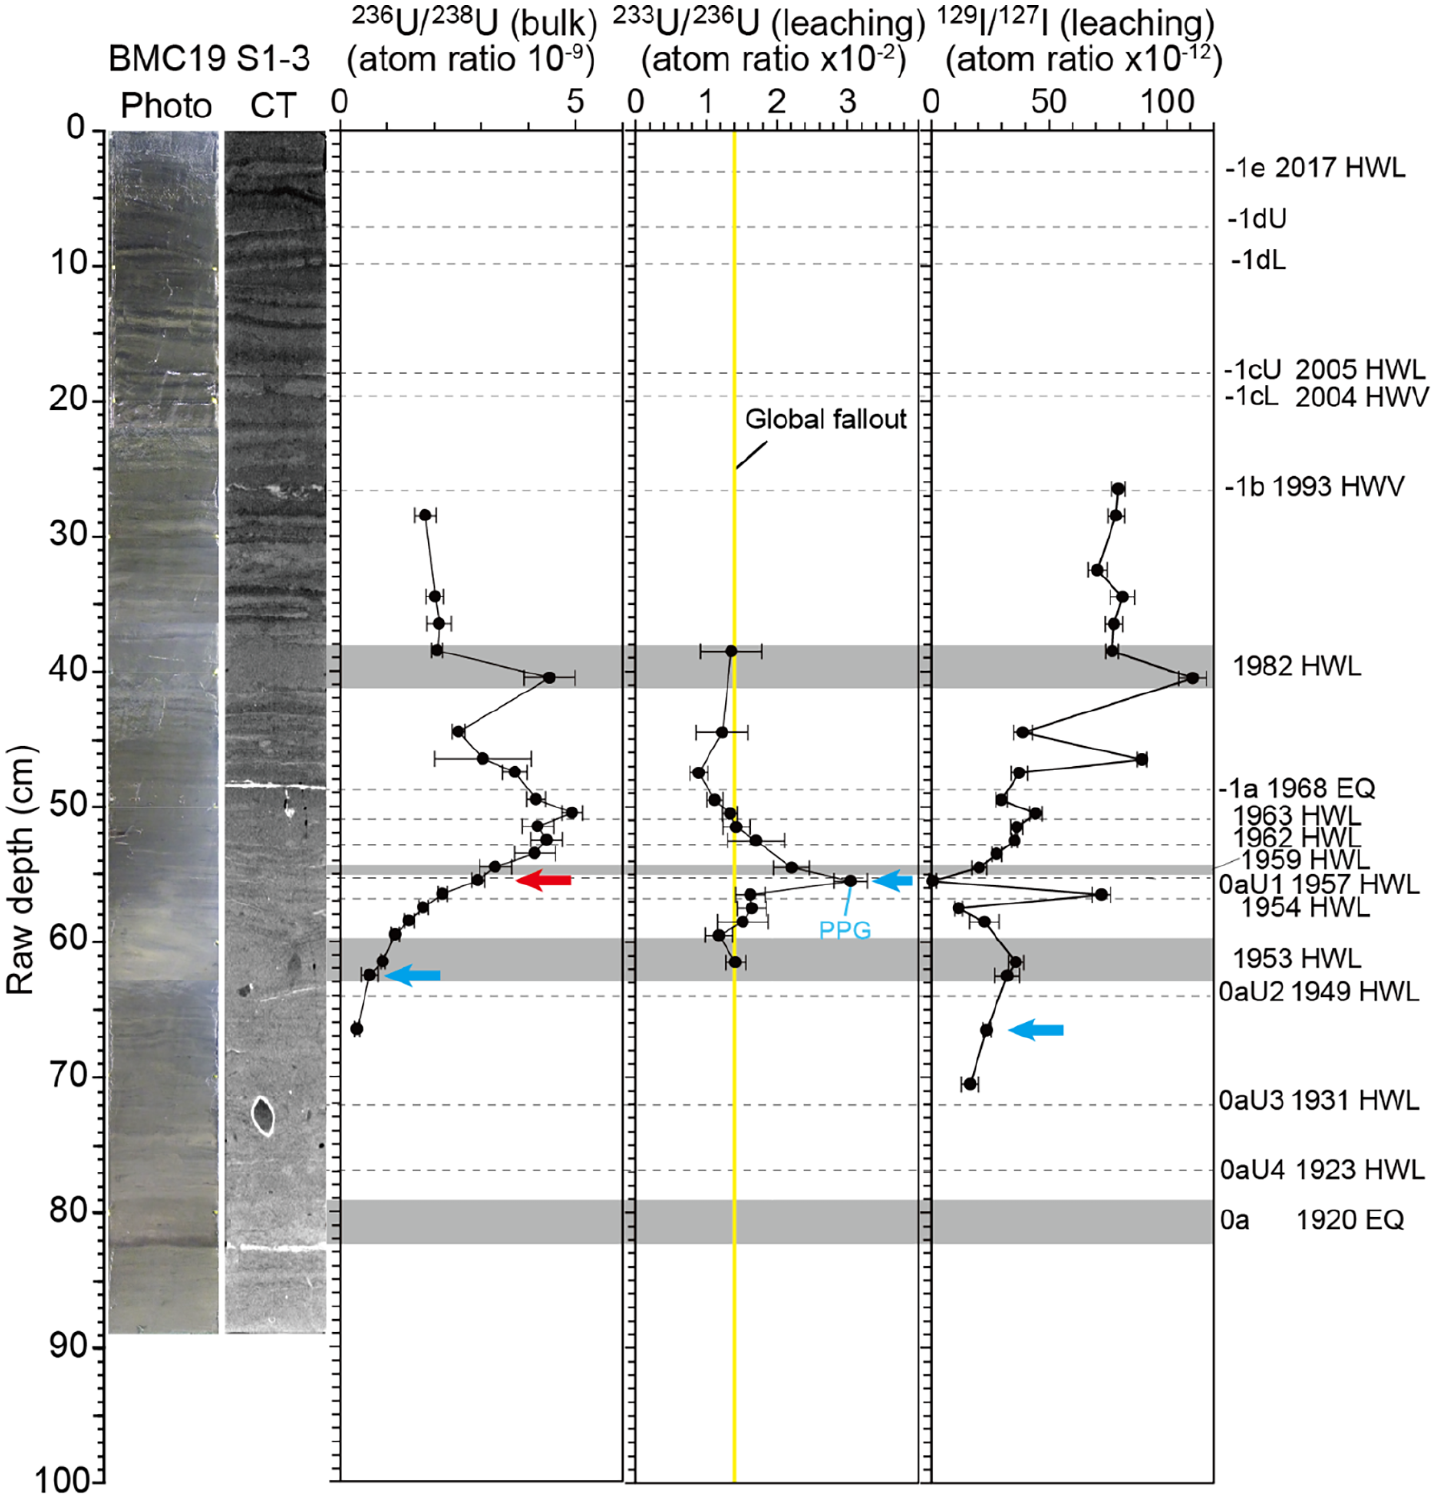
Depth profile of uranium and iodine isotope ratios along with the core photo and the CT image. For descriptions of figure details, see the caption for Figure 6. Uranium data from Takahashi et al. (2022). Reproduced in color in online version.
Iodine
The 129I/127I ratios in core BMC19 S1-3 (Figure 7) slightly increased at 66.5 cm rd (1943.9 CE), then increased irregularly, with higher values in thick massive event layers (e.g. in the 1953 HWL and 1982 HWL).
Cesium
Radioactivity of 137Cs in core BMC19 S1-3 showed low values 60.5–91.5 cm rd, increased slightly above 59.5 cm (just above the 1953 HWL event), further increased at 54.5 cm rd (1959 HWL event), and peaked at 50.5–52.5 cm (1962 and 1963 HWL event) (Figure 8, Takahashi et al., 2020). Above 49.5 cm, Cs values decreased, with a minor peak at 9.5 cm. In comparison, 137Cs activity in core BMC21 S1-6 increased slightly at 59.5 cm rd (just above the 1953 HWL event) and peaked sharply at 50.5 cm. Activities in core BMC21 S1-6 were relatively low (less than 0.003) in the 1959 event layer compared to those in the layer in BMC19 S1-3 (0.0033), reflecting dilution by the clastic materials in the thick 1959 layer.
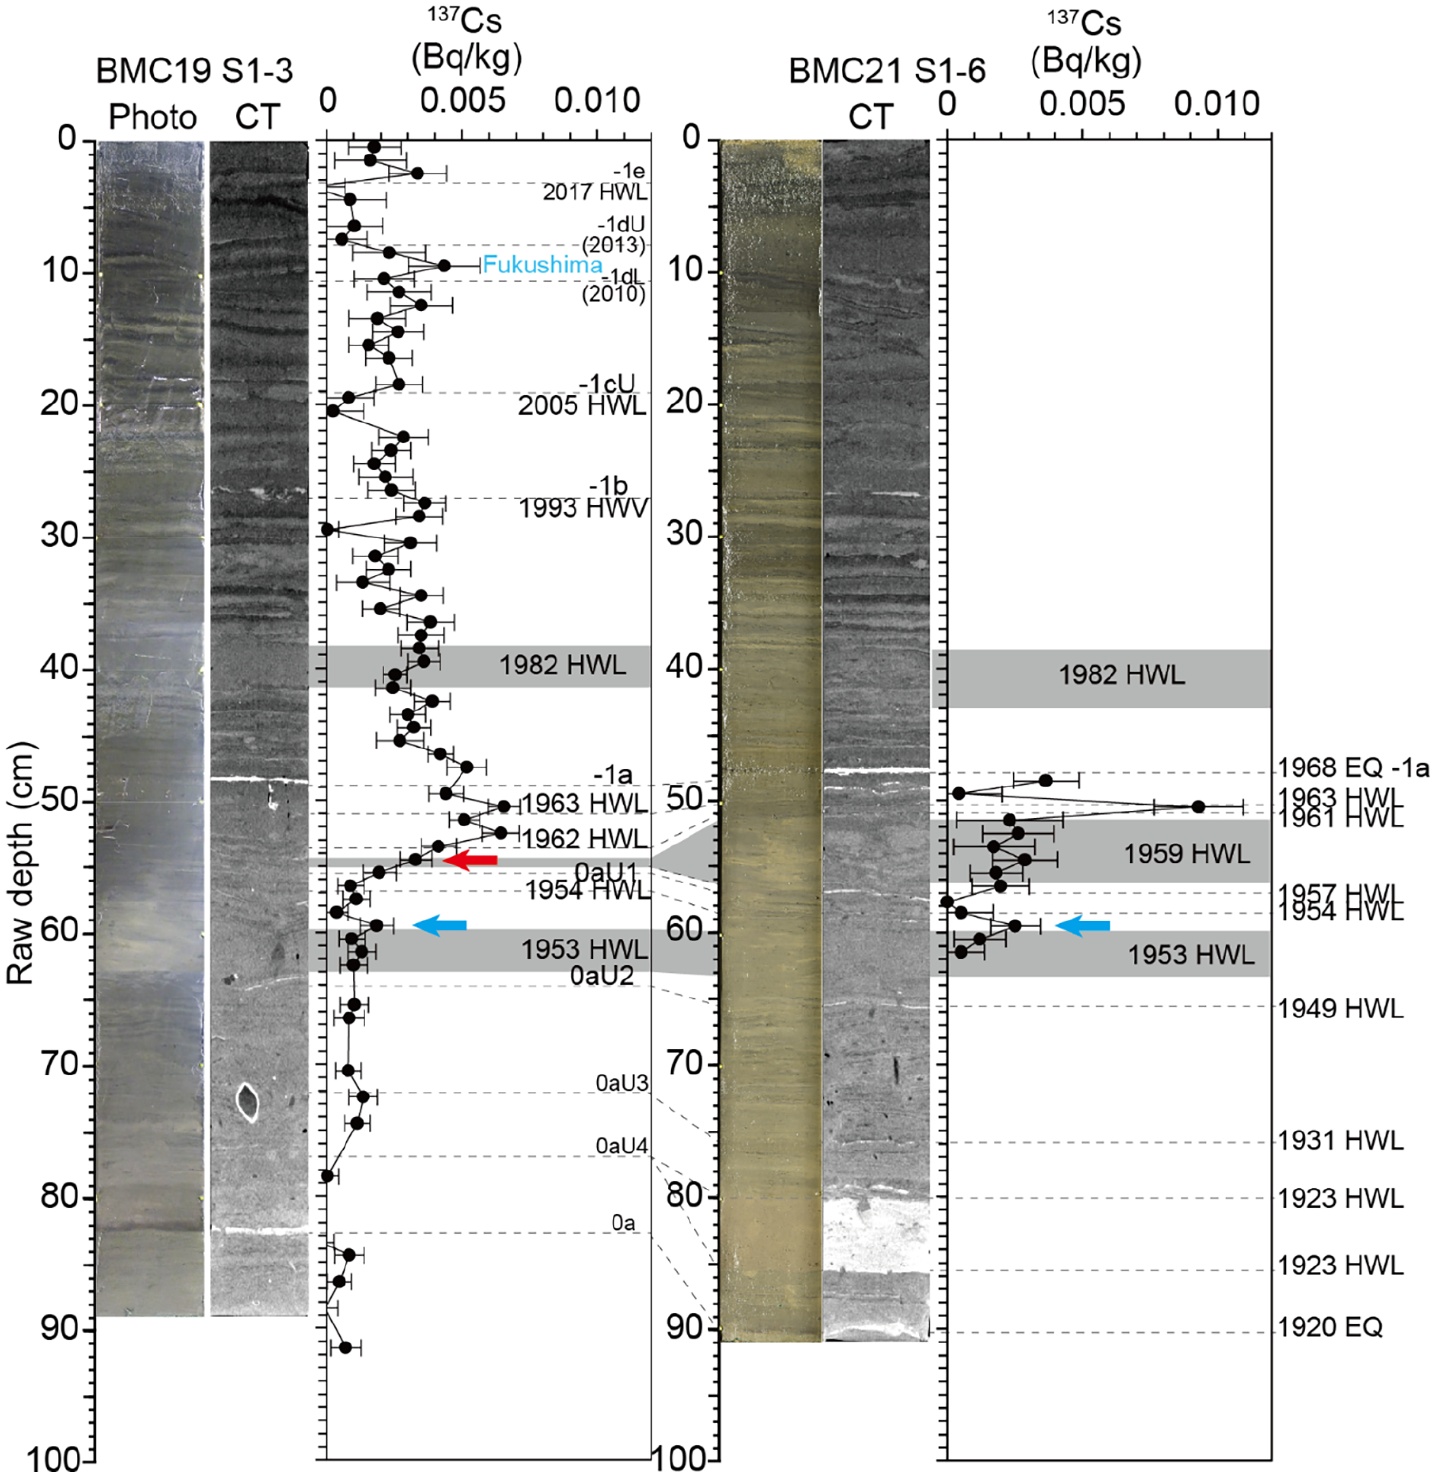
Depth profile of radioactivity of 137Cs in cores BMC 19 S1-3 and BMC21 S1-6. For descriptions of figure details, see the caption for Figure 6. Data for BMC19 S1-3 partly from Takahashi et al. (2020) with the addition of new data in this study. Data for BMC21 S1-6 reported in this study. Reproduced in color in online version.
Carbon-14
Percent modern 14C (pMC) of fish scales of anchovy showed an initial increase at 37.5 cm rd between the events 1953 HWL and 0aU1 in core BG19 S1-1, as well as an abrupt increase at 51.5 cm rd in core BMC19 S1-3 (Figure 9).
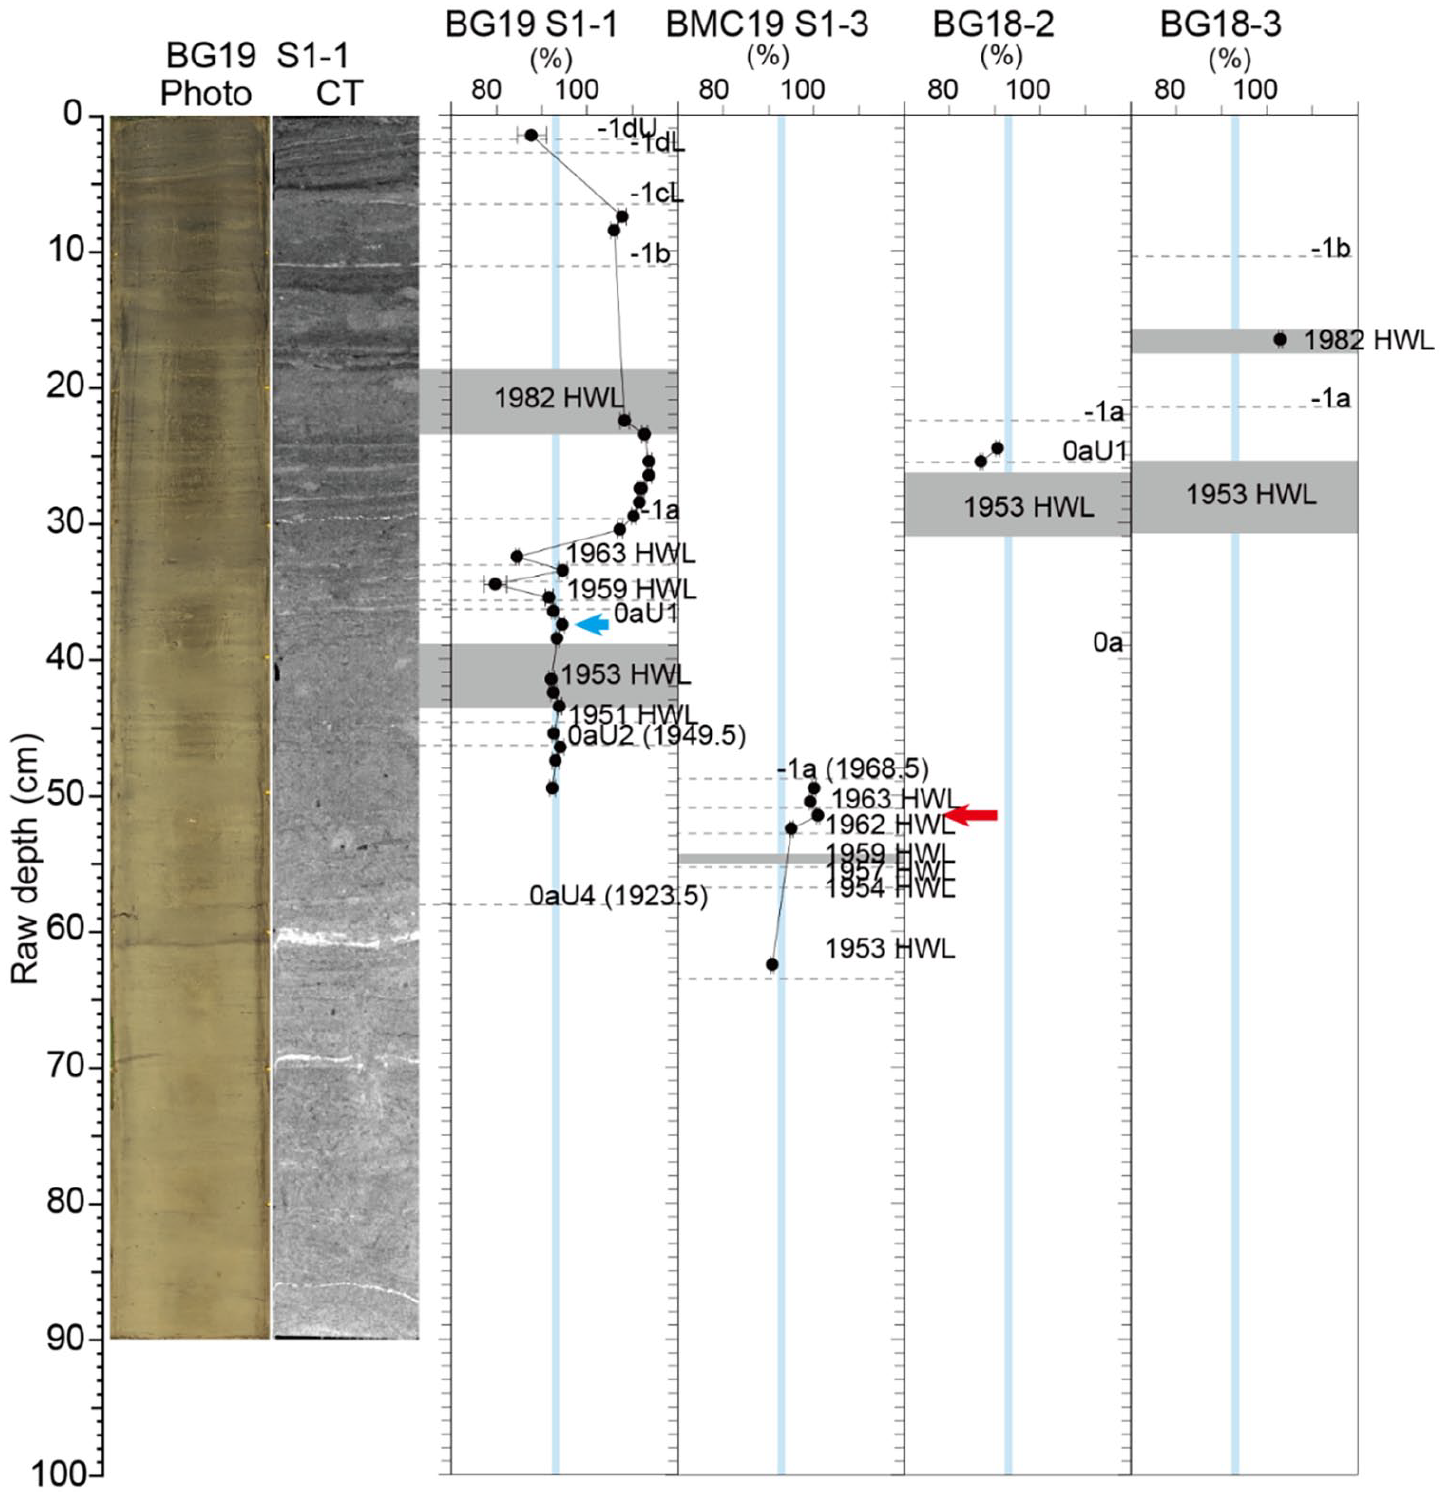
Depth profile of percent modern 14C in cores BG19 S1-1, BMC 19 S1-3, BG18-1, and BG18-3. For descriptions of figure details, see the caption for Figure 6. Vertical light blue shade denotes the range of the variations in the values below the event layer 0aU2 (1949.5 CE). Reproduced in color in online version.
Novel materials
SCPs
SCPs were first detected continuously at 69.5 cm rd above Ev. 0aU3, started increasing at 64.5 cm rd (below Ev. 0aU2; 1949.5 CE), and rose abruptly at 49.5 cm rd between events 0aU1 and -1a (Inoue et al., 2022) (Figure 10).
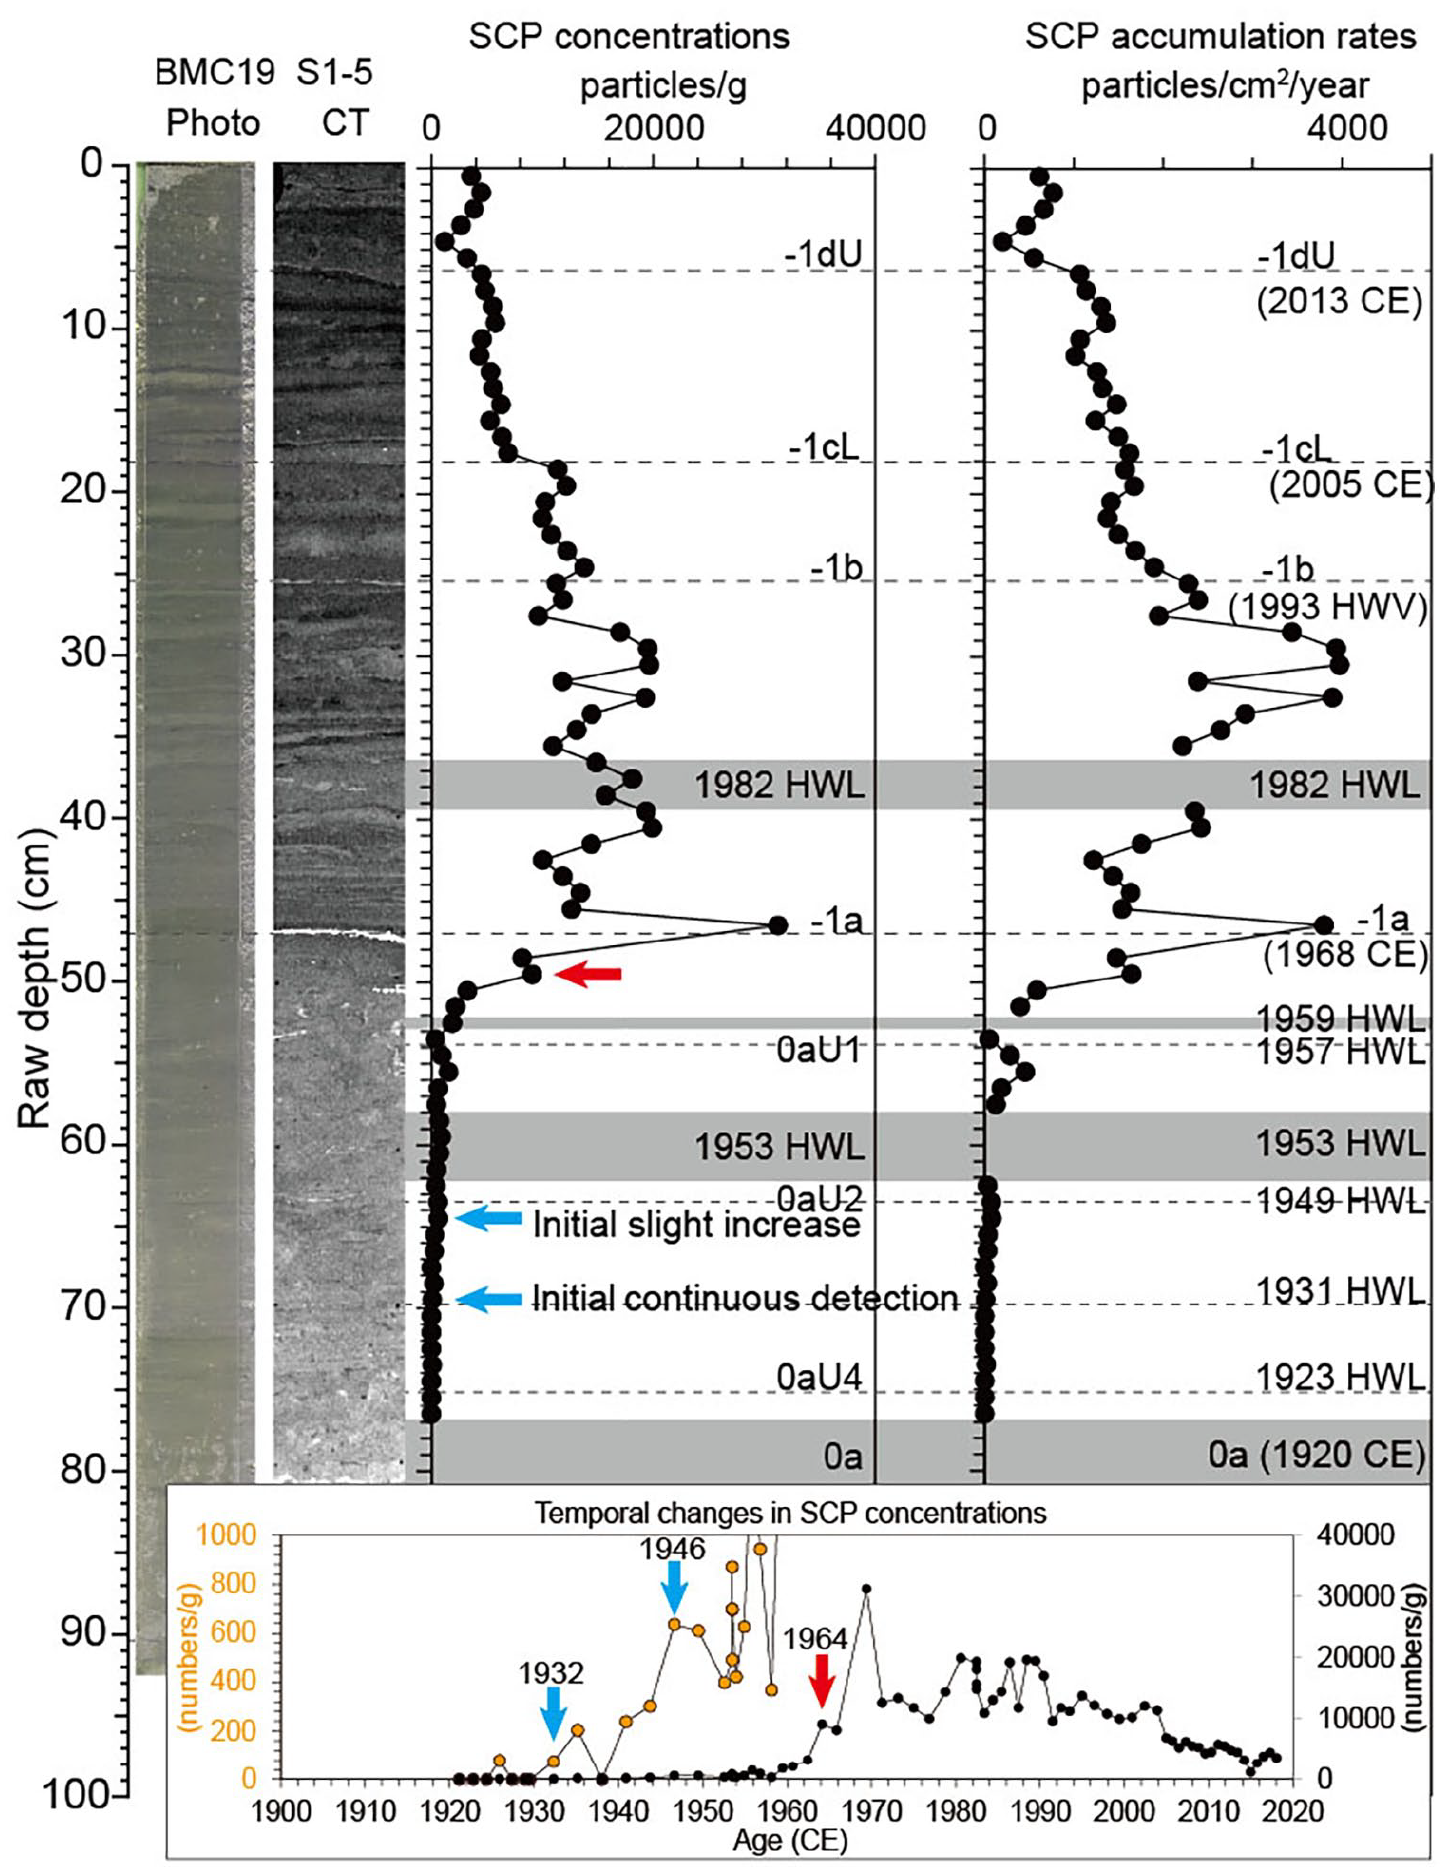
Depth profile of spheroidal carbonaceous particle (SCP) concentrations and fluxes along with the core photo and the CT image. For descriptions of figure details, see the caption for Figure 6. Data from Inoue et al. (2022). Orange circle in the window denotes the same as a black circle in the corresponding year, but enlarged in the vertical scale. Reproduced in color in online version.
Microplastics
Microplastic concentrations were first detected at 22.5 cm rd (60.2 cm cd, just above Ev. 1953 HWL) in BG18-4, then exhibited an abrupt increase at 49.5 cm rd (50.2 cm cd, just above Ev 1964 HWV) in BMC19 S1-4 (Figure 11). BHR19 S1-1 showed very high concentrations in MP above and below -1a, but the samples include the event layer and other event layers, where the microplastics are likely earthquake-, storm-, and flood-reworked. Therefore, high concentrations in the lowermost two samples in core BHR19 S1-1 were omitted for the subsequent analysis.
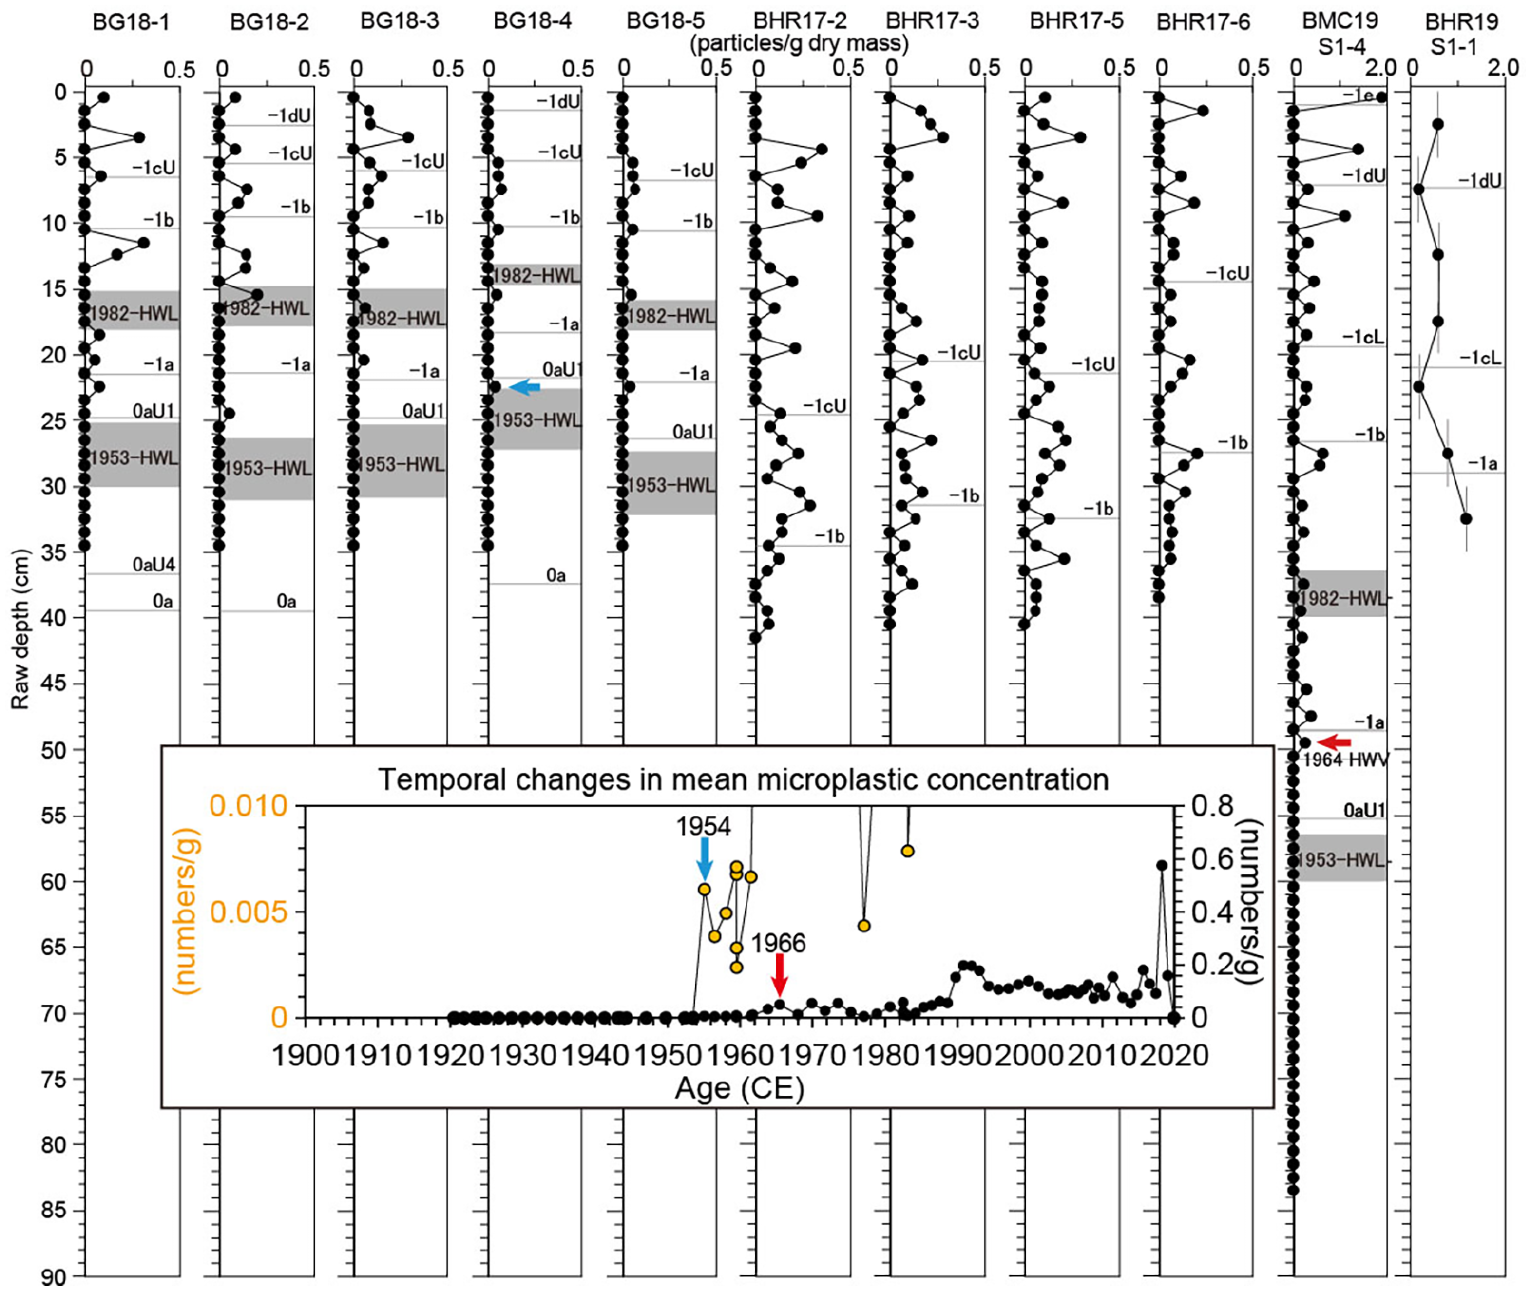
Depth profile for microplastic concentrations in 11 cores. For descriptions of figure details, see the caption for Figure 6. Data from Hinata et al. (2023). Lower window denotes temporal changes in mean microplastic concentraion. Orange circle in the window denotes the same as a black circle in the corresponding year, but enlarged in the vertical scale. Reproduced in color in online version.
Organic matter proxies
Stable carbon and nitrogen isotope ratios
Depth profiles of stable carbon isotope values (δ13C) (Figure 12) within fossil anchovy scales varied between −16.8‰ and −11.9‰ below the 0aU2 layer (66.1 cm cd, 1949 CE) and between −16.1‰ and −13.3‰ below the 0d layer (109.4 cd cm, 1853 CE). The initial increase in δ13C values after 1850 CE occurred at 62.5 cm rd in BG17-1 (101.6 cm cd, 1888 CE). The first occurrence exceeding the out-of-range δ13C values after 1950 CE was at 62.5 cm rd (1953.5 CE) in core BMC19 S1-3, which was in the 1953 HWL layer. In contrast, depth profiles of nitrogen isotope values (δ15N) ranged from 4.8 to 9.7‰ below the 0aU1 and from 4.8 to 8.9‰ below the 0d (Figure 13). The initial decrease in δ15N values after 1850 CE occurred at 33.0 cm rd in BG10-4 (93.1 cm cd, 1917 CE). Above 0aU1, there were several levels with values exceeding the pre-1950 range, although most samples included event layers, which might allow for the possibility of reworked fish scales. The first appearance of the scales with the out-of-range δ15N values above 0aU1 was 62.5 cm rd in core BMC19 S1-3, which was in the 1953 HWL layer. The high δ15N value was also found in the 1953 HWL layer in BG18-3 (28.5 cm rd), suggesting that for the last 292 years before 1953 CE, unprecedented high values are robust in the recent levels of the Beppu Bay sequences.
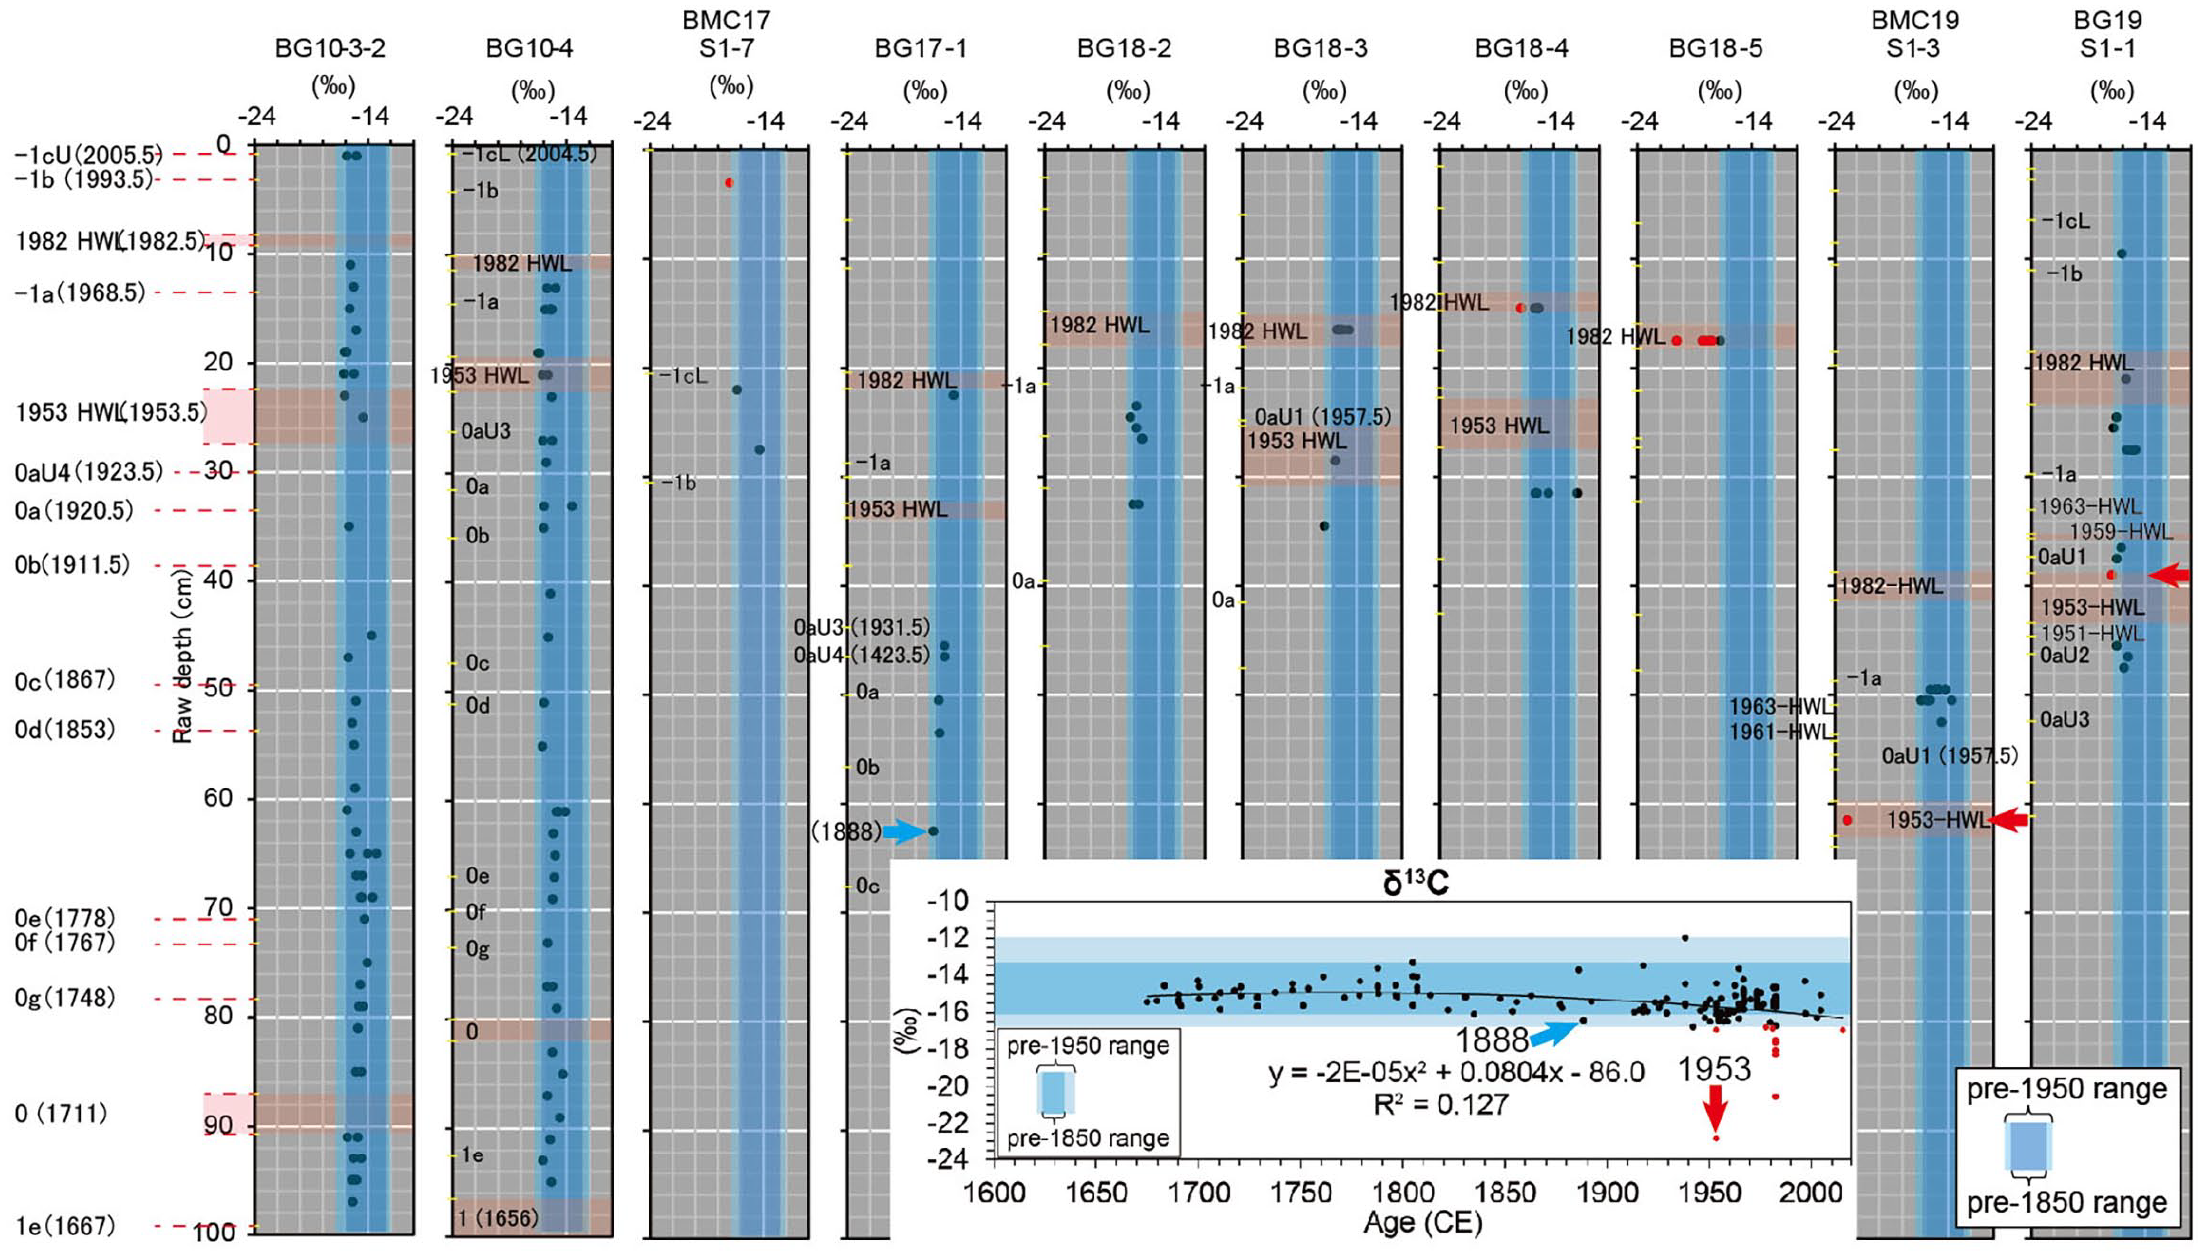
Depth profiles stable carbon isotope ratios of fish scales of Japanese anchovy (this study). Light blue shades denote ranges of the ratios below 0aU2 or 0d event layer. Red circle denotes a value out-of-the range. Event layer ID with the age parenthesized was placed at the corresponding level. Horizontal translucent red shade denotes a thick event layer. Lower window denotes temporal changes in δ13C. Reproduced in color in online version.
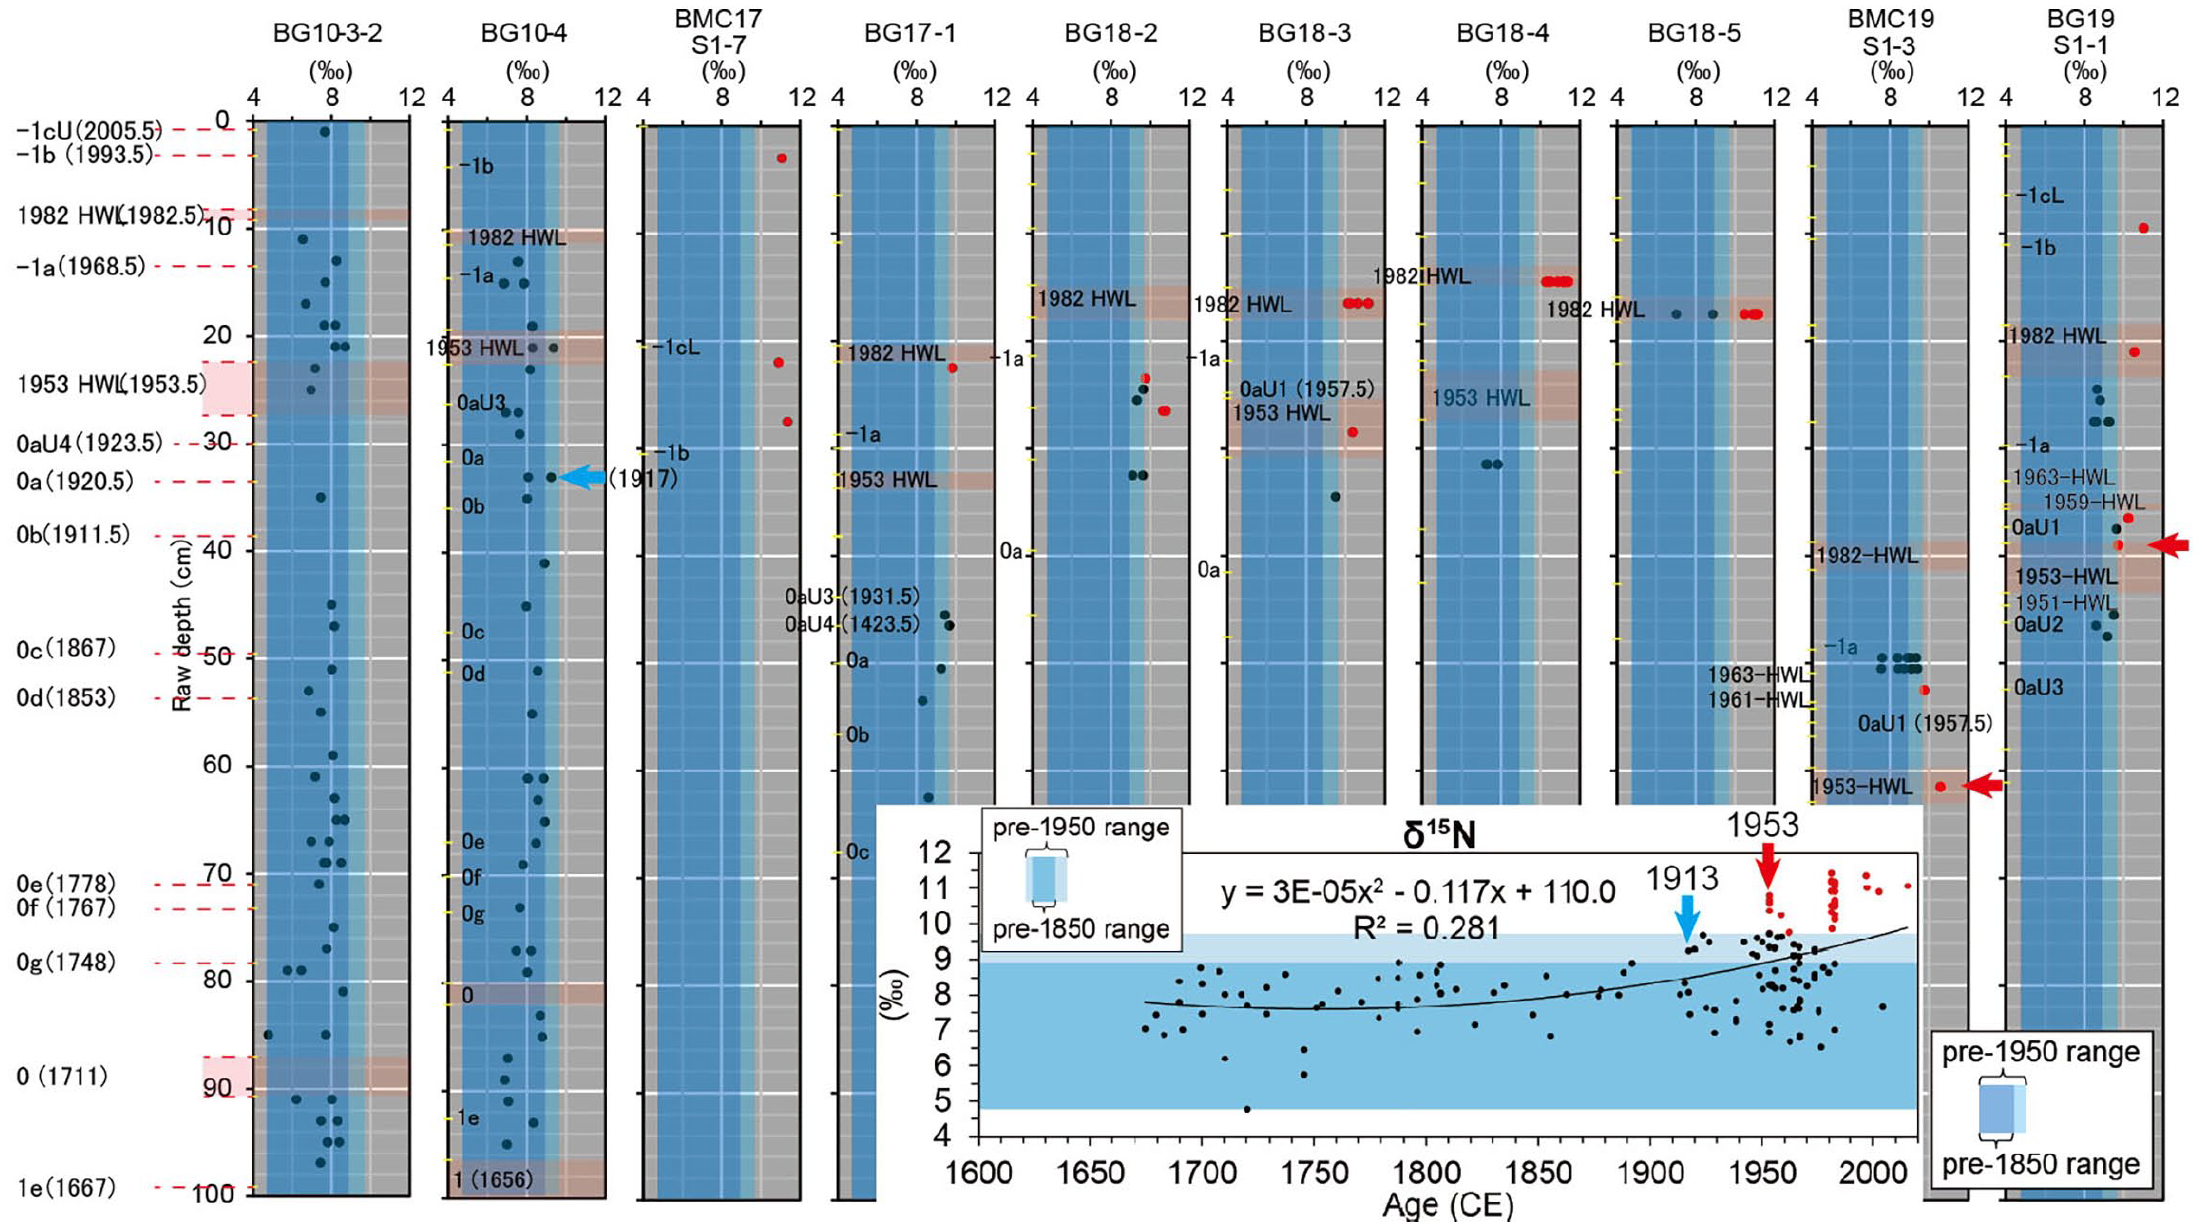
Depth profiles of stable nitrogen isotope ratios of fish scales of Japanese anchovy. For descriptions of figure details, see the caption for Figure 12. Lower window denotes temporal changes in δ15N
Inorganic geochemical signals
Elements for bulk sediments
The main change in elemental compositions above 525 cm cd (638 CE) occurred at 31.5 cm rd in BMC19 S1-1 (34.8 cm cd, 1986 CE) and corresponded to an increase in content of Al, V, Rb, Sr, Ag, Ba, and Cs (Figure 14). Earlier changes were detected at 61.5 cm rd (64.0 cm cd, 1953 CE) and corresponded to increases in Cu, Zn, As, Sb, Hg, Pb, and Bi that are unprecedented with respect to the 1310 years before 1953 CE.
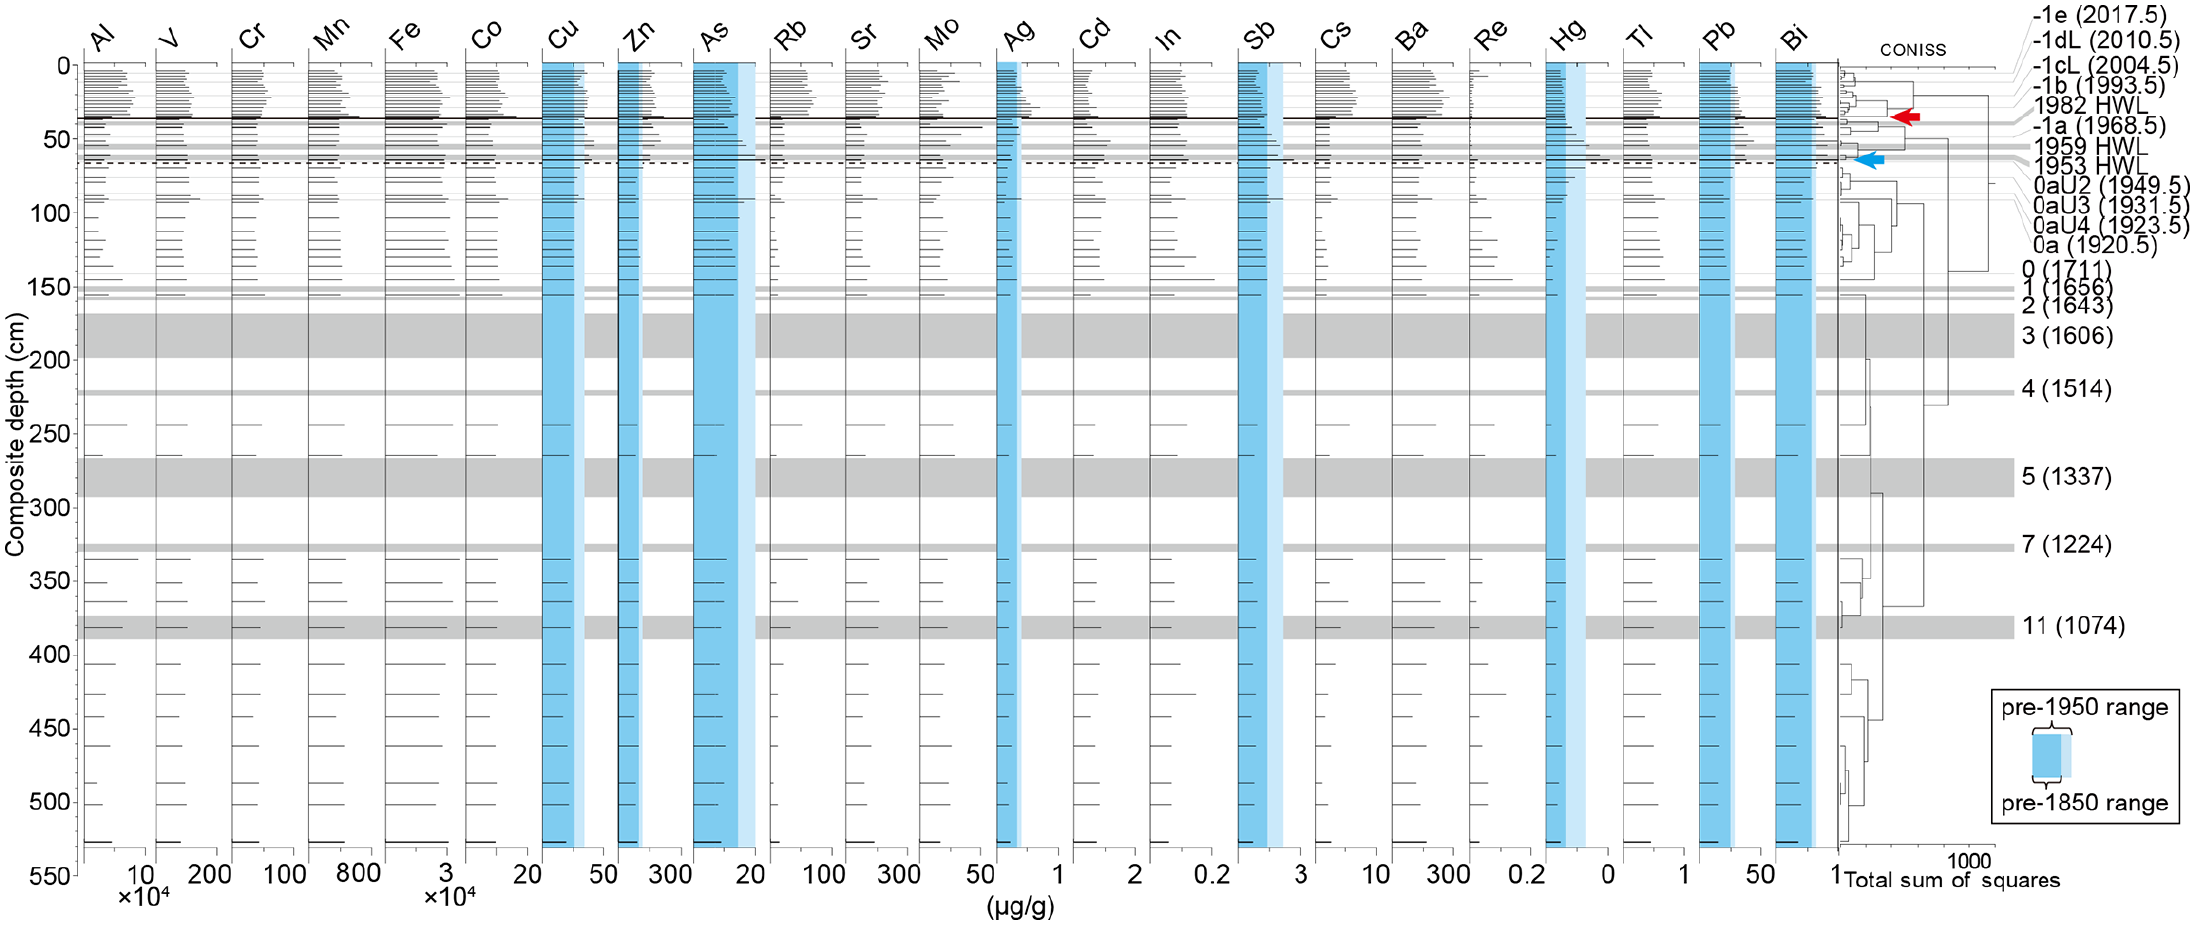
Depth profile of bulk element concentrations. Horizontal solid and dashed line denotes the first and the second major changes in the compositions. Horizontal gray shade denotes an event layer (the age and the event ID is noted at the right side). Light blue and red arrows denote levels of the first and the second occurrence of the major change, respectively, which were based on the cluster analysis. Vertical blue shade is the range of the data below Ev 0aU2 (1949 CE) or Ev 0d (1853 CE). Data above 100 cm depth in core BMC 19 S1-1 were provided from this study and those below 100 cm depth in cores PC07 and PC05 are used from Kuwae et al. (2022a). Reproduced in color in online version.
Elements by XRF core scanner
Cluster analyses using the element contents based on XRF core scanner data detected a major change in the composition at 35.6 cm rd (61.1 cm cd) in Ev 1953 HWL in BG17-1 (Figure 15), at 47.3 cm rd (48.8 cd) in Ev. -1a in BMC19 S1-1 (Supplemental Figure 14), at 31.2 cm rd (31.9 cm cd) in BMC19 S1-3 (Supplemental Figure 15), at 47.0 cm rd (48.3 cm cd) in BMC21 S1-4 (Supplemental Figure 16), and at 37.6 cm rd (37.6 cm cd) in BMC21 S1-5 (Supplemental Figure 17). In BG17-1, BMC19 S1-3, BMC21 S1-4, and BMC21 S1-5 there were common elemental changes at the boundaries, showing an increase in Fe, Mn, S, K, Ti, Fe, and Cu and a decrease in Br and Zr. Elemental changes in BMC19 S1-1 with higher precision of quantification showed a higher amplitude of fluctuations in elemental counts (Ar, Mn, Fe, Cu, Zn, and Br), which are derived from fine lamination with higher water content, than that below the boundary (Supplemental Figure 14).
Depth profile of ITRAX-derived element contents in BG17-1. The data averaged with 5 points (1.6 mm thickness) were plotted and analyzed for the clustering. Horizontal dashed line denotes the major changes in the compositions. Horizontal gray shade denotes an event layer (the event ID and the age are noted at the right side). Red arrow denotes the level of occurrence of major change. Reproduced in color in online version.
Biotic markers
Diatoms
Analysis of fossil diatom compositions showed the first major change in assemblages at 313.4 cm cd (1247 CE), with a second pronounced shift at 42.0 cm cd (1977 CE) (Figure 16) (Kuwae et al., 2022a). Unprecedented increases in diatom concentration were recorded first at 46.6 cm cd (1971 CE). The best quantitative inference models to estimate air temperature from sedimentary diatom assemblages used a weighted-average partial least squares (WA-PLS) regression (see “Air temperature reconstructions” in Supplemental Materials) and exhibited a moderate explanatory power (r2boot = 0.49), low RMSEboot (0.25°C), and modest mean biasboot (−0.02°C) for spring air temperature (Supplemental Table 4, Supplemental Figure 18). These reconstructions suggested that prior to 65.2 cm cd (1950 CE), spring temperature ranged 9.9°C–11.6°C (Figure 16), whereas values exceeded this range for the first time at 44.3 cm cd (1974 CE).
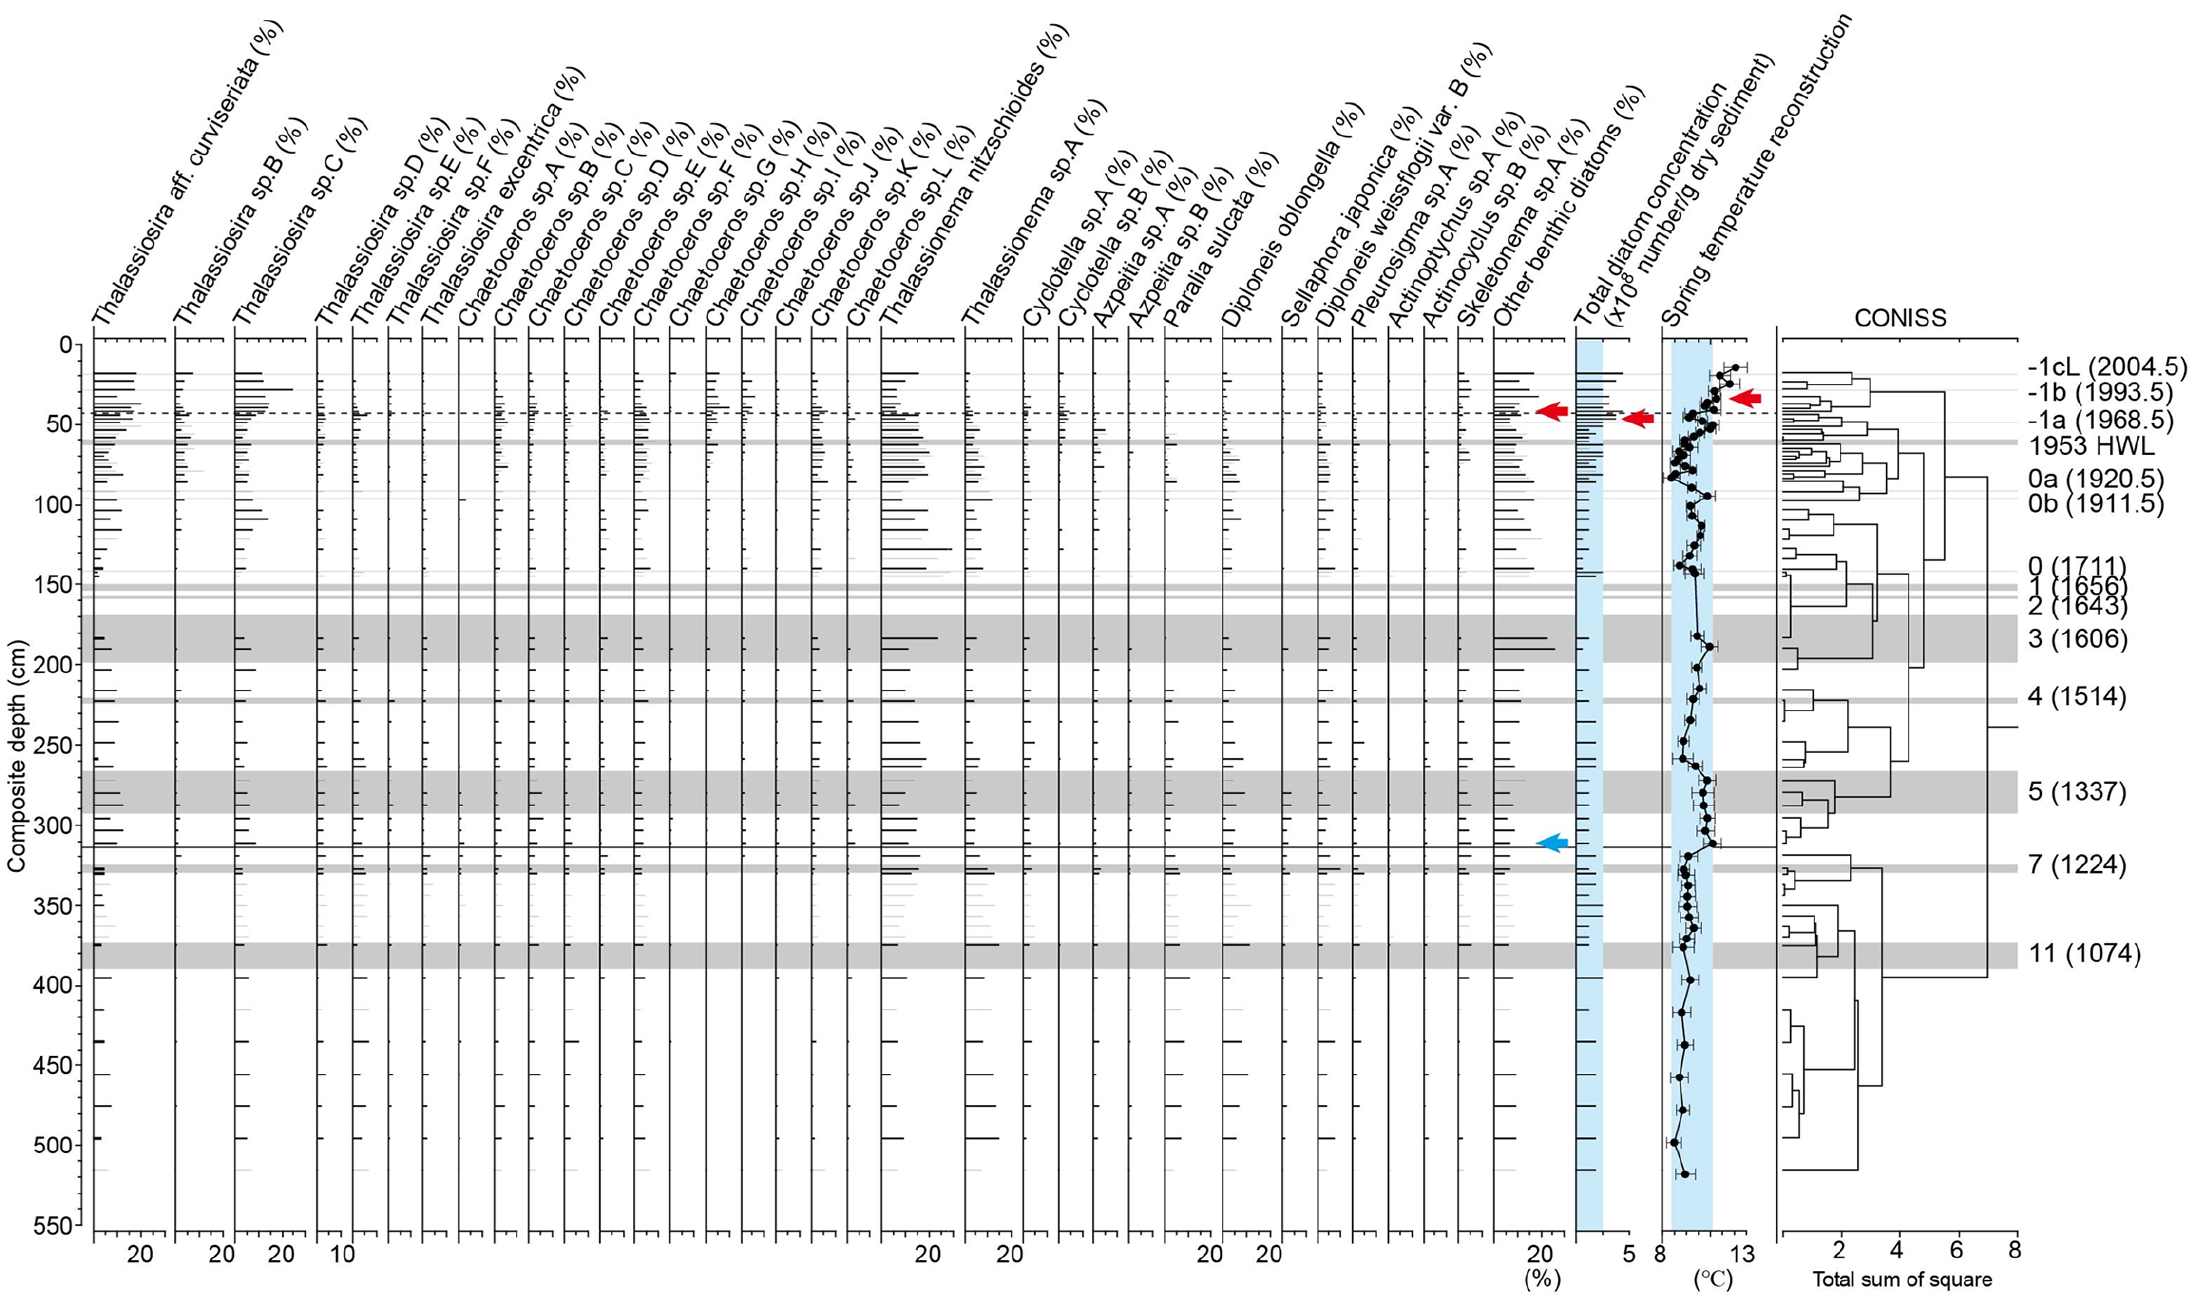
Depth profile of diatom species compositions, diatom frustule concentrations, and diatom-inferred spring air temperatures. For descriptions of figure details, see the caption for Figure 14. Vertical blue shade is the range of the data below Event 0a. Data of the compositions from Kuwae et al. (2022a). Reproduced in color in online version.
Discussion
Confidence of varve-counting chronology for BMC21 S1 cores
Using a combination of precisely-timed hydrological events and careful lamination counts we established a reliable varve chronology for both BMC21 cores. The varve chronology-based 1964 layer is consistent with the patterns of fallout maximum for 137Cs seen in cores BMC 21 S1-5 and BMC19 S1-3. Similarly, the observed ages of a rapid increase in 239Pu+240Pu in 1954 CE and 137Cs in 1959 CE were coincident with the historical observations of these radionuclides (Hancock et al., 2014) (Figure 6 and Supplemental Figure 19c). Double peaks of 239Pu+240Pu in the observed records (1959 CE and 1963 CE) (Hancock et al., 2014) were clearly visible and seen without time lag in the cores (Figure 6). These lines of evidence indicated that the varve chronology in the Beppu Bay sediments is highly reliable and accurate during the mid-20th century and that the sediments record deposition of radionuclides derived from global atmospheric fallout. Further, the 137Cs profile also records a minor peak in sediments corresponding to 2011 (Figure 8), a pattern consistent with the deposition of radiation from the Fukushima nuclear power plant accident. In contrast, the small peak of 239Pu+240Pu in the 1990 CE layer might be derived from the Chernobyl accident in 1987 CE, implying that a few years of error remain in the varve chronology, possibly due to erosion of a few year-layers at the base of the Ev -1cL event. However, the levels dated in the mid 20th century have numerous time constraints, Ev 1949 HWL (0aU2), 1953 HWL, 1954 HWL, 1957 HWL (0aU1), 1959 HWL, 1964 HWV, and 1968 Hyuga-nada earthquake (-1a), supporting the low age uncertainty. Importantly, the 1953 HWL layer was formed due to the historical highest water level on 26 June, 1953 in the Oita River, the closest large catchment-served river to the core site, thereby providing a highly confident date to the candidate GSSP level proposed. Furthermore, the spikes of observed 240Pu/239Pu and 233U/236U ratios seen in the 1956–1957 CE layer (Figures 6 and 7) are consistent with the deposition of radioactive material transported by the North Equatorial Current and Kuroshio from nuclear test sites in the Pacific Proving Ground (PPG) in the Marshall Islands in March 1954 CE (Takahashi et al., 2022; Yokoyama et al., 2022).
A GSSP level for the Anthropocene in the Beppu Bay sequences
For consideration as a GSSP level, strata must be divisible into two geological time units, above and below the horizon. Overall, our analysis of anthropogenic signatures shows a sharp inflection at the 1953 HWL layer (64.6 cm in cd, 1953.5 CE), with a rapid increase above the layer; in contrast, very few prior anthropogenic fingerprints are recorded between the 1953 HWL layer and 620 BCE (837 cm in cd) (Figures 5 and 17). This rapid increase in the anthropogenic fingerprints within the geological strata illustrated the significant impacts of human activity on environments and marine ecosystems after 1953 CE. It is important to note that this timing is consistent with the onset of the Great Acceleration (Steffen et al., 2015), suggesting that this is a suitable defining horizon for the start of the Anthropocene.
Summary figure for the GSSP level. Right blue and red arrow denote a point of the initial increase or unprecedented values and the secondary change in the record. Vertical light blue shades denote pre-1950 or pre-1850 ranges of variations in the values below the event layer 0aU1 dated 1949 CE. Horizontal gray shade denotes the event layer 1953 HWL dated to 1953 CE, the base of which is the potential GSSP level. Orange circle in several panels denotes the same as the black circle in the corresponding depth, but enlarged in the horizontal scale.
We recommend that the GSSP level should be located at the base of the 1953 HWL layer (64.5 cm cd) at the Beppu Bay site because it not only provides geological evidence of the onset of the Great Acceleration but because: (1) The 1953 HWL layer is easily recognized in CT images in the deepest area of the bay (Supplemental Figure 7); (2) This level corresponds to the initial increases in long-lived global fallout marker, plutonium and uranium radionuclides, which allow the global correlation of the level; (3) This timing is consistent with that of the estimated historical GDP growth in Japan (Supplemental Figure 20) supporting the hypothesis that intense economic growth and population growth in Japan intensified human impacts on a variety of environments and ecosystems; (4) Variability in many key proxy indices exceeds the boundaries defined by the past 300 or 1300 years, including heavy metal concentrations (Pb, Zn, Cu, Hg, As), stable isotope values (δ13C, δ15N), diatom concentrations, and spring air temperatures, (5) Many novel materials were detected first around the level, and; (6) Lithological changes identified by ITRAX-derived elements and magnetic susceptibility, both of which are influenced by water contents in the sediments (see “Lithological changes” in the Supplemental Materials), were detected above this level.
The Beppu Bay site as a potential candidate of the Anthropocene GSSP
Beppu Bay sediments have several merits as a potential candidate for the Anthropocene GSSP. First, since the site has a multitude of diverse anthropogenic proxies for the last 2600 years, the sediments can demonstrate geological evidence of the onset of the Great Acceleration as the inflection point of rate of increase in the anthropogenic fingerprints from a single site. Second, 84 anthropogenic fingerprints from 73 marker records were detected, which provide diverse auxiliary markers. Third, Beppu Bay sediments record a global marker 239Pu+240Pu with an initial increase in 1953 CE and double peaks in 1959 and 1963, which are very consistent with observations of the global fallout (Figure 6). Third, although most of the proxies show (or will show) a transient spike in their profiles, the sediments also record long-term changes in stable nitrogen isotope ratios, eutrophication indices, and temperatures which have the potential to sustain the anthropogenic signature as long as humans persist in the use of fossil fuel and production of airborne-derived nitrogen. These proxy signatures might be utilized for future generations to perceive the Anthropocene as a geological time unit. Fourth, historical dramatic changes of anthropogenic land use (urbanization, industrialization, agriculture, afforestation) after 1950 have been elucidated by GIS analysis of the surrounding catchment areas (Supplemental Figure 21), which supports occurrences of the resultant diverse sedimentary fingerprints, including the rapid increases in SCPs, microplastics, PCBs, heavy metal contents, and pollen grains of Cryptomeria japonica, eutrophication, and hypoxia. Regional history may therefore also inform the assisting the inferences behind the signatures (Figure 17). Fifth, the Beppu Bay sediments track the globally wide-spread marine ecological degradation during the mid-20th century (Yasuhara et al., 2012) as seen in the diverse plankton communities (e.g., an initial major change in pigment concentrations in 1950 CE); and track the pervasiveness of the technofossils as seen in the first occurrence of microplastics (1954 CE), an important globally ubiquitous component of technosphere (Leinfelder and Ivar Do Sul, 2019). Finally, the Beppu Bay sediments provide geological evidence of the onset of the nitrogen cycle change. Unprecedentedly high values of δ15N of fish scales relative to the last 290 years before 1953 are attributed to the increased supply of terrestrial denitrification-derived 15N-rich reactive nitrogen into the coastal waters due to increased use of airborne-derived nitrogen fertilizer by farms. This process fundamentally altered the nitrogen cycle in the atmosphere, geosphere, ocean, and biosphere of the planet through transport of reactive nitrogen, causing the most fundamental changes in planetary nitrogen biogeochemistry within the past 2.5 billion years (Canfield et al., 2010). Beppu Bay sediments record the onset of the nitrogen cycle change in 1953 CE, which is located at the proposed Anthropocene GSSP level.
Conclusion
Of the dataset of 99 proxies, 52 anthropogenic markers reported previously and 11 new markers (129I/127I, δ13C, δ15N, and percent modern 14C using fish scales, Re/Mo, Mo/U, lead isotopes, ITRAX-based element contents, and magnetic susceptibility) demonstrated that the cumulative number of occurrences of the anthropogenic fingerprint (N = 86) reveal an unprecedented increase above the level at 64.6 cm (1953.5 CE). The level was located close to that of an initial increase in global fallout of 239Pu+240Pu as a global primary marker. Also, the level coincided with those of several key anthropogenic fingerprints including the initial increase in global fallout of 236U/238U and 137Cs, the nitrogen and carbon cycle change suggested by δ15N and δ13C, elevated pollution of heavy metals such as Pb and Hg, the first deposition of microplastics, the initial increase in SCPs and PCBs. The initial detected anthropogenic signatures were followed by further diverse anthropogenic events, including a rapid increase in percent modern 14C in anchovy fish scales, enhanced deposition of novel materials (DDE, TIPPP, microplastics, SCPs, and BDE), occurrence of hypoxia (Re/Mo, Mo/U ratio, total sulfur), eutrophication (concentrations in Br, Ni, biogenic opal, TOC, TN, diatoms, dinoflagellates, Thecamoeba, Ciliate, chrolophyll a, SCEs, carotenoids), unprecedented plankton and benthos community changes (carotenoid compositions, diatom compositions, dinoflagellate compositions, other palynomorph compositions including benthic foraminifera, Acritarcha, ciliates, Thecaneoeba), abnormally high spring air temperatures, and lithological changes. The onset of the explosion of the anthropogenic fingerprints after 1953 CE is coeval with that of the accelerated GDP in Japan as well as the onset of the Great Acceleration. Collectively, the base of the 1953 flood layer (1953 HWL) provides geological evidence of the onset of the Great Acceleration and the precise date (26 June 1953), is close to the level of the initial increase of 239Pu+240Pu, and therefore will allow for global correlation. Thus, we propose the base of the layer as the best level of the Anthropocene GSSP. We suggest Beppuwanian as the stage name.
Supplemental Material
sj-docx-1-anr-10.1177_20530196221135077 – Supplemental material for Beppu Bay, Japan, as a candidate Global boundary Stratotype Section and Point for an Anthropocene series
Supplemental material, sj-docx-1-anr-10.1177_20530196221135077 for Beppu Bay, Japan, as a candidate Global boundary Stratotype Section and Point for an Anthropocene series by Michinobu Kuwae, Bruce P Finney, Zhiyuan Shi, Aya Sakaguchi, Narumi Tsugeki, Takayuki Omori, Tetsuro Agusa, Yoshiaki Suzuki, Yusuke Yokoyama, Hirofumi Hinata, Yoshio Hatada, Jun Inoue, Kazumi Matsuoka, Misaki Shimada, Hikaru Takahara, Shin Takahashi, Daisuke Ueno, Atsuko Amano, Jun Tsutsumi, Masanobu Yamamoto, Keiji Takemura, Keitaro Yamada, Ken Ikehara, Tsuyoshi Haraguchi, Stephen Tims, Michaela Froehlich, Leslie Keith Fifield, Takahiro Aze, Kimikazu Sasa, Tsutomu Takahashi, Masumi Matsumura, Yukinori Tani, Peter R Leavitt, Hideyuki Doi, Tomohisa Irino, Kazuyoshi Moriya, Akira Hayashida, Kotaro Hirose, Hidekazu Suzuki and Yoshiki Saito in The Anthropocene Review
Supplemental Material
sj-docx-2-anr-10.1177_20530196221135077 – Supplemental material for Beppu Bay, Japan, as a candidate Global boundary Stratotype Section and Point for an Anthropocene series
Supplemental material, sj-docx-2-anr-10.1177_20530196221135077 for Beppu Bay, Japan, as a candidate Global boundary Stratotype Section and Point for an Anthropocene series by Michinobu Kuwae, Bruce P Finney, Zhiyuan Shi, Aya Sakaguchi, Narumi Tsugeki, Takayuki Omori, Tetsuro Agusa, Yoshiaki Suzuki, Yusuke Yokoyama, Hirofumi Hinata, Yoshio Hatada, Jun Inoue, Kazumi Matsuoka, Misaki Shimada, Hikaru Takahara, Shin Takahashi, Daisuke Ueno, Atsuko Amano, Jun Tsutsumi, Masanobu Yamamoto, Keiji Takemura, Keitaro Yamada, Ken Ikehara, Tsuyoshi Haraguchi, Stephen Tims, Michaela Froehlich, Leslie Keith Fifield, Takahiro Aze, Kimikazu Sasa, Tsutomu Takahashi, Masumi Matsumura, Yukinori Tani, Peter R Leavitt, Hideyuki Doi, Tomohisa Irino, Kazuyoshi Moriya, Akira Hayashida, Kotaro Hirose, Hidekazu Suzuki and Yoshiki Saito in The Anthropocene Review
Supplemental Material
sj-docx-3-anr-10.1177_20530196221135077 – Supplemental material for Beppu Bay, Japan, as a candidate Global boundary Stratotype Section and Point for an Anthropocene series
Supplemental material, sj-docx-3-anr-10.1177_20530196221135077 for Beppu Bay, Japan, as a candidate Global boundary Stratotype Section and Point for an Anthropocene series by Michinobu Kuwae, Bruce P Finney, Zhiyuan Shi, Aya Sakaguchi, Narumi Tsugeki, Takayuki Omori, Tetsuro Agusa, Yoshiaki Suzuki, Yusuke Yokoyama, Hirofumi Hinata, Yoshio Hatada, Jun Inoue, Kazumi Matsuoka, Misaki Shimada, Hikaru Takahara, Shin Takahashi, Daisuke Ueno, Atsuko Amano, Jun Tsutsumi, Masanobu Yamamoto, Keiji Takemura, Keitaro Yamada, Ken Ikehara, Tsuyoshi Haraguchi, Stephen Tims, Michaela Froehlich, Leslie Keith Fifield, Takahiro Aze, Kimikazu Sasa, Tsutomu Takahashi, Masumi Matsumura, Yukinori Tani, Peter R Leavitt, Hideyuki Doi, Tomohisa Irino, Kazuyoshi Moriya, Akira Hayashida, Kotaro Hirose, Hidekazu Suzuki and Yoshiki Saito in The Anthropocene Review
Supplemental Material
sj-xlsx-4-anr-10.1177_20530196221135077 – Supplemental material for Beppu Bay, Japan, as a candidate Global boundary Stratotype Section and Point for an Anthropocene series
Supplemental material, sj-xlsx-4-anr-10.1177_20530196221135077 for Beppu Bay, Japan, as a candidate Global boundary Stratotype Section and Point for an Anthropocene series by Michinobu Kuwae, Bruce P Finney, Zhiyuan Shi, Aya Sakaguchi, Narumi Tsugeki, Takayuki Omori, Tetsuro Agusa, Yoshiaki Suzuki, Yusuke Yokoyama, Hirofumi Hinata, Yoshio Hatada, Jun Inoue, Kazumi Matsuoka, Misaki Shimada, Hikaru Takahara, Shin Takahashi, Daisuke Ueno, Atsuko Amano, Jun Tsutsumi, Masanobu Yamamoto, Keiji Takemura, Keitaro Yamada, Ken Ikehara, Tsuyoshi Haraguchi, Stephen Tims, Michaela Froehlich, Leslie Keith Fifield, Takahiro Aze, Kimikazu Sasa, Tsutomu Takahashi, Masumi Matsumura, Yukinori Tani, Peter R Leavitt, Hideyuki Doi, Tomohisa Irino, Kazuyoshi Moriya, Akira Hayashida, Kotaro Hirose, Hidekazu Suzuki and Yoshiki Saito in The Anthropocene Review
Footnotes
Acknowledgements
Analysis of the Beppu Bay core was facilitated by the collaborative research project between the Center for Marine Environmental Studies, Ehime University, and the Anthropocene Working Group (AWG) to ratify the stratigraphic Anthropocene. We would like to acknowledge the Haus der Kulturen der Welt (HKW, Berlin) for collaborating with the Anthropocene Working Group in the assessment of the candidate GSSP sites. The collaboration was realized in the framework of HKW’s long-term initiative Anthropocene Curriculum, an international project for experimental forms of Anthropocene research and education developed by HKW and the Max Planck Institute for the History of Science (MPIWG, Berlin) since 2013. We thank Hidejiro Onishi of R/V Isana, Ehime University and the crew of R/V Tansei-maru (cruises KT-05-28 and KT-09-1) of the Ocean Research Institute, The University of Tokyo for sampling.
Funding
The author(s) disclosed receipt of the following financial support for the research, authorship, and/or publication of this article: The cooperative research program (Accept. No. 08B033, 09B043, 15A035, 15B058, and 19A007) of the Center for Advanced Marine Core Research, Kochi University also supported this study. This study was supported financially by Grants-in-Aid for Scientific Research (grant numbers 22340155, 21244073, 16H02232, 17K20045, 17H02959, 19H04284, 20H00646, and 21H01170) from the Japan Society for the Promotion of Science, Environment Research and Technology Development Fund (JPMEERF18S20320) of the Environmental Restoration and Conservation Agency of Japan and a research grant from the Mitsui & Co., Ltd. Environment Fund, no. R09-B022. LaMer in CMES was also financially supported for this study.
Supplemental material
Supplemental material for this article is available online.
References
Supplementary Material
Please find the following supplemental material available below.
For Open Access articles published under a Creative Commons License, all supplemental material carries the same license as the article it is associated with.
For non-Open Access articles published, all supplemental material carries a non-exclusive license, and permission requests for re-use of supplemental material or any part of supplemental material shall be sent directly to the copyright owner as specified in the copyright notice associated with the article.