
Abstract
The short sediment core EMB201/7-4 retrieved from the East Gotland Basin, central Baltic Sea, is explored here as a candidate to host the stratigraphical basis for the Anthropocene series and its equivalent Anthropocene epoch, still to be formalized in the Geological Time Scale. The core has been accurately dated back to 1840 CE using a well-established event stratigraphy approach. A pronounced and significant change occurs at 26.5 cm (dated 1956 ± 4 CE) for a range of geochemical markers including 239+240Pu, 241Am, fly-ash particles, DDT (organochlorine insecticide), total organic carbon, and bulk organic carbon stable isotopes. This stratigraphic level, which corresponds to a change in both lithology and sediment colour related to early anthropogenic-triggered eutrophication of the central Baltic Sea, is proposed as a Global boundary Stratotype Section and Point for the Anthropocene series.
Keywords
Introduction
Semi-enclosed basins such as the Baltic Sea are highly impacted by anthropogenic pressures in their catchment areas. Well-known consequences of human-driven eutrophication impacts on the Baltic Sea ecosystem are water deoxygenation and the spread of hypoxic or ‘dead’ zones in deep basins and coastal areas (Andersen et al., 2017; Carstensen et al., 2014; Gustafsson et al., 2012; Reusch et al., 2018). Eutrophication is defined as the enrichment of water by nutrients (nitrogen, phosphorus), which causes an accelerated growth of algae and plants that produce an undesirable disturbance in the balance of organisms present in the water and to the quality of the water concerned (OSPAR, 1998). It reduces the amount of oxygen in water due to the decomposition of sinking organic material by oxygen-consuming bacteria, and can eventually lead to benthic ecosystem collapses.
Because of eutrophication, the East Gotland Basin (EGB; 249 m water depth at its deepest point), located in the central Baltic Sea, has been almost permanently hypoxic below 80 m (i.e. water oxygen concentration <2 ml l−1) since the 1950s, and even euxinic in its deepest part (Carstensen et al., 2014; Gustafsson et al., 2012). The expansion of oxygen-deficient bottom waters in the central Baltic Sea is interrupted for a few months only during Major Baltic Inflows (MBIs), which are intrusions of oxygen-rich waters from the North Sea (Dellwig et al., 2018; Mohrholz, 2018). MBIs are occasional and occur only when long-lasting easterly winds causing a below-normal Baltic sea level are followed by strong westerly winds (Mohrholz et al., 2015). These inflow events are recorded in sediments through the formation of Mn carbonate (or Ca-rich rhodochrosite) and/or through significant increase in specific trace metals such as Co and V (Dellwig et al., 2019, 2021). Except for these mm-thick Mn carbonate-rich layers, a hemipelagic type of sedimentation with a high content of organic carbon (5%–18%) and relatively high sedimentation rates (0.3–0.5 cm yr−1) has prevailed in the EGB since 1950 CE (Ilus et al., 2007; Kaiser et al., 2020; Lin et al., 2021; Struck et al., 2001). The mean sinking velocity of particles (diatoms) has been estimated at around 15 to 70 m d−1 (Passow, 1991), which means a particle at the sea surface needs 3 to 16 days to reach the seabed of the EGB. Anoxic conditions in bottom waters of the EGB prevent benthic colonization and bioturbation, and enable the formation of mm-scale laminated sediments in an undisturbed stratigraphic sequence after 1950 CE (Ilus et al., 2007). In contrast to annually or seasonally laminated lake sediments, multiple laminations in Baltic Sea sediments are not annual but controlled by several factors so the composition of single laminae also varies (Brenner, 2001; Lepland and Stevens, 1998; Sohlenius and Westman, 1998). Before the mid-20th century, the sediment is grey, homogeneous and silty-clayey. Recent sediments (<180 years) from the EGB are thus well-suited to record precisely and continuously the natural and anthropogenic development of the Baltic Sea and its catchment area. Here, we show that the Baltic Sea represents a high quality candidate to host the onset of the Anthropocene via selection of a Global boundary Stratotype Section and Point (GSSP) for the base of the Anthropocene, that would comprise both a geochronological unit (an Anthropocene epoch) and a chronostratigraphic unit (an Anthropocene series) (Head et al., 2021). The preparatory activities of the Anthropocene Working Group, including events leading to the submission of GSSP proposals and the binding decision that the base of the Anthropocene should align with stratigraphic signals dating to the mid-20th century, are detailed in the introductory article to this special issue (Waters et al., 2023).
Materials and methods
Geographic settings
The Baltic Sea, the world second largest brackish sea, is a shallow, marginal sea with a mean depth of 55 m, and is characterized by an estuarine-like circulation (Elken and Matthäus, 2008). The upper water layer (0–60 m) has low salinities (7–8 g kg−1) caused by high freshwater inputs by rivers in the eastern and northern parts of the drainage basin. As a counterpart, relatively high-salinity water from the North Sea flows in through the Danish Straits. This dense water spreads into deep layers and causes a strong vertical salinity gradient in the central Baltic Sea, with a pronounced halocline around 60–80 m depth. The inflow of saline waters is balanced by upwelling, diapycnal mixing and the outflow of brackish water in surface layers. The catchment area of the Baltic Sea covers 1.7 million km2, that is more than four times the area of the Baltic Sea itself (369,000 km2), and is drained by >200 rivers (Håkanson et al., 2003; Snoeijs-Leijonmalm and Andrén, 2017). About 85 million people live within the Baltic Sea catchment area, and 18% of them within 10 km of the coast (HELCOM, 2010). Agriculture land areas are concentrated mainly in the southern part of the drainage basin, where they occupy >65% of the land area (Snoeijs-Leijonmalm and Andrén, 2017).
Field collection, core scanning, and sampling
Sediment core EMB201/7-4 (57°16.980′N, 020°07.228′E; 241 m water depth; Figure 1) was recovered from the EGB on December 6, 2018, during expedition EMB201 on board the research vessel Elisabeth Mann Borgese. The coring site was located in the exclusive economic zone of Latvia. A multicorer, equipped with 60 cm-long polyvinyl chloride tubes, was used as this coring device keeps the water-sediment interface undisturbed. The 45 cm-long core was opened lengthwise on board and kept refrigerated (4°C) in the core repository of the Leibniz Institute for Baltic Sea Research (IOW, Germany). Both core halves were scanned at the IOW with an ITRAX X-ray fluorescence (XRF) scanner (Cox Analytical Systems) equipped with a Cr tube operated at 30 kV and 55 mA (exposure time of 5 s) with a 200 μm resolution (Supplemental Table S1). X-ray radiography was recorded at 60 kV and 30 mA, with an exposure time of 225 ms, and at a 200 µm resolution, to identify variations in density along the sediment core. In June 2020, one half of the sediment core was sampled at the IOW in an enclosed laminar flow workstation to prevent airborne contamination. Due to the high water content of recent sediments in the upper part of the core, and to guarantee sufficient amount of sediments for all analyses, the sampling strategy included slicing the core every 1 cm from 0 to 27 cm depth, and every 0.5 cm from 27 to 45 cm depth. This resulted in a total of 63 samples, which were freeze-dried and homogenized before analysis. The second half of the core is kept in the IOW repository as an archive.
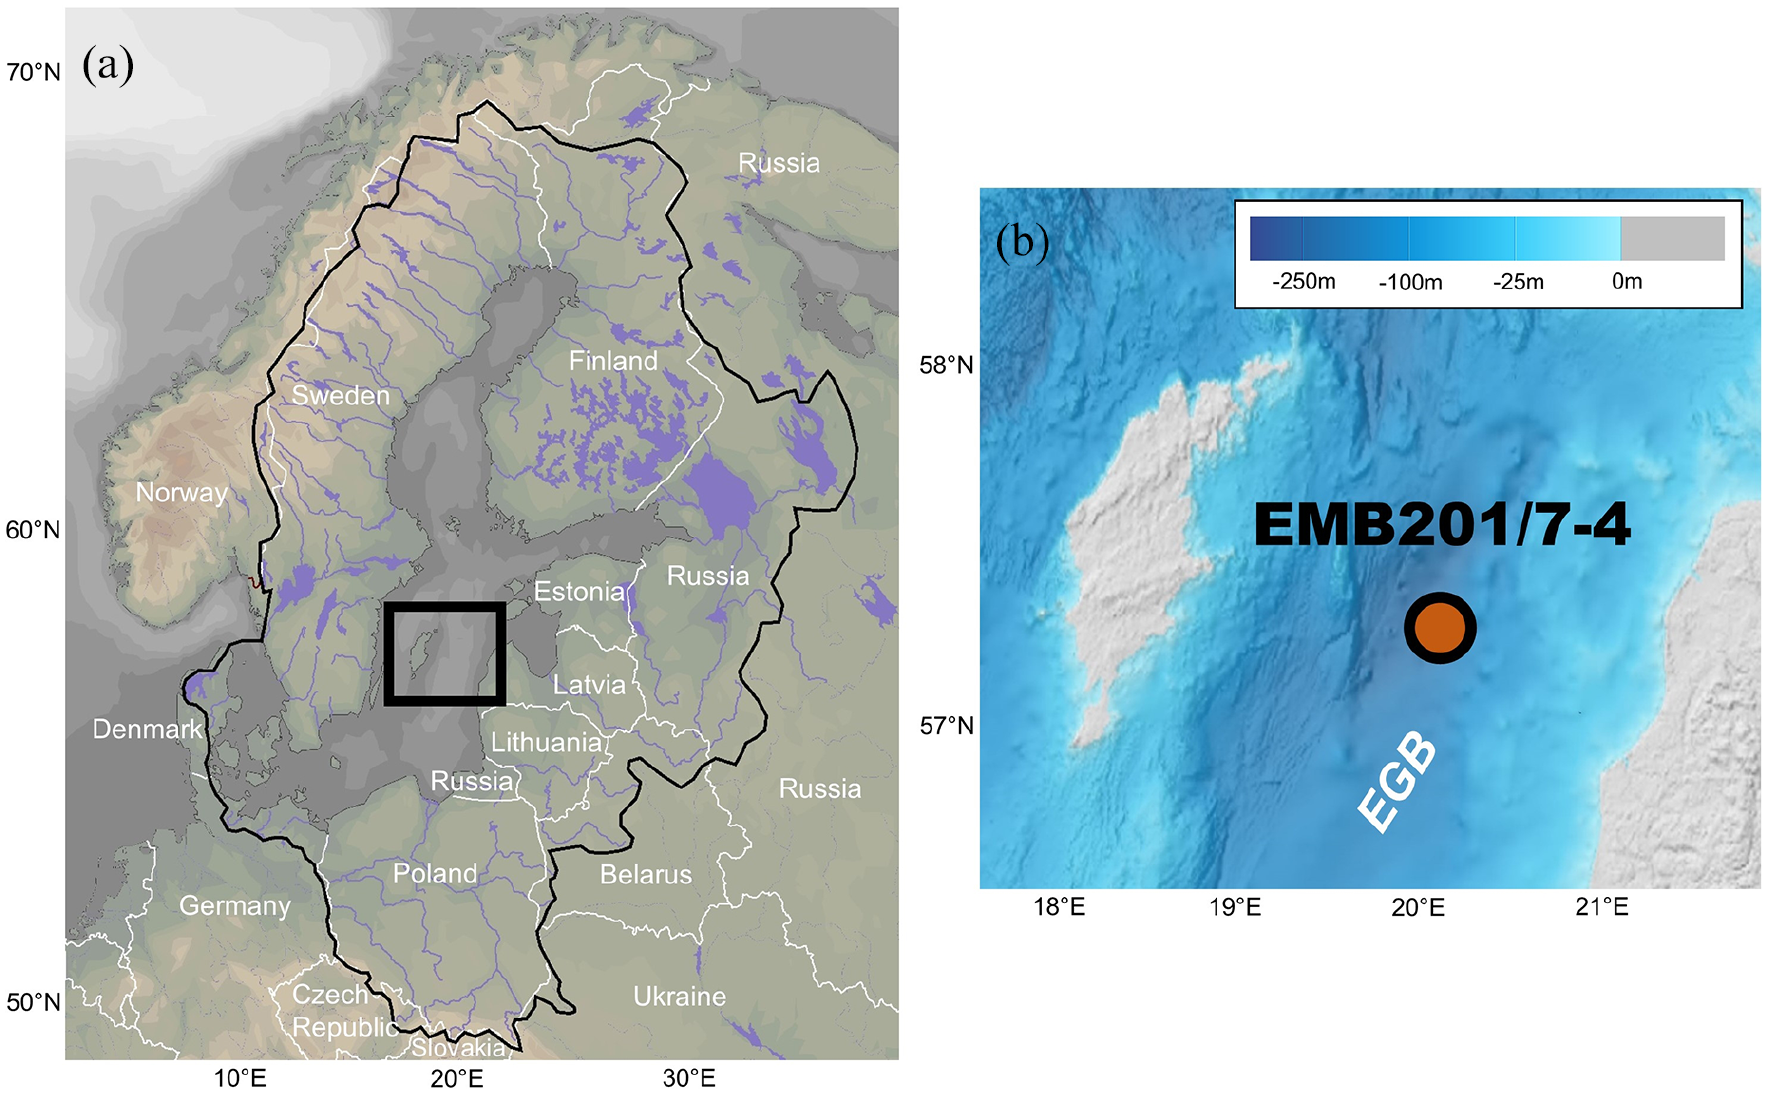
(a) Study area (black rectangle) in the Baltic Sea; the countries, main lakes and rivers of the catchment area – delimited by a bold line – are shown; (b) bathymetric chart (Baltic Sea Bathymetry Database) of the study area with the location of core EMB201/7-4 in the East Gotland Basin (EGB). Reproduced in colour in online version.
Chronological control
An event stratigraphy approach has been developed to accurately date Baltic Sea recent sediments (Dellwig et al., 2018, 2021; Kaiser et al., 2020; Lin et al., 2021). This method was applied with modifications in the present study to establish the age model of core EMB201/7-4. Artificial radionuclides (239+240Pu, 241Am, 137Cs) here were not used as time markers, but as Anthropocene proxies, except 137Cs for the Chernobyl accident in 1986 (see below).
Anthropocene proxies
Relevant proxies used to define the onset of the Anthropocene epoch follow recommendations from Zalasiewicz et al. (2019).
241Am, 137Cs and 210Pb
Artificial radionuclides 210Am, 137Cs and natural 210Pb were analysed at the IOW, Germany, by gamma spectrometry with a Ge-well detector (GCW4021-7500SL-RDC-6-ULB). Raw data were then processed with GENIE 2000 software (Canberra Industries Inc., USA). Counting statistics were better than 5%–10% for 210Pb and 137Cs and better than 20% for 241Am activities, respectively. The radionuclide activities were calculated using the following standard reference materials (decay-corrected): IAEA-447 (137Cs, 210Pb, 226Ra), IAEA-384 (241Am) and IAEA-385 (241Am, 137Cs, 226Ra). The energies used for quantification of isotopes were 46.5 keV for 210Pb, 295 keV and 351 keV for 226Ra, 59.5 keV for 241Am, and 661 keV for 137Cs (Moros et al., 2017). A total of 49 samples was analysed, that is all samples between 0 and 31.5 cm and every second sample between 32 and 44.5 cm (Supplemental Table S2).
238Pu, 239Pu and 240Pu
Pu isotopes were analysed at the GAU-Radioanalytical Laboratories of the University of Southampton, UK. Briefly, sediment samples (n = 20; Supplemental Table S2) were transferred to glass beakers and ignited at 450°C to remove organic matter. The remaining inorganic fraction was spiked with 242Pu chemical recovery tracer, mixed with lithium metaborate flux and fused at 1100°C to achieve a homogeneous melt. The obtained liquid glass was then quenched in deionised water and the resulting solidified glass was dissolved in 8M HNO3 at 90°C (overnight). The resulting solution was cooled to room temperature and the precipitated boric acid, resulting from the added flux, was filtered off using a GF/A filter paper. Pu was pre-concentrated from the sample solution by means of co-precipitation with Fe(OH)3 at pH 5–6. The precipitate was separated by centrifuging and re-dissolved in 9M HCl. These solutions were transferred to anion exchange columns, previously pre-conditioned with 9M HCl. Pu was retained on the columns and was purified by sequential washes with 9M HCl, 8M HNO3 and again with 9M HCl. Finally, the Pu fraction was eluted to pre-cleaned beakers using 0.1M NH4I/9M HCl solution. The solution was evaporated to dryness with HNO3 added to remove excess iodine present and thin alpha spectrometric sources were prepared by electrodeposition. Each source was then counted using Octete (Ortec/Amtek) alpha spectrometers equipped with passivated implanted planar silicon (PIPS) detectors. The resulting spectra were analysed using Maestro spectral analysis software. Following counting, 240Pu/239Pu ratios were determined using a Thermo Scientific Neptune Plus MC-ICP-MS after radiochemical re-purification of the Pu alpha spectrometry discs (Łokas et al., 2022).
Radiocarbon (14C)
14C was analysed by accelerator mass spectrometry (AMS) at the ETH Zürich, Switzerland. Sediment samples (n = 20; Supplemental Table S2) were selected between 1 and 31 cm depth, where the highest 14C activity was expected. Each sample (0.1–0.3 g) was subject to acid-base-acid treatment (Hajdas, 2008; Hajdas et al., 2021). Briefly, in the first acid step bulk sediment was decarbonated with 0.5M HCl to remove inorganic carbon. After a washing to neutral with MilliQ water the decarbonated sediment was treated with 0.1M NaOH. The liquid was extracted and a few ml of 0.5 M HCl were added to precipitate the base-extracted organic fraction (or humic acid fraction), and freeze-dried. The residue, that is, the base-insoluble organic fraction (or humin fraction), was washed to neutral, treated with 0.5M HCl, washed again to neutral, and freeze-dried. Both fractions were weighed into Al cups for combustion in an elemental analyser (Vario Micro Cube; Elementar) and subsequent graphitization (Němec et al., 2010). The graphite powder was pressed into the Al cathodes to measure 14C/12C and 13C/12C ratios using the AMS system of MICADAS (Synal et al., 2000; Wacker et al., 2010). Results are reported as fraction modern F14C (Reimer et al., 2004) and radiocarbon ages (Before Present, BP, where 0 BP = 1950 CE; (Stuiver and Polach, 1977). For an overview of the method and data reporting see Hajdas et al. (2021).
Fly-ash
Spheroidal carbonaceous fly-ash particles (SCPs) were analysed at University College London, UK (Rose, 1994). Briefly, sediments (0.2 g; n = 52; Supplemental Table S2) were subjected to sequential chemical attack by mineral acids to remove unwanted fractions leaving a suspension of mainly carbonaceous material in water. A known fraction of this final suspension was evaporated onto a coverslip and mounted onto a microscope slide. SCPs were then counted using a light microscope at x450 magnification and the sediment content calculated in units of SCPs per gram of sediment dry weight (SCPs g−1 dw). The criteria for SCP identification under the light microscope followed (Rose, 2008). The detection limit for the technique is typically ca. 100 SCPs g−1 dw and accuracy is ca. ±45 SCPs g−1 dw (Rose, 2008) although detection limits were slightly higher in this core (ca. 300 SCPs g−1 dw). SCPs were sub-divided into size classes during counting. Analytical blanks and SCP reference material were included in duplicate and triplicate, respectively. Reference materials agreed closely with expected values (6005 ± 70 SCPs g−1 dw), while no SCPs were observed in blanks. SCPs were not analysed between 2 and 9 cm due to the low amount of available sediment.
Microplastics
Microplastics (MPs) sampling strategy aimed to maximize MP particles recovery by merging consecutive layers in the core to reach a minimum of ca. 1 g sediment dw, resulting in a total of 20 samples (Supplemental Table S2). Potential MPs (particle size between 11 µm and 5 mm) were extracted and isolated from sediments at the IOW, Germany, following a well-established protocol (Enders et al., 2020). Briefly, sediments were submitted to a density separation by using sodium polytungstate (1800 kg m3), which allows all plastic particles to float, and digested with 30% H2O2 to eliminate organic particles. The method recovery rate has been estimated at 80%. Automated particle-based analysis was performed at the Biological Institute Helgoland (BAH) of the Alfred Wegner Institute, Helmholtz Centre for Polar and Marine Research, Germany, following a well-established protocol (Primpke et al., 2018). Purified samples were submitted to a second density separation and digestion steps (Abel et al., 2021) to disaggregate flocculates and eliminate potential biofilm immediately before micro-Fourier transform infrared spectroscopic analysis (µFTIR; Hyperion 3000m, Bunker Optics GmbH). This technique measured 100% of remaining particles in each sample to ensure all potential MP particles could be associated to a specific polymer type, or excluded from being classified as plastic. Both extraction and spectroscopic analysis followed protocols to prevent contamination during all steps, including processing blanks to allow estimation of false-positive MP particles that were excluded from final results after interpretation. Contamination from the core tube was not observed.
Persistent organic pollutants and biomarkers
Polycyclic aromatic hydrocarbons (PAHs), dichlorodiphenyltrichloroethane (DDT) and biomarkers (sterols) were analysed at the IOW, Germany (Kaiser and Lerch, 2022; Kanwischer et al., 2020). Briefly, homogenized sediments (0.3–0.8 g dw; n = 62; Supplemental Table S2) were extracted with a DCM:MeOH mixture using an Accelerated Solvent Extraction device (Dionex™ASE™ 350; Thermo Fisher Scientific). After the addition of internal standards, the extracts were desulfurized with activated copper and separated into four fractions by microscale flash column chromatography using hexane (F1), hexane:DCM (F2), DCM (F3) and DCM:MeOH (F4) as eluting solvents (Kaiser and Arz, 2016). The F1 and derivatized F4 fractions were analysed by gas chromatography - mass spectrometry (GC-MS; Agilent Technologies 7890 B GC system and 5977 B Mass Selective Detector). PAHs, p,p′-DDD (1,1,-dichloro-2,2,-bis(p-chlorophenyl)ethane) and p,p′-DDE (1,1-dichloro-2,2-bis(chlorophenyl)ethylene) were identified by comparing retention time with certified external standards (DRE-L20950009CY and DRE-L18000014CY). PAHs and DDT, considered here as the sum of its two degradation products, p,p′-DDD and p,p′-DDE, were quantified using calibration curves based on six calibrator points and expressed as ΣPAH and ΣDDT. Brassicasterol (24-methylcholesta-5,22E-dien-3β-ol), tetrahymanol (gammaceran-3β-ol), coprostanol (5β-cholestan-3β-ol), epi-coprostanol, 5β-stigmastanol (24β-ethyl-5β-cholestan-3β-ol), and epi-5β-stigmastanol were identified by chromatographic and mass spectral comparison with published data. The analytical recovery was estimated at 90% and the limit of quantification to 5 ng g−1 sediment dw. Results were normalized to the total organic carbon content for each sample (µg gTOC−1).
Total carbon (TC), total organic carbon (TOC), total nitrogen (TN), and C/N ratio
Bulk sediment TC, TOC and TN were measured at the IOW, Germany (Müller and Voss, 1999; Voss et al., 2000). The samples (30 mg dw; n = 62; Supplemental Table S2) were analysed with a Carlo Erba Flash EA elemental analyser. TOC and TN were measured by weighing the sediment into Ag boats and treating it with 2N HCL until all carbonate compounds had reacted out. The sample was dried at 60°C, pelletized and measured. The calibration material for C and N analysis was acetanilide (Merck). The analytical precision was better than 1% for TC and TOC, and better than 4% for TN. The C/N ratio was defined as the molar ratio between TOC and TN: C/N = (TOC/12)/(TN/14). Data were not corrected for salt content due to the low salinity of the Baltic Sea (Snoeijs-Leijonmalm and Andrén, 2017).
Stable carbon (δ13C) and nitrogen (δ15N) isotopes
Bulk δ15N and δ13C were analysed at the IOW, Germany. Briefly, untreated and treated (acidified) fractions of sediments (n = 62; Supplemental Table S2) were analysed following Müller and Voss (1999) and Voss et al. (2000). The isotopic compositions were determined using flash combustion in a EA Isolink CN (Thermo Fisher Scientific) elemental analyser at 1020°C coupled via a ConFlo IV (Thermo Fisher Scientific) split interface to a Delta+ V advantage (Thermo Fisher Scientific) isotope ratio mass spectrometer. The isotopic values are reported relative to atmospheric N2 (δ15N) and Vienna PeeDee Belemnite (VPDB; δ13C). The reference materials used for stable isotope analysis were IAEA-N1, IAEA-N2, IAEA-N3, NBS 22, IAEA-CH-3 and IAEA-CH-6. The analytical precision for both stable isotope ratios was <0.2‰. To correct for the Suess effect, that is a change in δ13C by the admixture of large amounts of fossil-fuel derived CO2, the following equation (Schelske and Hodell, 1995; Verburg, 2007) was applied:

where y = year CE.
Inorganic geochemical markers
Sedimentary major and trace element contents and stable Pb isotopes were analysed at the IOW, Germany. Briefly, the sediments (100 mg dw; n = 62; Supplemental Table S2) were digested with a HNO3-HClO4-HF mixture in closed Teflon vessels at 180°C for 12 h and the residues were fumed-off 3-times with 6 M HCl and finally diluted with 2 vol% HNO3 (Dellwig et al., 2019). The content of Al was measured by inductively coupled plasma optical emission spectrometry (ICP-OES, iCAP 7400 Duo, Thermo Fisher Scientific) using external calibration and Sc as internal standard. Analytical precision and accuracy were estimated with the international reference material SGR-1b (USGS) and were better than 3.8% and −3.9%, respectively. Trace metals Cu, Pb (including 206Pb and 207Pb) and Zn were determined by inductively coupled plasma mass spectrometry (ICP-MS, iCAP Q, Thermo Fisher Scientific) coupled to a prepFAST system (Elemental Scientific) using He as collision gas, external calibration, and Rh and Ir as internal standards. Analytical precision and accuracy of concentration measurements were also checked with SGR-1b and were better than 3.3% and −3.4%, respectively. For stable Pb isotope ratios, NIST SRM-981 was used resulting in a precision and accuracy of 0.31% and −0.04%, respectively (Dellwig et al., 2021). Results were normalized to Al content for each sample to minimize dilution effects caused by organic matter, carbonate and/or opal. To determine Hg contents, sediments (100 mg dw; n = 63; Supplemental Table S2) were analysed with a Milestone DMA-80 EVO Direct Mercury Analyser by thermal decomposition at 750°C, gold amalgamation and atomic absorption spectrophotometry at 253.65 nm. Data were calibrated against the BCR 142R certified reference material and a Baltic Sea reference sediment. Analytical precision based on reference materials was better than 6%.
Numerical analysis
To detect positions of abrupt change (changepoints) within the different datasets, a modelling approach (Gallagher et al., 2011) was applied using the software Past v4.10 (Hammer et al., 2001). Before analysis, the datasets were interpolated every 1 cm, missing values were treated by linear interpolation, and mean and standard deviation were automatically normalized in order to equally weigh each dataset. The default value of 100,000 iterations (Markov chain Monte Carlo) was used and the number of changepoints set to n = 1 (Supplemental Table S3).
Results
Lithology
The lithology of core EMB201/7-4 was characterized by a pronounced visual transition at around 27 cm sediment depth (Figure 2). Between 45 and 27 cm depth the sediment was grey, relatively homogeneous, silty clay, with low organic carbon and water contents. Between 27 and 0 cm depth it was brown to dark brown and black, cm-thick layered and sometimes laminated, with high organic carbon and water contents. Note that, after oxidation, sediment colours change to dark grey below 27 cm and to brown to dark brown between 27 and 0 cm. The upper part of the core was also characterized by a few light grey, mm-thick, clayey to silty laminations mainly between 21 and 25 cm depth.
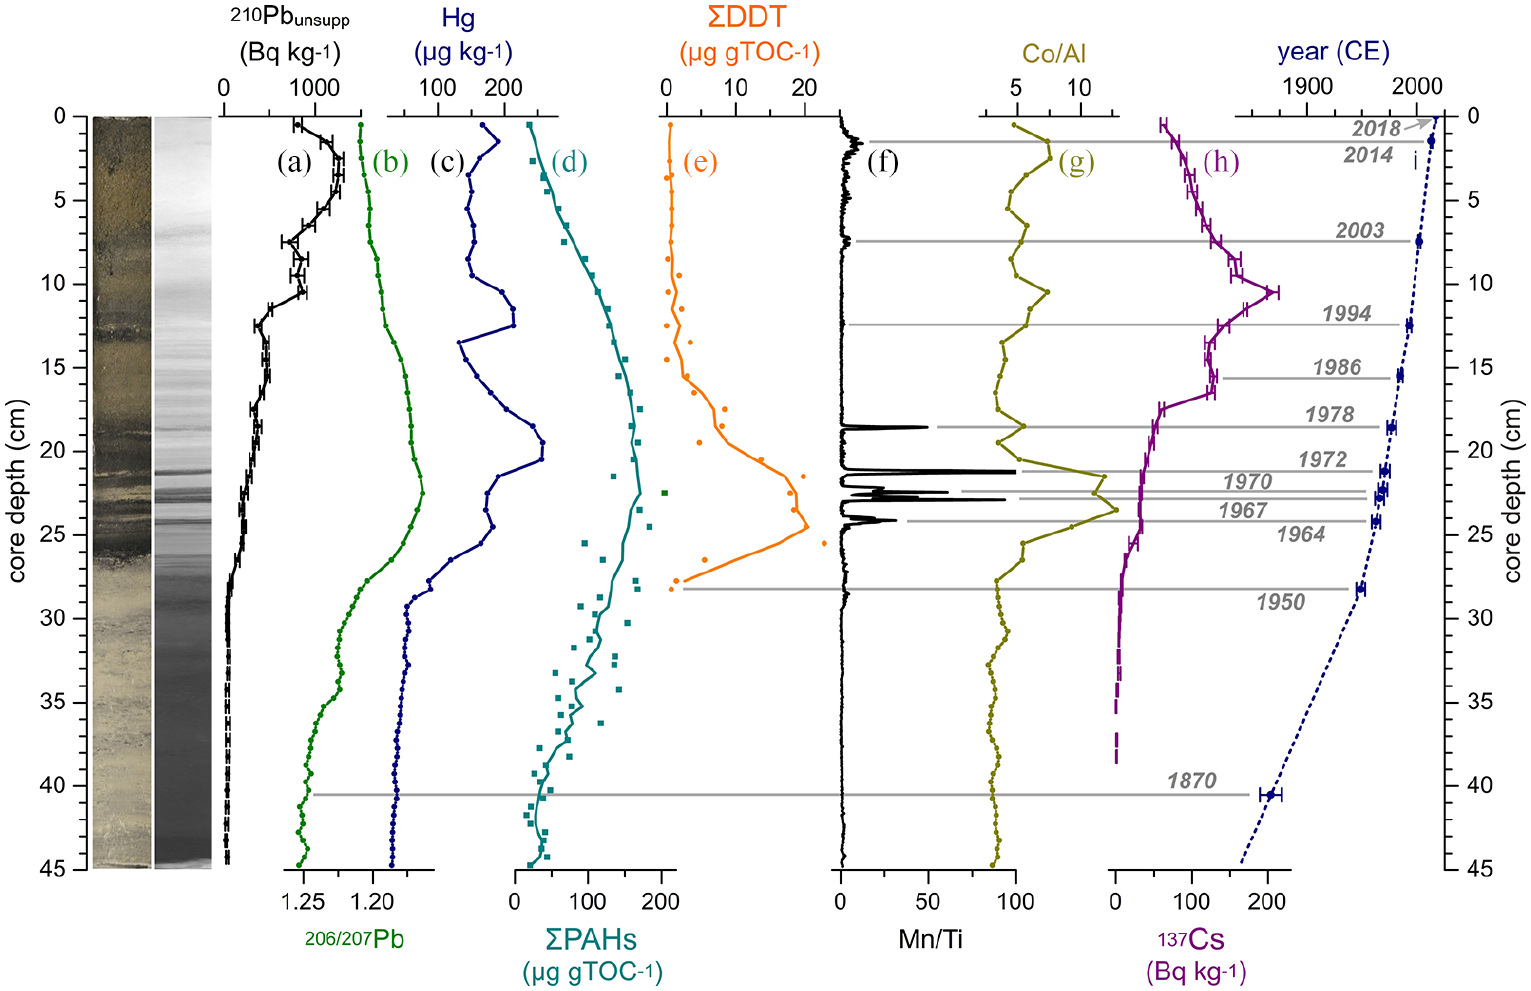
Pictures (true colour and radiography), depth profiles of 210Pbunsupp (a), 206/207Pb (b), Hg (c), ΣPAH (d) and ΣDDT (e) contents, Mn/Ti (f), Co/Al (g) and 137Cs (h), and age-depth relationship (i) of core EMB201/7-4. The assigned time markers are shown by horizontal grey lines and listed in Table 1. Reproduced in colour in online version.
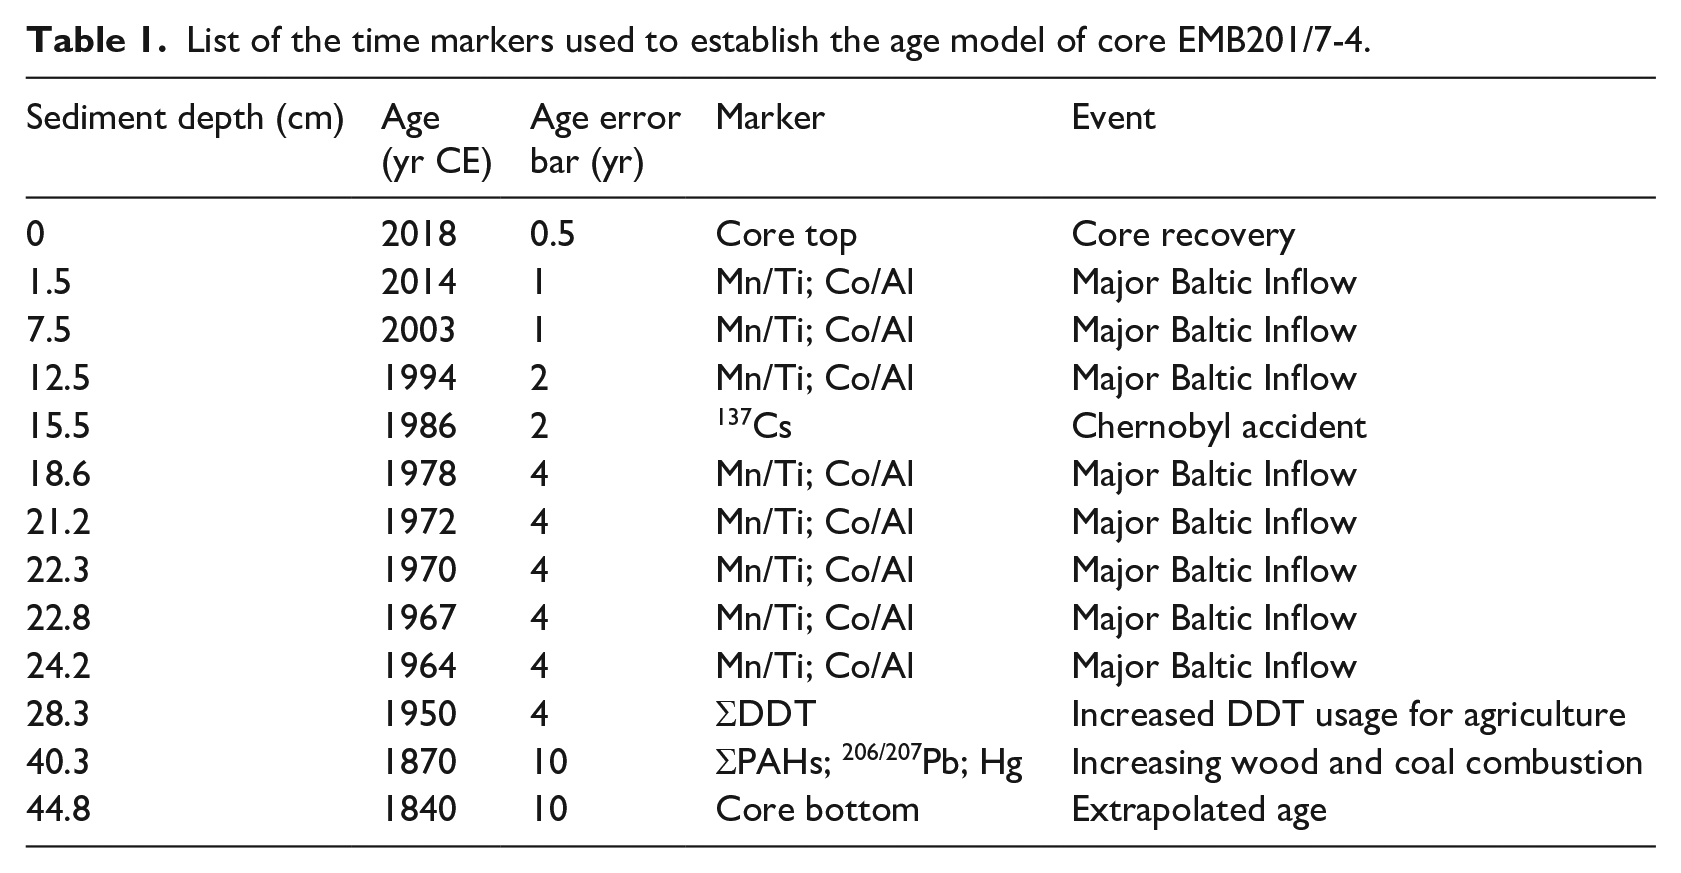
List of the time markers used to establish the age model of core EMB201/7-4.
Chronology
The use of unsupported 210Pb (210Pbunsupp) to date recent sediments is challenging in the Baltic Sea because the depositional environment and the sedimentation type have varied over the past 100 years, resulting in an irregular decrease in 210Pbunsupp (Häusler et al., 2018; Mattila et al., 2006; Moros et al., 2017). Seven parameters were considered to build the stratigraphy (206/207Pb, Hg, ΣPAH, ΣDDT, Mn/Ti, Co/Al and 137Cs; Figure 2b–h), and twelve stratigraphical events, or time markers, were used to date the sediment (Table 1). The uncertainties of the time markers were estimated following Moros et al. (2017), Kaiser et al. (2018, 2020), and Lin et al. (2021). The early increases in 206/207Pb, Hg and ΣPAH reflect the early increase in wood and coal combustion around 1870 CE related to the beginning of the Second Industrial Revolution, or Technological Revolution (Díaz-Somoano et al., 2009; Elmquist et al., 2007; Hanke et al., 2019; Hites et al., 1977). The abrupt rise in ΣDDT is likely related to increased DDT use for agriculture since 1950 CE (Li and Macdonald, 2005), a well-known pattern in Baltic Sea and European lake sediments (Sabatier et al., 2014; Thevenon et al., 2013). Mn and Co enrichments are attributed to four MBIs (1978, 1994, 2003 and 2014 CE; Dellwig et al., 2021; Lin et al., 2021), and tentatively to four other MBIs (1964, 1967, 1970 and 1972 CE; Supplemental Figure S1). The 137Cs increase has been attributed to the Chernobyl accident in 1986 CE. The year of the core recovery (2018 CE) was attributed to the core top layer. Linear sedimentation rates were assumed between time markers resulting in a mean sedimentation rate increasing from 0.2 cm yr−1 between 45 cm (ascribed the date 1840 ± 10 CE) and 28.4 cm depth (1950 ± 4 CE) to 0.4 cm yr−1 from 28.4 cm to the top of the core (Figure 2g).
Radioisotopes (actinides and 14C)
241Am and 239+240Pu profiles showed similar patterns (Figure 3a and b). Both radionuclides were close to the detection limit below 28.8 cm depth (1947 ± 4 CE). They started to increase at 27.3 cm depth (1953 ± 4 CE) and reached a maximum at 24.5 cm depth (1963 ± 4 CE) with activities of 8.4 Bq kg−1 for 241Am and 0.025 Bq kg−1 for 239+240Pu. Above this depth, the activities of both radionuclides decreased abruptly. A second, sharp peak occurred at 15.5 cm depth (1986 ± 2 CE) in both radionuclide profiles. Values of 240/239Pu (Figure 3c), a tracer for Pu source, were >0.301 at 28.8 and 28.3 cm depth (1947 ± 4 and 1950 ± 4 CE, respectively) and between 0.160 and 0.219 from 27.8 cm depth (1952 ± 4 CE) except for slightly higher values at 15.5 cm (1986 ± 2 CE) and 10.5 cm depth (1998 ± 2 CE). F14C (Figure 3d), the normalized fraction of 14C (Hajdas et al., 2021), was relatively stable (~0.8) between 30.8 and 27.3 cm depth (1933–1953 CE). It started increasing at 26.5 cm depth (1956 ± 4 CE), reached a maximum of 1.2 between 23.5 and 20.5 cm (1966–1974 CE), and decreased to 1.0 at 1.5 cm depth (2014 ± 1 CE).
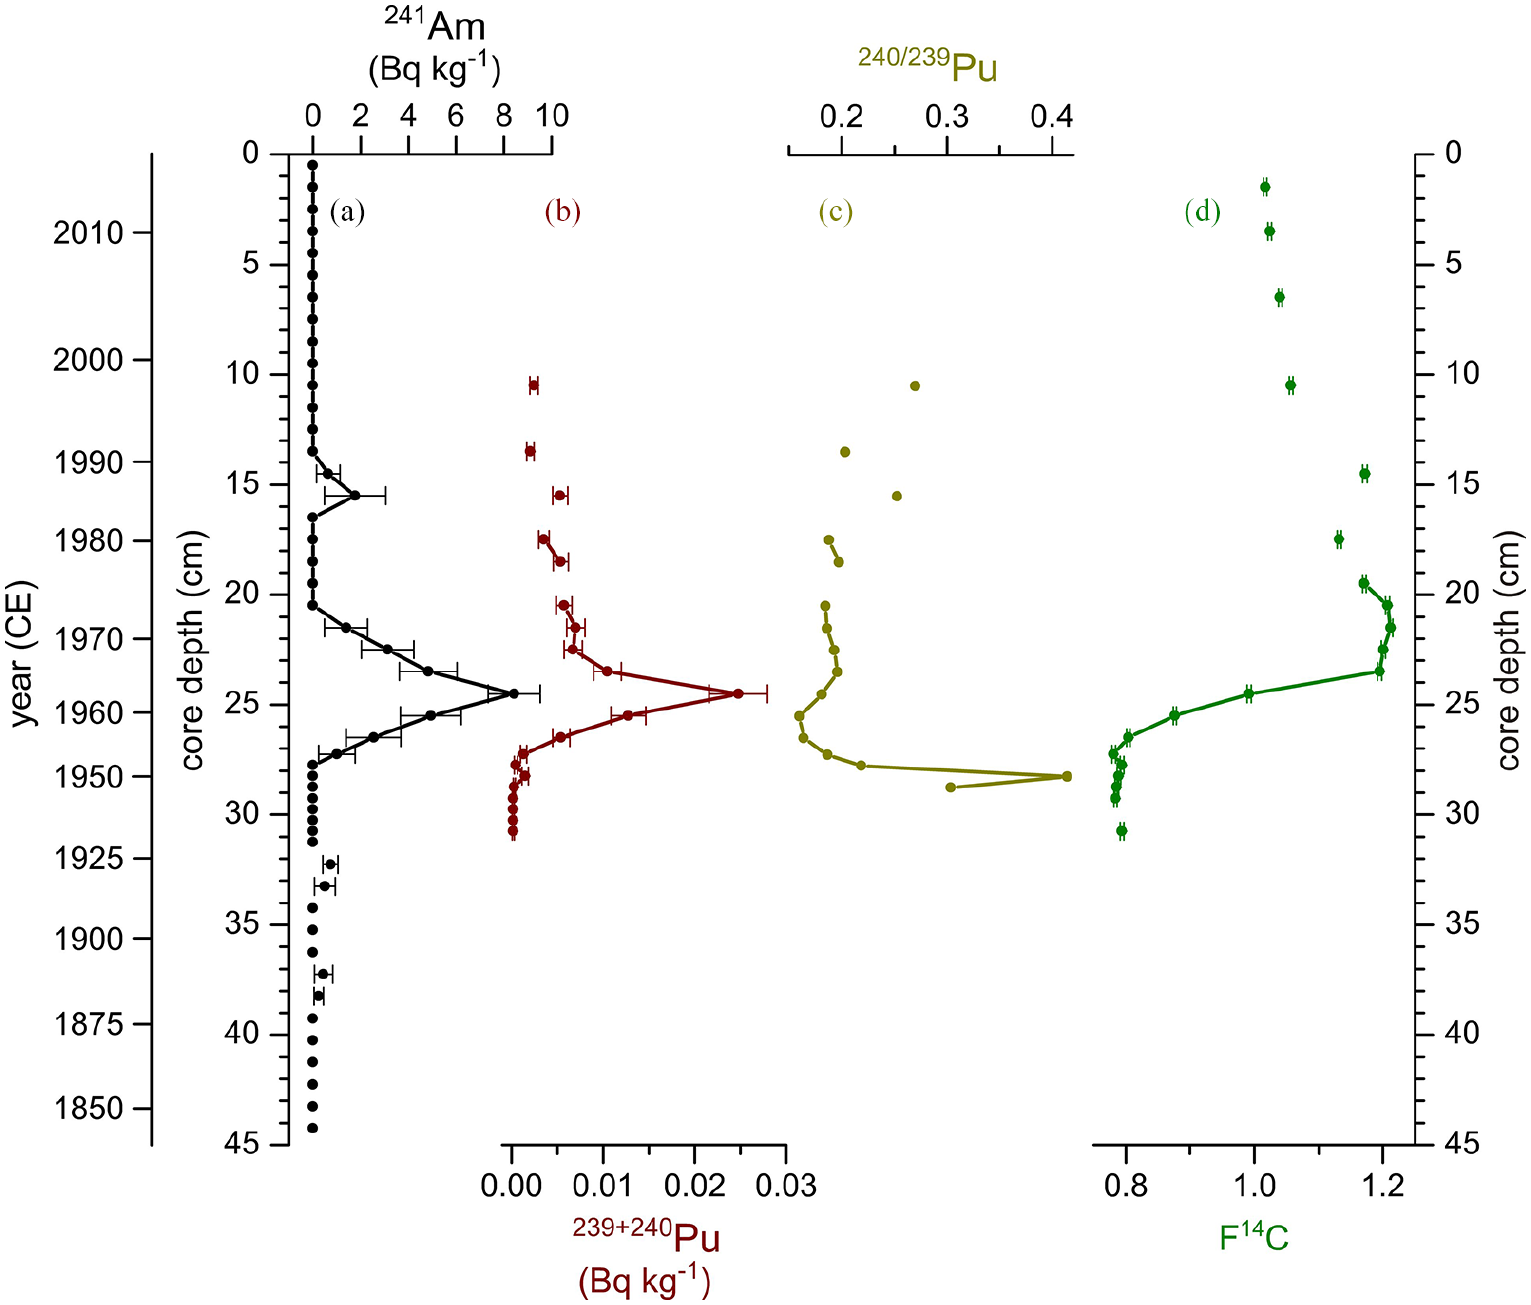
Depth profiles of 241Am (a) and 239+240Pu (b) activities, 240/239Pu (c), and F14C (d) in core EMB201/7-4. Reproduced in colour in online version.
Spheroidal carbonaceous particles
A first appearance of SCPs (Figure 4a) occurred at 36.3 cm depth (1897 ± 8 CE), but SCP contents remained low and sporadic until 27.3 cm depth (1953 ± 4 CE). Only SCPs <25 µm (and frequently <10 µm) were observed in this lower section. Above 27.3 cm depth, SCP contents increased, initially rapidly, through to a peak of >7700 SCPs g−1 dw at 16.5 cm depth (1983 ± 3 CE). From this peak, SCP contents showed a general decline through to the top of the core. Above 28.3 cm, larger SCPs appeared for the first time and SCPs had a wide size range from <5 to >50 µm (Supplemental Table S2).
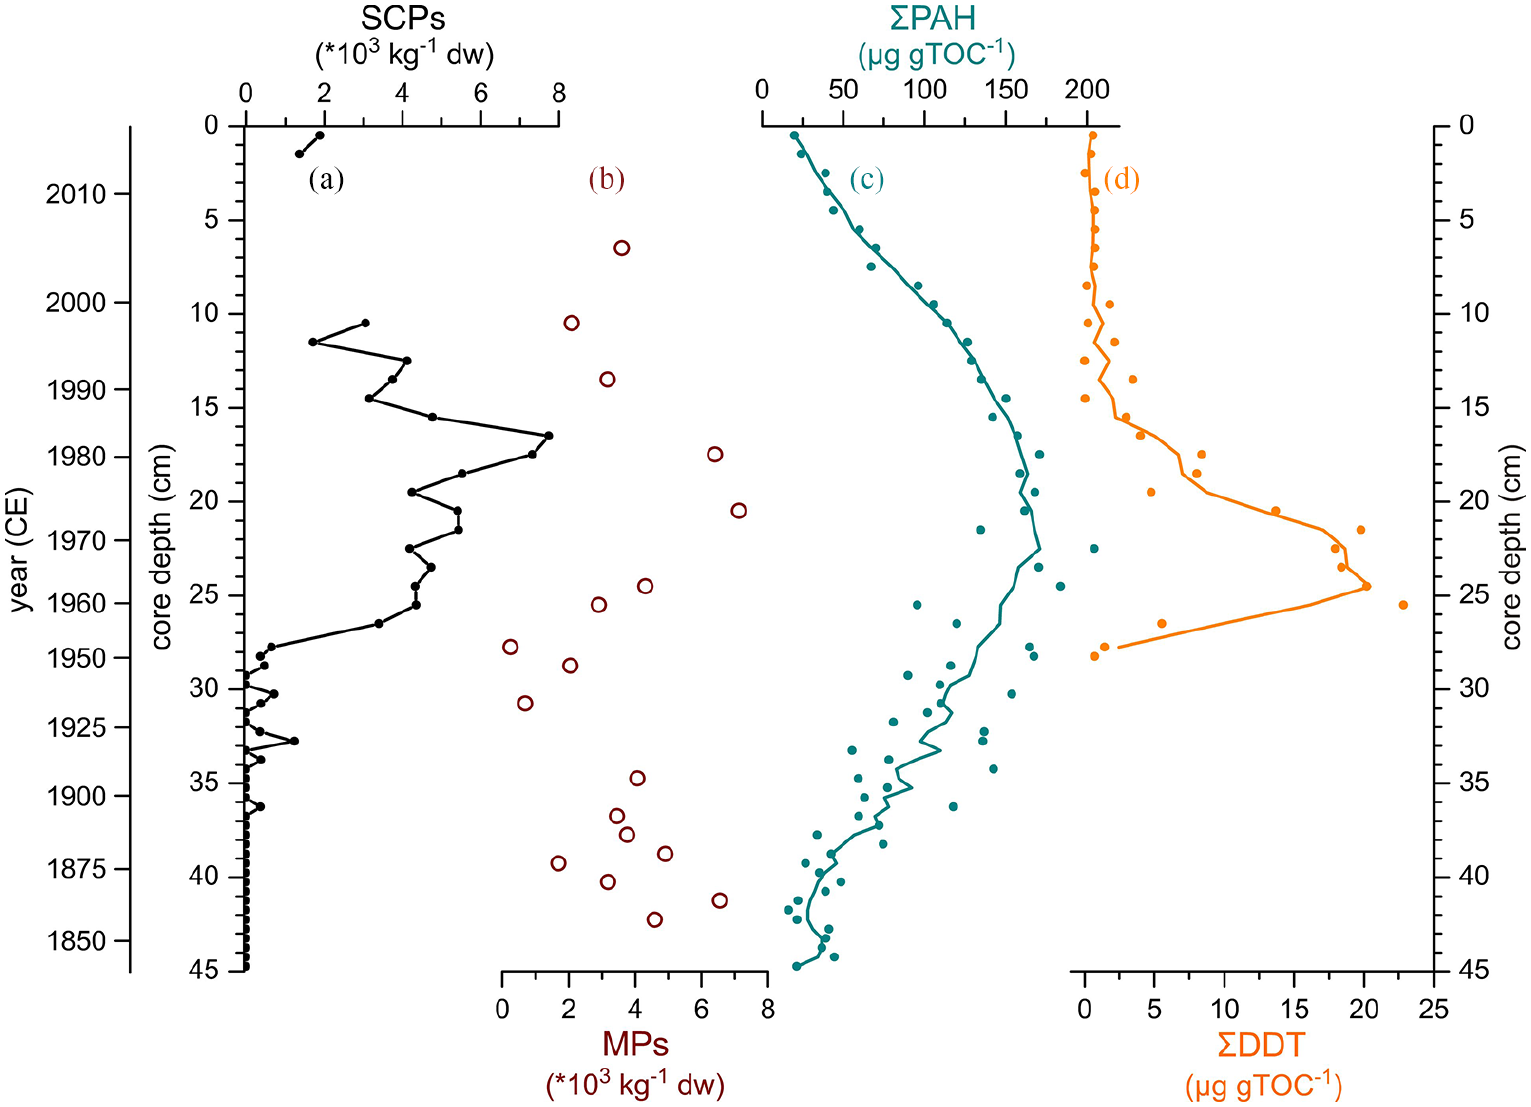
Depth profiles of SCPs (a), microplastics (b), ΣPAH (c) and ΣDDT (d) contents in core EMB201/7-4. Reproduced in colour in online version.
Microplastics
A total of 178 MP particles and six different polymers were identified. Most MP particles were smaller than 100 µm in size, and fibres were almost absent. MP amounts (Figure 4b) ranged between 248 and 7135 MPs kg−1 dw. MPs were identified at all depths between 42.3 and 6.5 cm (1857–2005 CE), with a maximum abundance at 20.5 cm depth (1974 ± 4 CE). In terms of polymer diversity, a near-consistent pattern was observed within all layers with predominance of ethylene-propylene-diene monomer rubbers (Supplemental Table S2).
Polycyclic aromatic hydrocarbons and dichlorodiphenyltrichloroethane
The most abundant PAHs were phenanthrene, fluoranthene, pyrene, benzo[a]anthracene, chrysene, benzo[b]fluoranthene, benzo[k]fluoranthene, benzo[a]pyrene, indeno[1,2,3-cd]pyrene, dibenzo[ah]anthracene and benzo[ghi]perylene. Their sum (ΣPAH) increased gradually from 41.3 to 17.5 cm depth (1863–1981 CE), reaching a maximum around 170 µg gTOC−1, and decreased gradually to reach a minimum of 20 µg gTOC−1 near the top of the core (Figure 4c). ΣDDT (Figure 4d) was below detection limit between 44.8 and 28.8 cm depth (1840–1947 CE). It increased rapidly at 28.3 cm depth (1950 ± 4 CE) to reach a maximum of 20 µg gTOC−1 between 25.5 and 21.5 cm depth (1960–1971 CE). After the peak, ΣDDT decreased gradually towards the top of the core to reach contents <1 µg gTOC−1.
Total carbon, total organic carbon, total nitrogen, total organic nitrogen, and the C/N ratio
Both TC and TOC values (Figure 5a and b) were relatively constant around 3%–4% between 44.8 and 29.8 cm depth (1840–1940 CE). Above 29.8 cm depth (1940 ± 5 CE), they increased gradually to reach 19.8 and 17.3% at the top of the core, respectively. TC and TOC showed a significant positive linear correlation (r2 = 0.97). TN values were <0.5% below 27.8 cm depth (1952 ± 4 CE), followed by a gradual increase to the top of the core, where the values reached 2% (Figure 5c). The C/N ratio (Figure 5d) ranged between 10 and 12 below 27.8 cm depth (1952 ± 4 CE), and between 8 and 10 above 23.5 cm depth (1966 ± 4 CE).
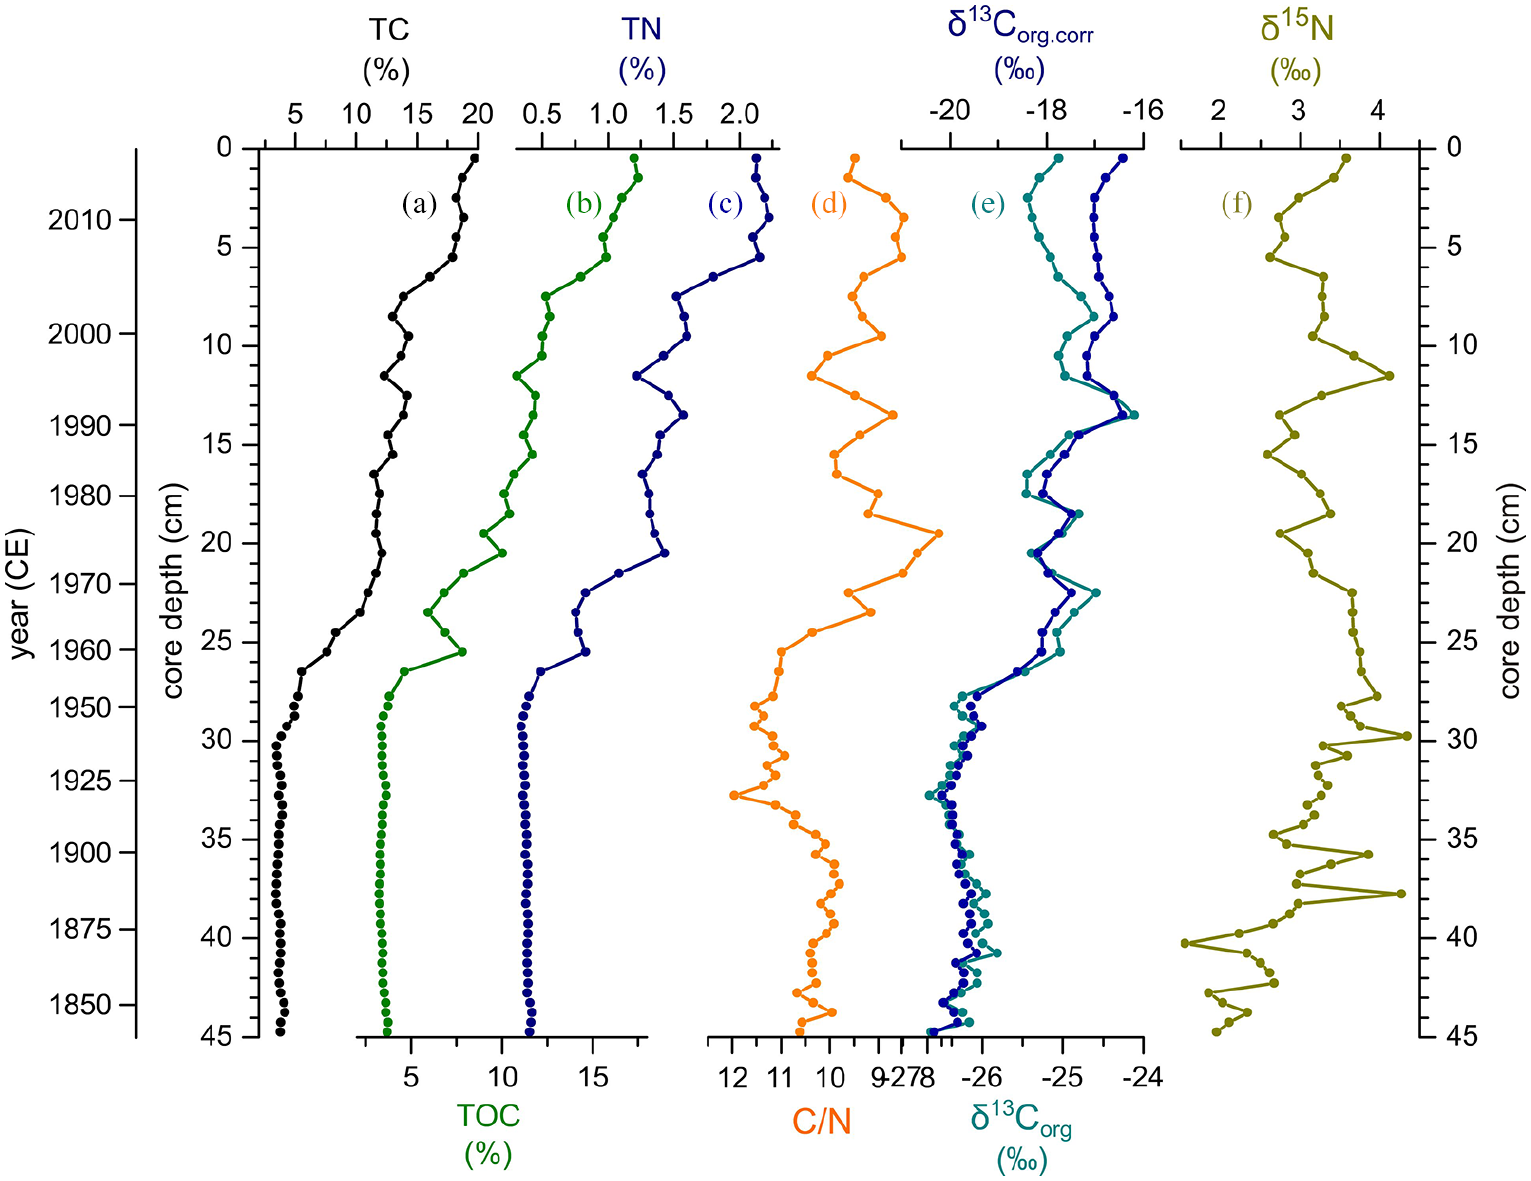
Depth profiles of TC (a), TOC (b), and TN (c) contents, C/N ((d) reversed plotted), δ13Corg and δ13Corg.corr (e), and δ15N (f) in core EMB201/7-4. Reproduced in colour in online version.
Stable carbon and nitrogen isotopes
The record of bulk organic matter δ13C (δ13Corg) presented a −1.2‰ shift from −26.2 ± 0.2‰ below 27.8 cm depth (1952 ± 4 CE) to −25.0 ± 0.3‰ above this depth (Figure 5e). Both δ13Corg and δ13Corg.corr vertical profiles (Figure 5e) were relatively similar, except above 11.5 cm depth (1996 ± 2 CE), where δ13Corg values decreased gradually compared to δ13Corg.corr. δ15N values presented a relatively large scatter (Figure 5f). A general increasing trend of +2‰ occurred between 44.8 and 27.8 cm depth (1840–1952 CE). Above 26.5 cm depth (1956 ± 4 CE), δ15N values fluctuated around 3.3 ± 0.4‰.
Inorganic geochemical signals
Hg/Al, Cu/Al, Zn/Al, and Pb/Al values (Figure 6a–d) increased from 28.8 cm depth (1947 ± 4 CE). The ratios were highest between 24 and 18 cm depth (1966–1978 CE), and decreased until 16.5 cm depth (1983 ± CE). Cu/Al and Zn/Al increased again above 16.5 cm depth (1983 ± 3 CE). 206/207Pb values (Figure 6e) decreased gradually from 1.253 to 1.164 between 38.8–22.5 cm depth (1873–1969 CE) with a slight increase from 33.3 to 31.8 cm depth (1917–1927 CE). Above 22.5 cm depth (1969 ± 4 CE), 206/207Pb values increased and reached a value of 1.209 at the top of the core.
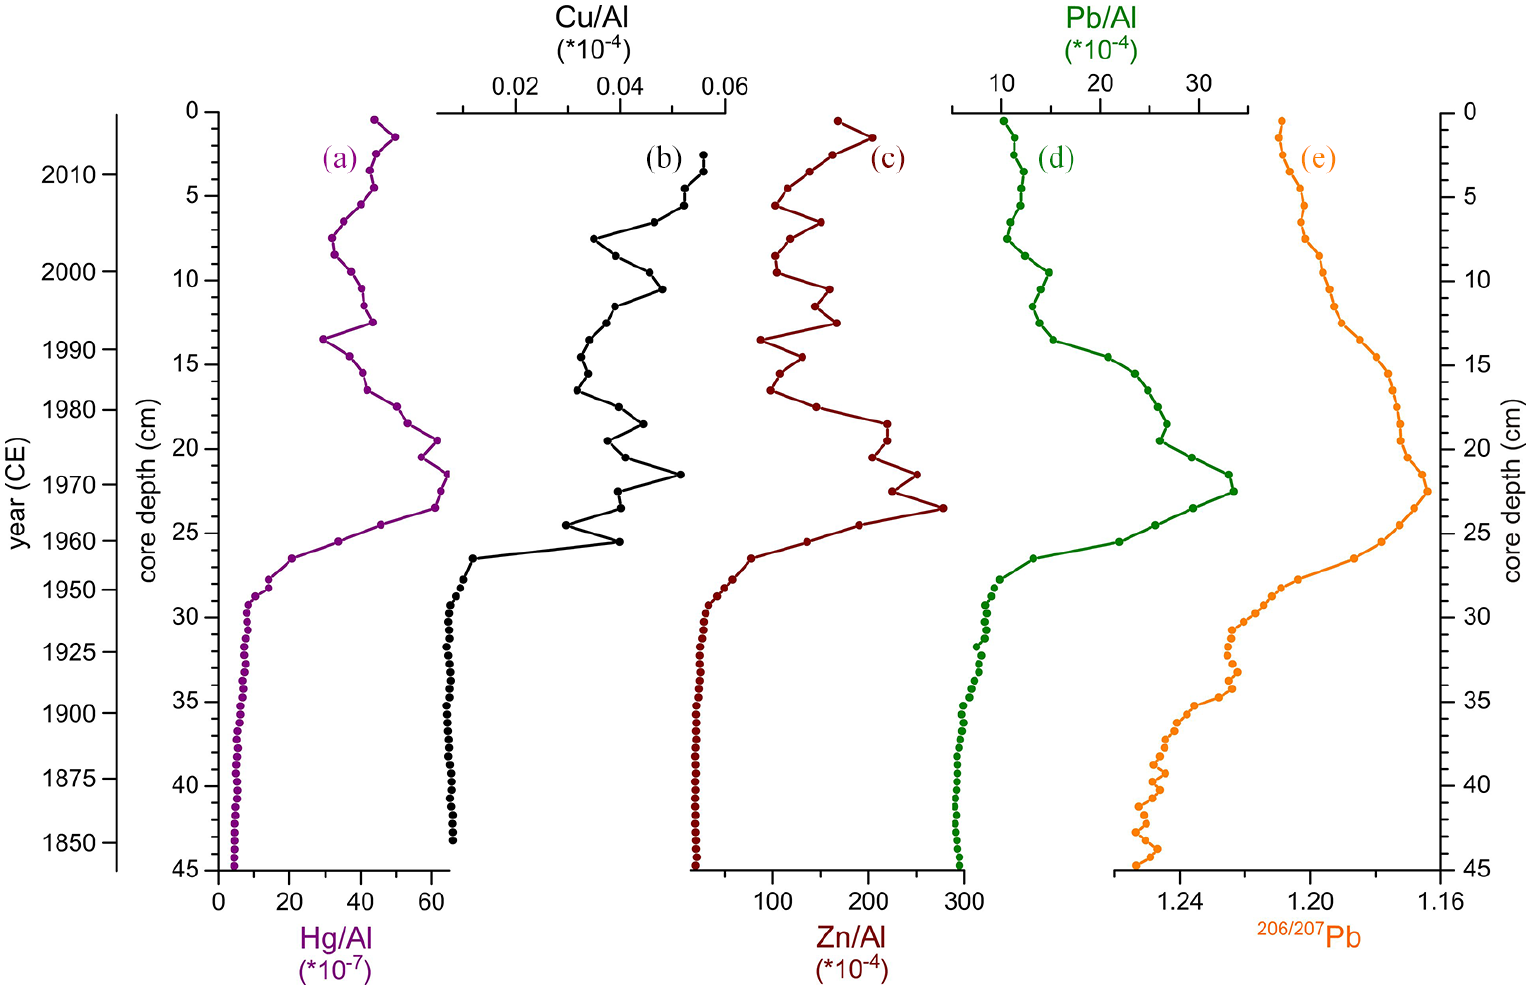
Depth profiles of Hg/Al (a), Cu/Al (b), Zn/Al (c), Pb/Al (d) and 206/207Pb ((e) reversed plotted) in core EMB201/7-4. Reproduced in colour in online version.
Biotic markers
Brassicasterol, contents increased significantly from 1.5 to 8.5 µg gTOC−1 between 26.5 cm depth (1956 ± 4 CE) and the top of the core (Figure 7a). Tetrahymanol contents (Figure 7b) showed a similar trend with very low values below 26.5 cm depth (1956 ± 4 CE) followed by an increase until 10.5 cm depth (1998 ± 2 CE). Above this depth, the contents were relatively stable until the top of the core. Faecal lipids (the sum of coprostanol and epi-coprostanol) first appeared at 26.5 cm depth (1956 ± 4 CE) and increased until the top of the core (Figure 7c). The R2 ratio (R2 = coprostanol + epicoprostanol/5β-stigmastanol + epi-5β-stigmastanol + coprostanol + epicoprostanol; Kaiser and Lerch, 2022) ranged between 0.4 and 0.8 and increased from 26.5 cm (1956 ± 4 CE) to the top of the core (Figure 7d; Supplemental Table S2).
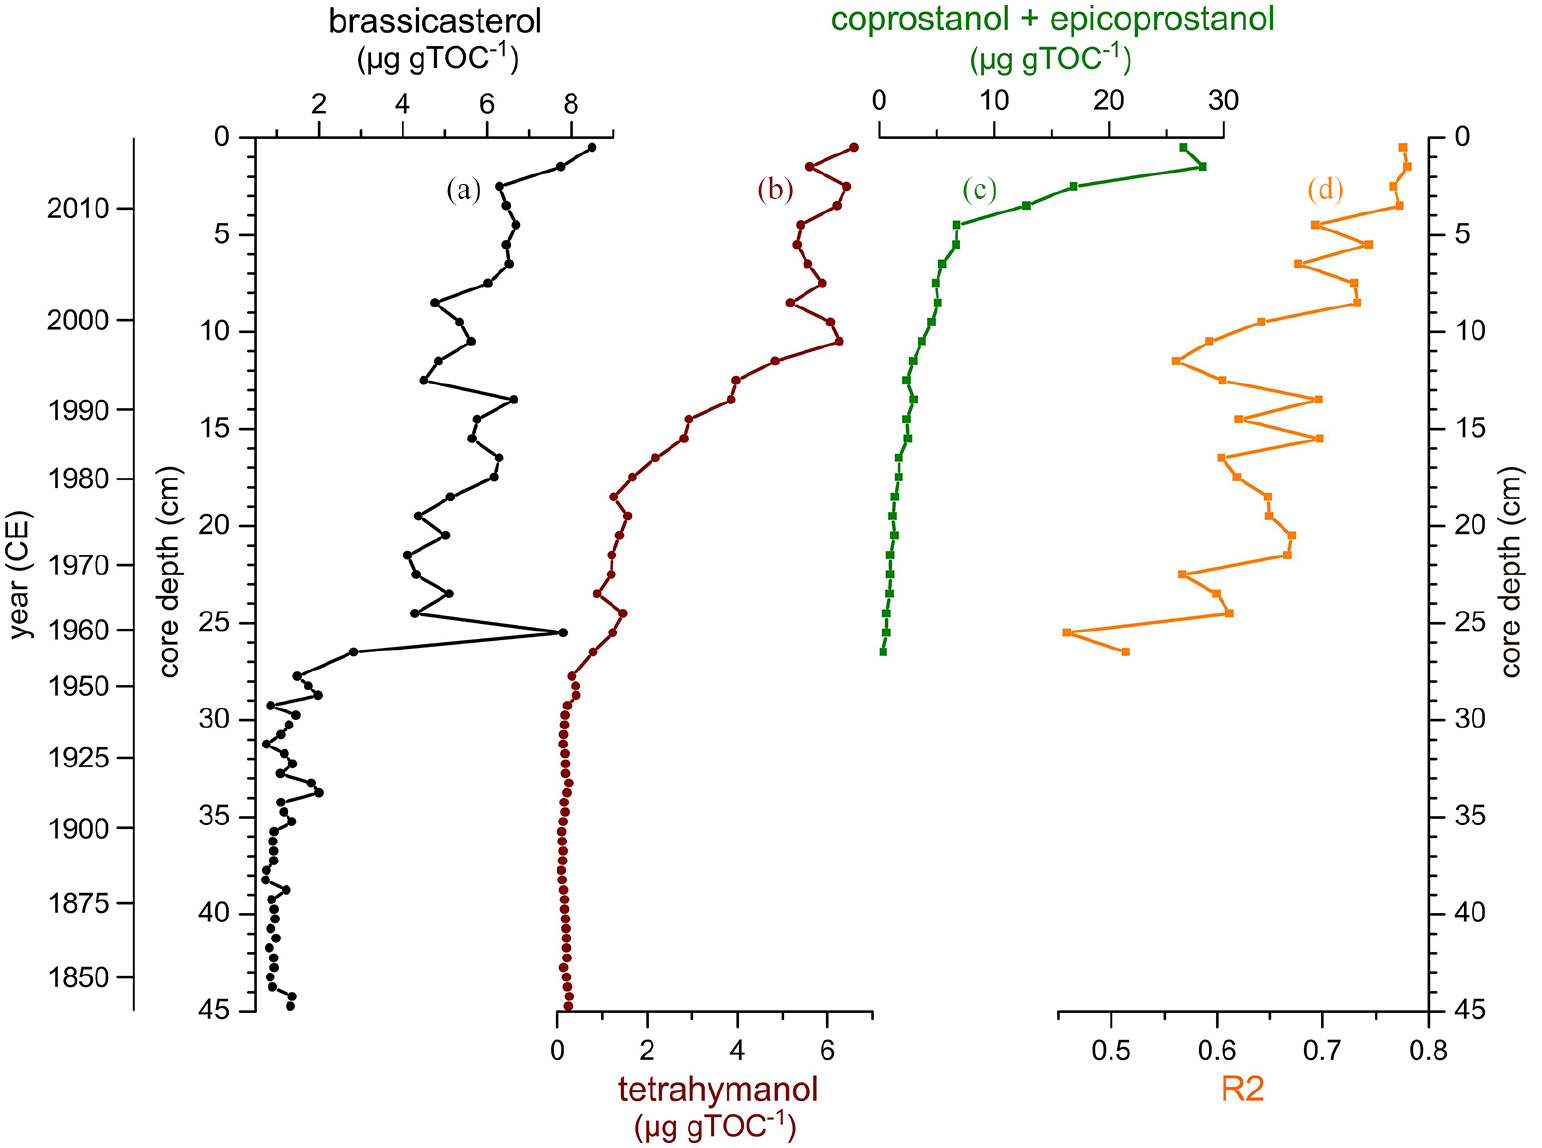
Depth profiles of brassicasterol (a) and tetrahymanol (b) contents, the sum of coprostanol and epicoprostanol contents (c), and the faecal stanol-based R2 ratio (d) in core EMB201/7-4. Reproduced in colour in online version.
Discussion
Chronology
The age model of core EMB201/7-4 (Figure 2) is well-constrained by eleven stratigraphic events between 1950 and 2018 CE (28.3–0 cm depth). Most of these stratigraphic events are known in the Baltic Sea and have already been used to date recent sediments (Dellwig et al., 2021; Häusler et al., 2018; Kaiser et al., 2020; Lin et al., 2021; Moros et al., 2017). Before 1950 ± 4 CE (28.3 cm depth), however, the age model is based on a single stratigraphic event at 1870 ± 10 CE (40.3 cm depth) and on a linear extrapolation to the bottom of the core dated 1840 ± 10 CE (45 cm depth). Between 1870 and 1950 CE, older-than-expected 14C ages (1892 ± 80 year BP; n = 7) were obtained (Supplemental Table S2). This indicates an admixture of relatively older organic matter most likely due to the inwash of pre-aged terrestrial organic matter from the drainage basin (Howarth et al., 2013; Schroeter et al., 2021), or sediment reworking (Moros et al., 2020). The 206/207Pb and ΣPAH profiles from core EMB201/7-4 (Figure 2b and d) support the absence of sediment reworking as they are comparable to existing records from lakes within the Baltic Sea drainage basin (Renberg et al., 2001, 2002). Therefore, the inwash of pre-aged terrestrial organic matter likely explains older-than-expected radiocarbon ages, but the sediments were not affected significantly by reworking before 1950 CE. The event stratigraphy approach followed here represents the most advanced method to date Baltic Sea recent sediments.
Radionuclides as primary markers for the Anthropocene GSSP level in Baltic Sea sediments
For the Anthropocene to be a formal chronostratigraphic/geochronologic unit of geological time, a synchronous base is needed (Head et al., 2021; Waters et al., 2023). 239+240Pu and 241Am artificial radionuclides produced by atmospheric nuclear bomb tests are the main candidates as primary markers in the context of the Anthropocene because of their longevity (half-lives of 24,110 and 432 years, respectively) and appearance around 1950 CE in different archives worldwide (Waters et al., 2018, 2019; Zalasiewicz et al., 2017). While 239+240Pu was first identified above detection limit in 1947 ± 4 CE (28.8 cm depth) in core EMB201/7-4, both 241Am and 239+240Pu (Figure 8a and 8b) started to increase markedly after 1953 ± 4 CE (27.3 cm depth). They reached maximum values in 1963 ± 4 CE (24.5 cm depth), when the Limited Test-Ban Treaty was established, which was followed by a rapid decline in radionuclide fallout worldwide (Waters et al., 2018, 2019). 240/239Pu values (Figure 3c) above 0.30 between 1947 and 1950 CE (28.8–28.3 cm depth) suggested a main radionuclide source from test sites in the Pacific Ocean (Pacific Proving Grounds; Buesseler, 1997; Koide et al., 1985; Lachner et al., 2010; Muramatsu et al., 2000), while values below 0.19 since 1953 ± 4 CE (27.3 cm depth) are typical of global fallout (Buesseler and Sholkovitz, 1987; Kelley et al., 1999). Slightly increased values in 1986 ± 2 CE (15.5 cm depth) are consistent with the Chernobyl accident (Muramatsu et al., 2000).
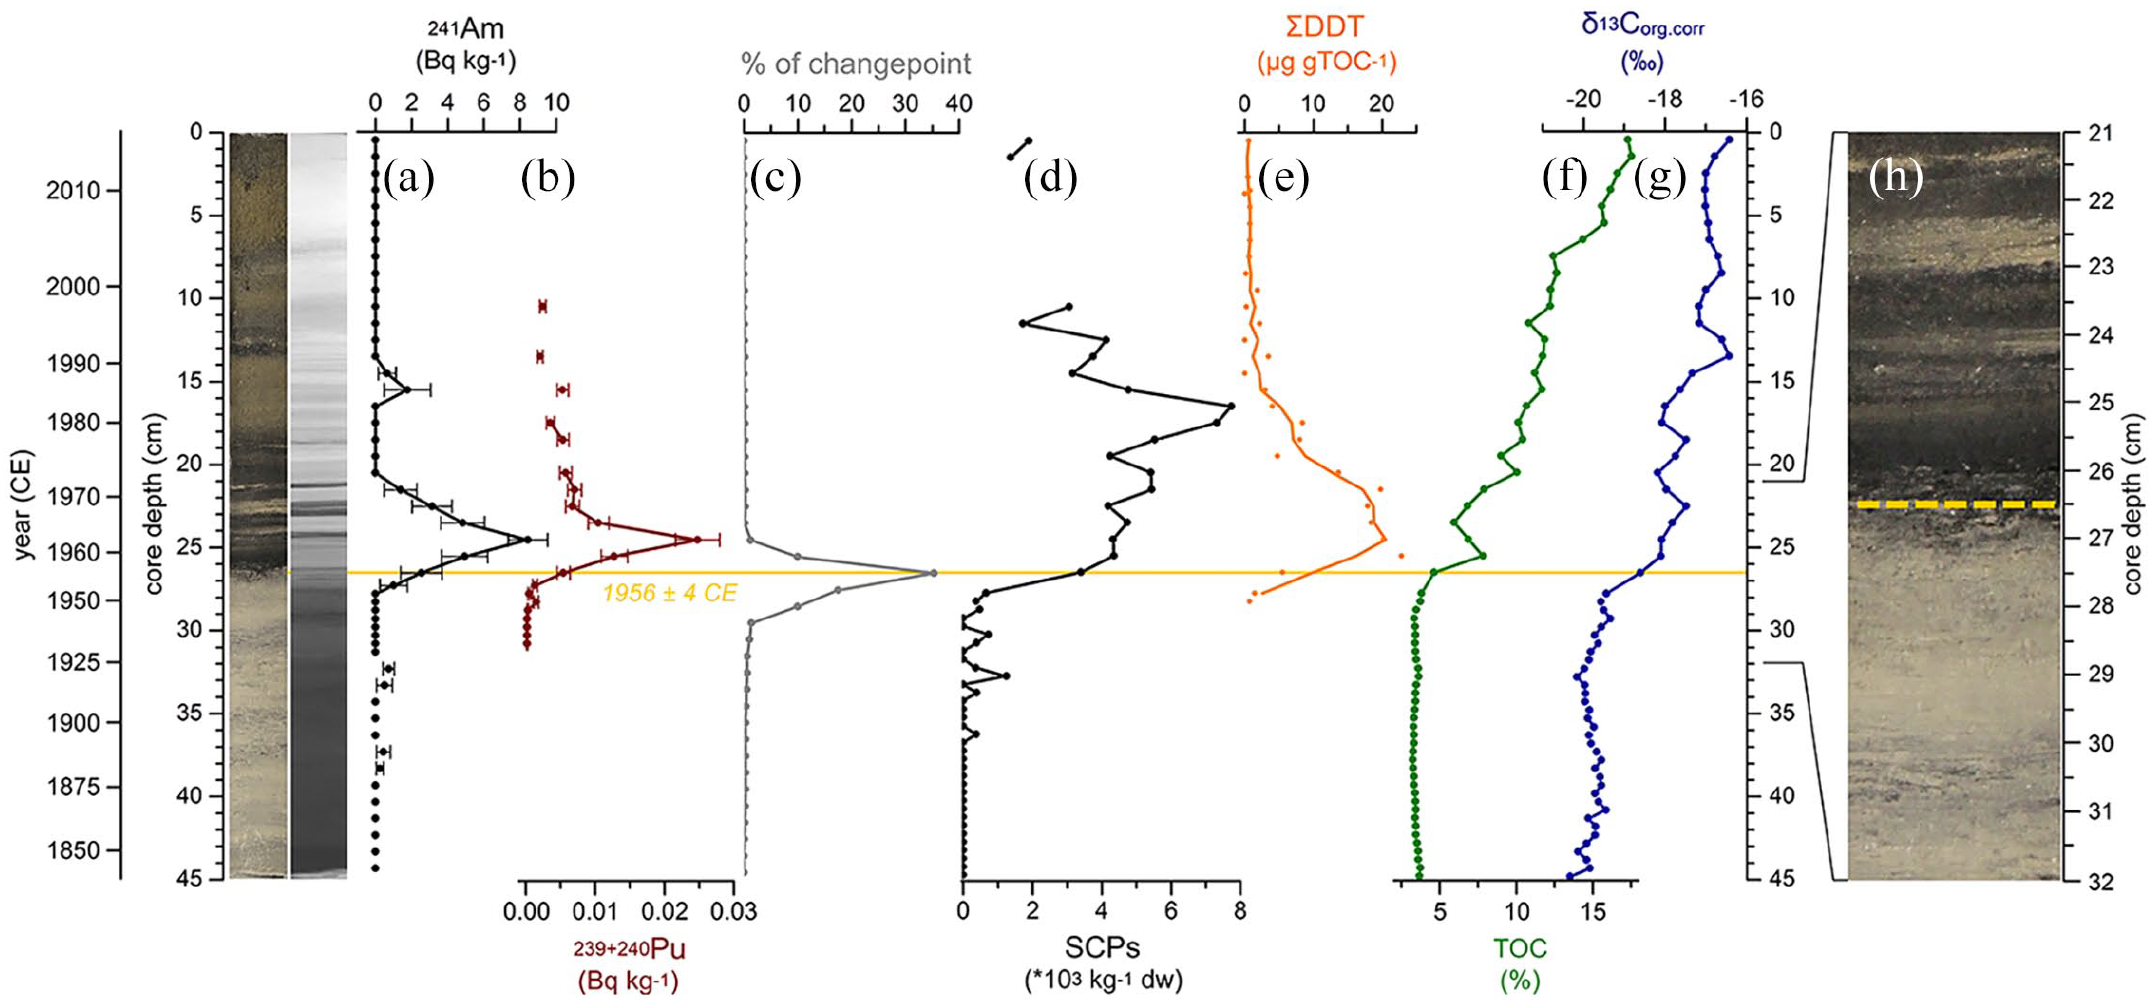
Pictures of core EMB201/7-4 (true colour and radiography), primary markers (a and b), and changepoint modelling results (c) used to define the GSSP level in 1956 ± 4 CE (26.5 cm depth; horizontal line). Secondary markers selected to illustrate changes in anthropogenic pollution (d and e) and eutrophication (f and g) in the Baltic Sea are also shown. A close-up (h) indicating the proposed GSSP level at 26.5 cm in the core is represented by a yellow dotted line. Reproduced in colour in online version.
The 137Cs artificial radionuclide (Figure 2h) activity increased slightly from 1956 ± 4 CE (26.5 cm depth) due to atmospheric nuclear weapon tests, but the most prominent increase occurred after 1981 ± 3 CE (17.5 cm depth) because of the Chernobyl accident in 1986 CE. As documented, the radioactive cloud from this accident first travelled northward and resulted in a high deposition of 137Cs radionuclides in the Baltic Sea region (Dellwig et al., 2018; Ilus et al., 2007; Mattila et al., 2006; Moros et al., 2017). F14C, the atmospheric radiocarbon excess released by nuclear bomb tests, started to increase in 1956 ± 4 CE (26.5 cm depth) and reached maximum values in 1966 ± 4 CE (23.5 cm depth), about three years after 241Am and 239+240Pu in both cases (Figure 3d). This delay can be attributed to atmosphere-ocean 14C equilibration time (Waters et al., 2019). Also, post-depositional, vertical migration within sediments, sediment remobilization, as well as sediment inwash from the drainage basin are typical potential issues affecting radionuclide profiles (Davis et al., 1984; Haltia et al., 2021; Hancock et al., 2014; He et al., 1996; Ilus et al., 2007; Mattila et al., 2006; Owens and Walling, 1996; Schroeter et al., 2021; Waters et al., 2019). These issues likely explain the detection of 137Cs since 1917 ± 6 CE (33.3 cm depth) because it is very mobile in sediments compared to 241Am, as well as the detection of radionuclides in the sediments until the present-day.
Artificial 239+240Pu and 241Am radionuclides from nuclear weapons testing are therefore considered here as the most relevant primary markers in the context of the Holocene-Anthropocene boundary. Results from a changepoint model (Figure 8c; Supplemental Table S3) indicated a change starting in 1948 ± 4 CE (28.5 cm depth), but the main change occurred in 1956 ± 4 CE (26.5 cm depth), which would be the proposed GSSP level in Baltic Sea sediments.
Anthropogenic pollutants as secondary markers for the Anthropocene GSSP level in Baltic Sea sediments
SCP contents (Figure 8d) increased markedly after 1953 ± 4 CE (27.3 cm depth) due to an increase in coal and fuel oil combustion related to a high electricity demand after WWII. Furthermore, the introduction of new SCP sources is suggested by their wider range of sizes since that time (Supplemental Table S2). Decreasing SCP contents since 1983 ± 3 CE (16.5 cm depth) reflects the reduction in SCPs release to the atmosphere due to the introduction of particle-arrestor technology since the 1970s and the shift away from coal and oil fuels to natural gas, nuclear and renewable energy sources (Rose, 2015; Rose and Gałuszka, 2019). The Baltic Sea SCP profile is compatible with other lake sediments reported globally (Rose, 2015).
MP amounts (Figure 4b) increased between 1960 and 1974 CE (25.5–20.5 cm depth) as a result of a rapid and intense increase in both production and use of an array of polymer types (Ivar Do Sul and Labrenz, 2020; Zalasiewicz et al., 2016). Ethylene-propylene-diene monomer rubbers, the prevalent category within polymers identified here (Supplemental Table S2), are widely used for a range of marine-and terrestrial-based activities and very common in the marine environment (Lorenz et al., 2019; Primpke et al., 2018). The MP profile suggests that the MP stock in the Baltic Sea marine environment consists of polymers from various provenances affected by different taphonomic processes, and hence does not reflect a direct or straightforward response to world plastic production (Bancone et al., 2020).
Hg, Pb, Cu and Zn are markers of anthropogenic industrial pollution in sediments (Birch et al., 2015; Gałuszka and Rose, 2019; Rauch and Pacyna, 2009). The main trends in Hg/Al, Cu/Al, Zn/Al and Pb/Al (Figure 6a–d) reflect an increase of coal combustion and metal production after the mid-20th century, and a decrease from 1970s CE due to a reduction in industrial dust emission and fossil fuel combustion in northern and western Europe (Callender, 2014; Gałuszka and Wagreich, 2019; Rühling and Tyler, 2001). However, a decrease to background levels in present-day sediments is not observed for most of the metals. This is because trace metals are generally sensitive to changing redox conditions (Bruland et al., 2013), which biases the anthropogenic signal in Baltic Sea sediments. 206/207Pb is not redox-sensitive, and reflects therefore an unbiased signal (Figure 6e). Decreasing 206/207Pb values between the early-1870s CE and the late-1960s CE are most likely due to both increasing coal combustion during the Second Industrial Revolution and the spread of leaded gasoline combustion in Europe since 1950 CE (Boyle et al., 2014; Díaz-Somoano et al., 2009; Renberg et al., 2002). Increasing values since the early-1970s (21.5 cm depth) reflect the decline of lead pollution in Europe due to both the implementation of stricter industrial emission standards and the phase-out of alkyl-lead gasoline (Renberg et al., 2001, 2002).
The appearance of the persistent organic pollutant DDT (Figure 8e) in 1950 ± 4 CE (28.3 cm depth) and its pronounced increase up to 1960 ± 4 CE (25.5 cm depth) is related to the increasing use of DDT in Baltic Sea countries after 1945 CE to control insects on agricultural crops. Indeed, the former Soviet Union had the second highest (after the United States) historical DDT usage in agriculture from 1952 to1971 CE (Li and Macdonald, 2005). The decrease in DDT content after 1971 ± 4 CE (21.5 cm depth) reflects the ban on its use within Baltic Sea countries since the early-1970s (HELCOM, 2010).
Coprostanol and epicoprostanol faecal lipids (Figure 7c and d) first appeared in 1956 ± 4 CE (26.5 cm depth) and increased subsequently as a result of increasing sewage pollution in the central Baltic Sea (Kaiser and Lerch, 2022). The fraction of human-derived faecal lipids was also increasing since 1956 ± 4 CE as suggested by higher R2 values. Therefore, sedimentary faecal lipids reflect the increasing human-derived sewage pollution related to population growth in the Baltic Sea drainage basin (Kaiser and Lerch, 2022).
For anthropogenic pollutants, results from the changepoint model (Supplemental Table S3) indicated a change starting in 1956 ± 4 CE (26.5 cm depth). This change is, however, more pronounced in 1960 ± 4 CE (25.5 cm depth), which corresponds closely to the inflection point of many indicators of the Great Acceleration (Head et al., 2021).
Organic proxies as secondary markers for the Anthropocene GSSP level in Baltic Sea sediments
The pronounced increase in TOC values (Figure 8f) since 1956 ± 4 CE (26.5 cm depth) reflects the growing burial of phytoplankton biomass under hypoxic conditions due to the eutrophication of the central Baltic Sea deep basins since 1950 CE (Emeis et al., 2000; Struck et al., 2000). Indeed, a shift towards heavier δ13Corg.corr values (Figure 8g) after 1952 ± 4 CE (27.8 cm depth) indicates a higher proportion of phytoplankton biomass, as organisms are forced to use the heavier C isotope (13C) when primary production is high (Mizutani and Wada, 1982; Struck et al., 2000; Teranes and Bernasconi, 2005). A decrease in C/N values (Figure 5e) after 1960 ± 4 CE (25.5 cm depth) also indicates an increasing fraction of phytoplankton biomass in Baltic Sea sediments (Emeis et al., 2000; Lamb et al., 2006). The contents of brassicasterol (Figure 7a), or ‘diatomsterol’, a biomarker for the occurrence of diatoms, increased substantially after 1952 ±4 CE (27.8 cm depth), also indicating the growth of phytoplankton biomass mainly due to eutrophication. The similar increase in tetrahymanol contents (Figure 7b) reflects the concomitant development of a pelagic redoxcline in the central Baltic Sea as tetrahymanol is a biomarker for ciliates thriving abundantly near the redoxclines of hypoxic environments (Anderson et al., 2012; Edgcomb and Pachiadaki, 2014; Harvey and Mcmanus, 1991; Pachiadaki et al., 2014).
An increasing trend in δ15N values (Figure 5f) between 1840 and 1950 CE (44.8–28.3 cm depth) resulted most likely from the phytoplankton assimilation of land-derived, isotopically heavier nitrate inputs (Renberg et al., 2001; Struck et al., 2000). Indeed, large-scale changes in land use occurred in the Baltic Sea watershed after the beginning of the Second Industrial Revolution (Zillén and Conley, 2010). After 1950 CE, however, δ15N values started to decrease slightly, possibly due to higher inputs of isotopically lighter nitrogen, and increasing biomass of diazotrophic cyanobacteria, an important contributor to the pelagic N-cycle of the central Baltic Sea since 1950 CE (Kaiser et al., 2020; Kendall et al., 2007; Struck et al., 1998, 2000; Voß et al., 1997). Periods with increasing δ15N values after 1950 CE may be related to higher inputs of isotopically heavier wastewater to the Baltic Sea (Kendall et al., 2007).
As shown for anthropogenic pollution markers, the results from the changepoint model (Supplemental Table S3) suggested that the main change in organic proxies occurred in 1960 ± 4 CE (25.5 cm depth), synchronously with many indicators of the Great Acceleration (Head et al., 2022; Syvitski et al., 2020).
Final remarks regarding the Baltic Sea as GSSP for the Anthropocene series
The present study supports the Anthropocene as a stratigraphically substantiated unit, that should be defined by a GSSP and formalized at the rank of epoch with an inception at around 1950 CE (Zalasiewicz et al., 2017). Artificial radioisotopes released during atmospheric nuclear weapons testing, which are the most significant markers in the context the Anthropocene, showed a main change in core EMB201/7-4 in 1956 ± 4 CE as indicated by the changepoint model. This point is therefore proposed as the GSSP level for the Anthropocene series (Figure 8). It corresponds to a marked change in lithology and sediment colour from light grey to dark brown (or dark grey to brown after oxidation), which reflects the beginning of eutrophication in the central Baltic Sea due to an increasing anthropogenic pressure. Despite the most accurate approach used to date core EMB201/7-4, the lack of annual lamination may flag the Baltic Sea as a GSSP candidate for the Anthropocene series.
If accepted, the East Gotland Basin GSSP would be in accordance to all 65 GSSPs presently ratified, which occur within strata deposited in marine sedimentary environments with the exception of the three Holocene GSSPs (Walker et al., 2018; Waters et al., 2019). The archived half of core EMB201/7-4 is preserved and accessible at the IOW, Germany. Although marine GSSP sites are not as accessible as terrestrial ones, new sediment cores from exactly the same location can be recovered during expeditions on board research vessels. Finally, if appropriate, the name ‘Baltician’ is suggested as potential stage/age (Luciano, 2022).
Supplemental Material
sj-jpg-1-anr-10.1177_20530196221132709 – Supplemental material for The East Gotland Basin (Baltic Sea) as a candidate Global Boundary Stratotype Section and Point for the Anthropocene series
Supplemental material, sj-jpg-1-anr-10.1177_20530196221132709 for The East Gotland Basin (Baltic Sea) as a candidate Global Boundary Stratotype Section and Point for the Anthropocene series by Jérôme Kaiser, Serena Abel, Helge W Arz, Andrew B Cundy, Olaf Dellwig, Pawel Gaca, Gunnar Gerdts, Irka Hajdas, Matthias Labrenz, James A Milton, Matthias Moros, Sebastian Primpke, Sarah L Roberts, Neil L Rose, Simon D Turner, Maren Voss and Juliana A Ivar do Sul in The Anthropocene Review
Supplemental Material
sj-xlsx-1-anr-10.1177_20530196221132709 – Supplemental material for The East Gotland Basin (Baltic Sea) as a candidate Global Boundary Stratotype Section and Point for the Anthropocene series
Supplemental material, sj-xlsx-1-anr-10.1177_20530196221132709 for The East Gotland Basin (Baltic Sea) as a candidate Global Boundary Stratotype Section and Point for the Anthropocene series by Jérôme Kaiser, Serena Abel, Helge W Arz, Andrew B Cundy, Olaf Dellwig, Pawel Gaca, Gunnar Gerdts, Irka Hajdas, Matthias Labrenz, James A Milton, Matthias Moros, Sebastian Primpke, Sarah L Roberts, Neil L Rose, Simon D Turner, Maren Voss and Juliana A Ivar do Sul in The Anthropocene Review
Supplemental Material
sj-xlsx-2-anr-10.1177_20530196221132709 – Supplemental material for The East Gotland Basin (Baltic Sea) as a candidate Global Boundary Stratotype Section and Point for the Anthropocene series
Supplemental material, sj-xlsx-2-anr-10.1177_20530196221132709 for The East Gotland Basin (Baltic Sea) as a candidate Global Boundary Stratotype Section and Point for the Anthropocene series by Jérôme Kaiser, Serena Abel, Helge W Arz, Andrew B Cundy, Olaf Dellwig, Pawel Gaca, Gunnar Gerdts, Irka Hajdas, Matthias Labrenz, James A Milton, Matthias Moros, Sebastian Primpke, Sarah L Roberts, Neil L Rose, Simon D Turner, Maren Voss and Juliana A Ivar do Sul in The Anthropocene Review
Supplemental Material
sj-xlsx-3-anr-10.1177_20530196221132709 – Supplemental material for The East Gotland Basin (Baltic Sea) as a candidate Global Boundary Stratotype Section and Point for the Anthropocene series
Supplemental material, sj-xlsx-3-anr-10.1177_20530196221132709 for The East Gotland Basin (Baltic Sea) as a candidate Global Boundary Stratotype Section and Point for the Anthropocene series by Jérôme Kaiser, Serena Abel, Helge W Arz, Andrew B Cundy, Olaf Dellwig, Pawel Gaca, Gunnar Gerdts, Irka Hajdas, Matthias Labrenz, James A Milton, Matthias Moros, Sebastian Primpke, Sarah L Roberts, Neil L Rose, Simon D Turner, Maren Voss and Juliana A Ivar do Sul in The Anthropocene Review
Footnotes
Acknowledgements
We are thankful to Nadine Hollman, Anne Köhler, Iris Liskow and Ines Scherff for analytical assistance and to the crew and captain of R/V Elisabeth Mann Borgese during expedition EMB201. We also thank the associate editor C.W. and two anonymous reviewers for their valuable comments and suggestions, which improved quality of this manuscript. Analysis of the EMB201/7-4 core was facilitated by the collaborative research project between the Leibniz Institute for Baltic Sea Research (IOW) and the Anthropocene Working Group (AWG) to ratify the stratigraphic Anthropocene. The AWG is co-ordinating the assessment of candidate GSSP sites in collaboration with the Haus der Kulturen der Welt (HKW, Berlin) in the framework of its long-term project Anthropocene Curriculum. The Anthropocene Curriculum is an international project for experimental forms of Anthropocene research and education developed by HKW and the Max Planck Institute for the History of Science (MPIWG, Berlin) since 2013. JA Ivar do Sul is supported by the LABPLAS Project (LAnd-Based Solutions for PLAStics in the Sea, Grant Agreement Nr.: 101003954), financed by the EU Horizon 2020 programme.
Declaration of conflicting interests
The author(s) declared no potential conflicts of interest with respect to the research, authorship, and/or publication of this article.
Funding
The author(s) disclosed receipt of the following financial support for the research, authorship, and/or publication of this article: This work was supported by the Haus der Kulturen der Welt (HKW, Berlin, Germany).
Supplemental material
Supplemental material for this article is available online.
References
Supplementary Material
Please find the following supplemental material available below.
For Open Access articles published under a Creative Commons License, all supplemental material carries the same license as the article it is associated with.
For non-Open Access articles published, all supplemental material carries a non-exclusive license, and permission requests for re-use of supplemental material or any part of supplemental material shall be sent directly to the copyright owner as specified in the copyright notice associated with the article.