
Abstract
Objectives:
This study aimed to compare Likert scores with radical prostatectomy specimens.
Methods:
This study examined 443 men with validated pre-biopsy magnetic resonance imaging results and used cross-tabulation and chi-square significance testing with National Comprehensive Cancer Network risk categories.
Results:
The mean prostate-specific antigen (PSA) was 10, and the mean age was 64 years. Comparing Likert III to Likert V and Likert IV to Likert V, both (each p=0.02) were significantly associated with higher prostate cancer risk groups, but Likert III versus Likert IV was not (p=0.1). Within the subgroup PSA density (PSAD) <0.15 (n=140), the correlation of Likert score and final pathological risk group was lost (p=0.5), but it was not lost within the subgroup PSAD >0.15 (n=281; p=0.045 III vs. IV only and p=0.055 overall). Within the subgroup age <60 (n=104), the correlation of Likert score and final pathological risk group was significant (p=0.006 for III vs. IV and p=0.04 overall), whereas within the subgroup age >60 (n=339) this significant difference was lost (p=0.34). Further subgroup analysis within Likert III (n=86) found that men <60 (n=22) had neither high-grade (G3 or G4 or G5) nor very high-risk disease. There were only two high-risk cases, both of which were G2T3a (2/22; 10%). In men with Likert III and PSAD <0.15 (n=31), there were seven high-risk and two very high-risk cases (9/31; 25%). This difference was not significant (p=0.31)
Conclusion:
With these two findings, we recommend that men <60 with Likert III can be counselled like men with Likert III and PSAD <0.15, that they are unlikely to have unfavourable or high-risk disease and that they may wish to avoid biopsy or treatment.
Level of evidence:
Level 1b.
Introduction
The Likert scale is a visual analogue scale, where scores of 1–5 represent the likelihood of cancer based on the radiologist’s overall interpretation of a prostate magnetic resonance imaging (MRI) scan. 1 Scores of 1 and 2 represent a low suspicion of cancer, a score of 3 is equivocal and a score of 4 or 5 is considered a high suspicion. Although for consistency sake we use the term ‘Likert’ in this report, a recent major UK study and others suggest that Likert and PI-RADS are clinically equivalent.2,3 The Likert scale scoring system does lack reproducibility outside of expert radiologist hands, requiring training to improve diagnostic accuracy.
Likert score correlates well with prostate cancer risk grades on biopsy. 4 After the 2017 PROMIS trial, 5 the 2018 UK consensus recommendation 6 recommended that Likert scores IV and V should be biopsied and, for Likert III, only if prostate-specific antigen density (PSAD) is >0.15 (or >0.12) or if a significant family history or ‘until more robust evidence is available’. It was not clear how to sub-differentiate Likert III. 7 The consensus recommendation was based on several large and thorough studies on how PSAD and Likert scores correlate well with biopsy grade results.8–10 However, subsequent publications have not yet really clarified this problem of how to differentiate risk within Likert III.11,12
The correlation of biopsy grade to ‘true’ radical prostatectomy grade or ‘true’ pathological risk group is at best only 75%. One large series of template prostate biopsies in a UK teaching hospital found a concordance rate for grade of only 75%. 13 Stage, which is the other important factor in determining risk category, is not assessed at all in these studies, which correlate Likert score to biopsy grade only. Our prior unpublished local audit found an overall concordance rate for biopsy grade to whole-specimen grade of 70% for template biopsies and 60% for trans-rectal ultrasound (TRUS) biopsies. This varies by grade group, with biopsy G4 and G5 being downgraded at radical prostatectomy in 40–50% of cases, G3 usually being broadly correct and G1 and G2 being upgraded by 80% and 20%, respectively (Figure 1, upper graph). Comparison with a larger historical series (Figure 1, lower graph) shows that over the last 10 years, upgrading of G1 and G2 has increased dramatically, G3 downgrading has reduced from 40% to 20%, and downgrading of G4 and G5 has remained at 40–50%. This change is almost certainly due to successful deselection of low-risk patients for surgery in this series (only 5% compared to 66% previously). The historical series is from the USA 2002–2010 graded with essentially the same version of the Gleason grading system (n=7643, median age 58, mean PSA 5.8). The graph was created from data taken from a table in Epstein et al. 14 As discussed in Epstein et al., 14 the consistently high downgrading rates of G4 and G5 are due to how the Gleason score is calculated differently in biopsy compared to whole specimens. In Supplemental Graph 8, we demonstrate how these up and downgrading rates by biopsy grade differ for our template perineal (TP) and trans-rectal (TRUS) biopsies.
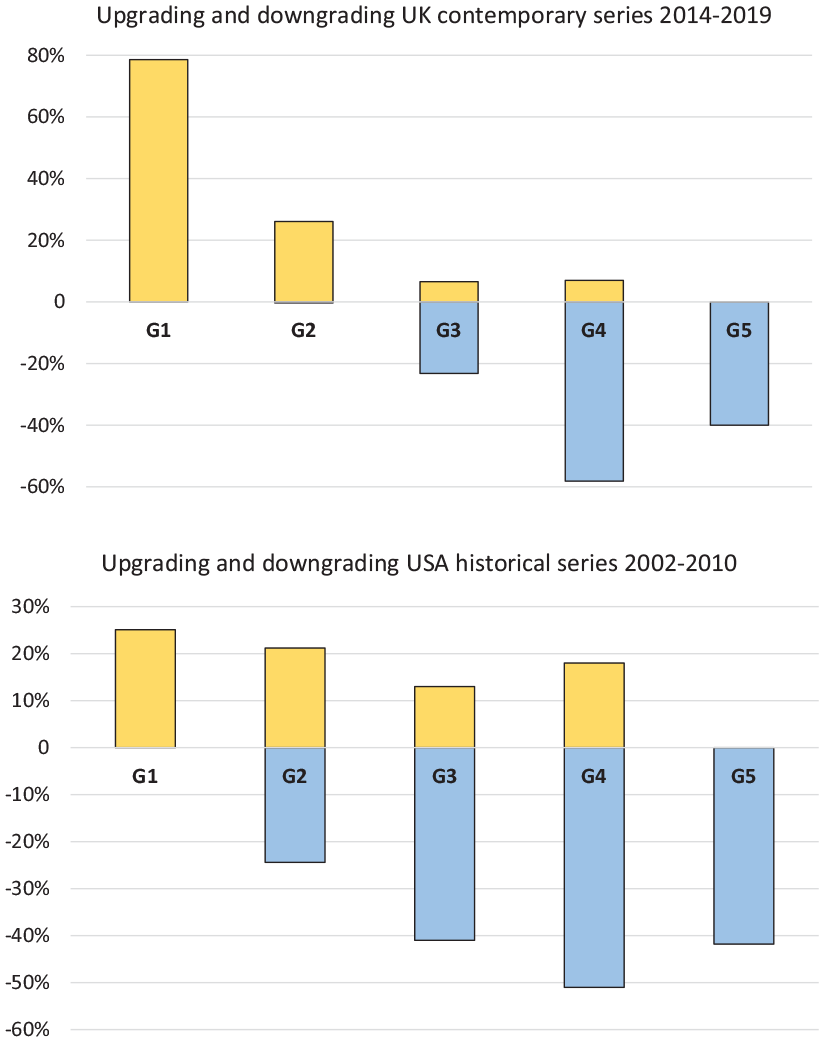
Proportions (%) of upgrading or downgrading at radical prostatectomy by biopsy grade group (G, x-axis) in this series (top) compared to a large historical series from the USA (bottom).
We saw an opportunity to do a study comparing preoperative Likert score to radical prostatectomy specimen pathology that would be much more accurate in its risk correlations than previous studies using only biopsy specimens. We wondered if an age cut-off of <60 might prove as useful as a PSAD cut-off of <0.15 in defining a lower-risk group in Likert III. We chose age 60 because in a prior local audit of 458 TRUS prostate biopsies performed from 2010 to 2013, we found that high-grade disease occurred much less commonly in those aged <60. The same local audit also found that the age cut-off of >70 significantly increased the proportions of high-grade prostate cancer (G4 and G5) from 4% to 12% for those with a PSA of <10, and from 20% to 28% for those with a PSA of >10. In an earlier local audit of 532 men from the current series, we also found increasing age by decade (<60, 60–70 and >70) increased the risk of finding high-risk cancer at radical prostatectomy from 40% to 45% to 49%.
Increasing age is a known risk factor for high-grade cancer. In 2006, Bott 15 published that men >80 years of age with a PSA of >30 had a 97% chance of cancer, with 90% being Gleason 7 or worse. Indeed, in men with a PSA of >50, the median grade was 8 (n=210). This study was based on TRUS biopsy in the era before pre-biopsy MRI. This sparked our interest in increasing age as a clinically very useful risk factor for high-risk prostate cancer.
Patients and methods
A total of 732 consecutive cases of robotic-assisted laparoscopic prostatectomy (RALP) from May 2014 to 2019 had been recorded on a local hospital audit database. The database was anonymised and kept securely on the hospital server. Men who waited >150 days from biopsy to RALP were excluded. The demographics of the resulting 610 cases are shown in Table 1 and their National Comprehensive Cancer Network (NCCN) risk groupings shown and colour coded in Table 2. These 610 were further reduced to 443 before final analysis because not all cases (especially earlier in the series) had a complete and valid preoperative MRI scan result. For example in some cases the diffusion weighted images were degraded by artefact or of poor quality, or the sagittal plane was missing for complete volume assessment. (Supplemental Table S7 Exclusions, not shown).
Demographics.
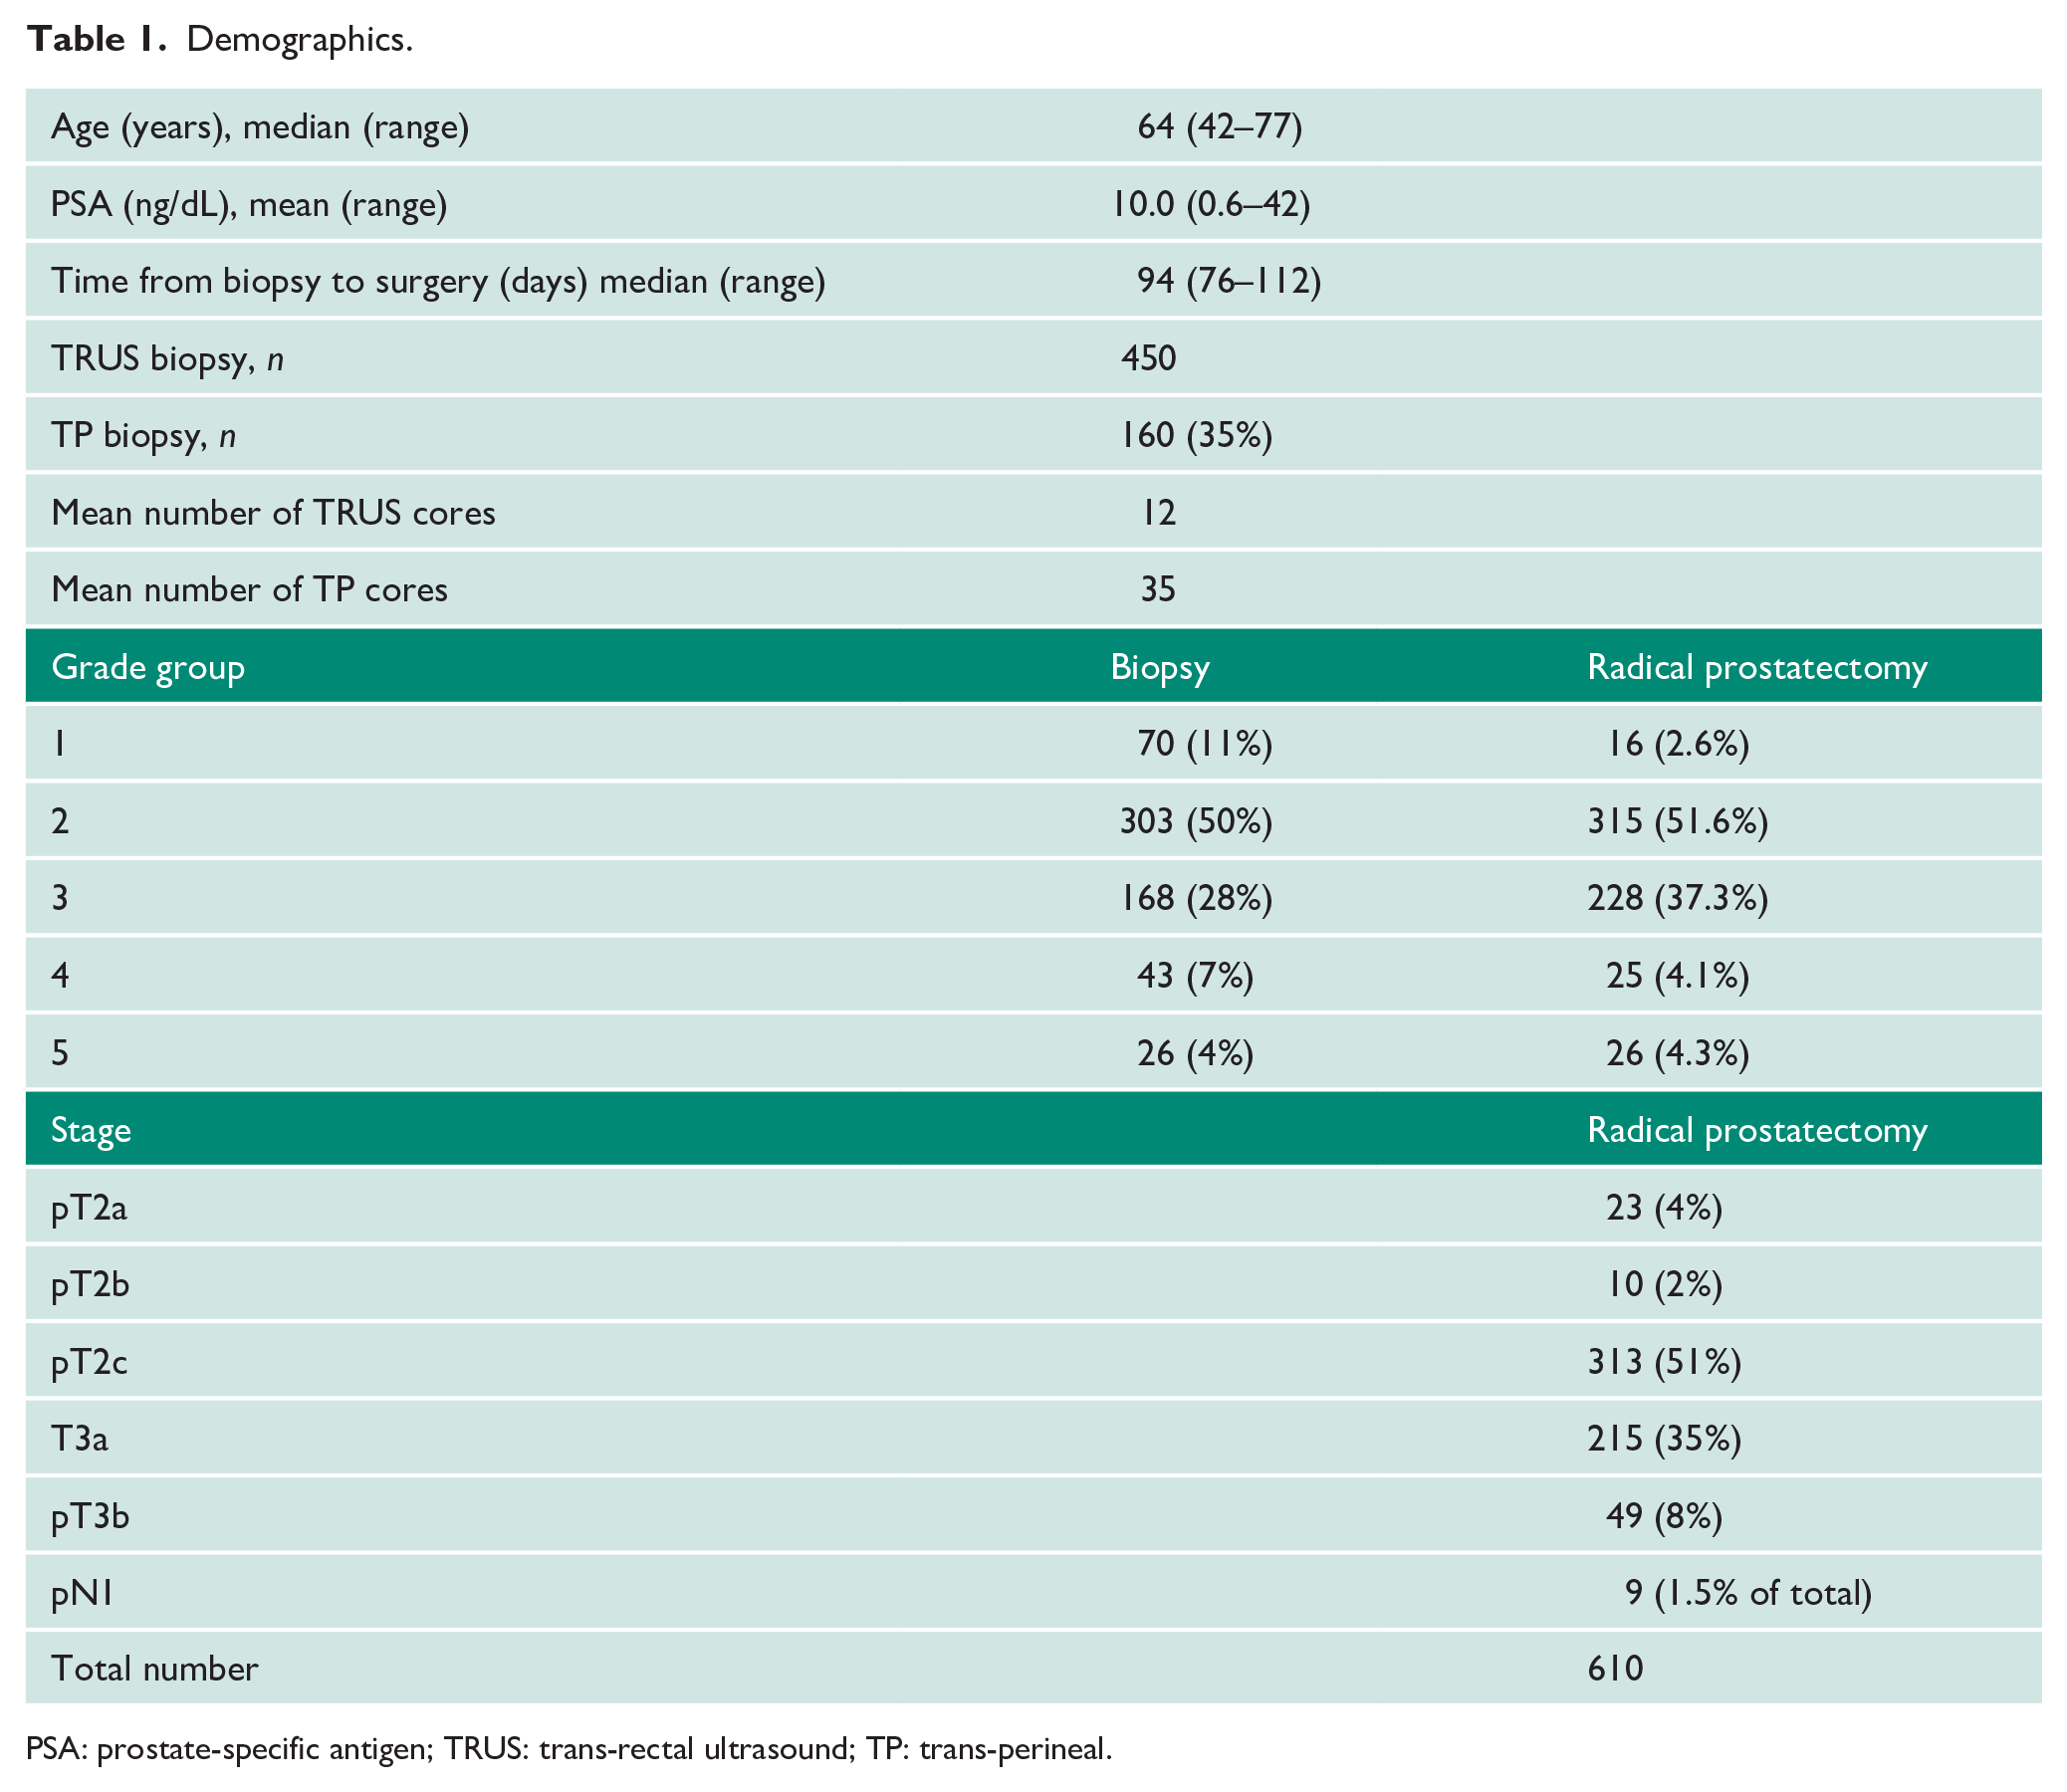
PSA: prostate-specific antigen; TRUS: trans-rectal ultrasound; TP: trans-perineal.
Absolute numbers of stages and grades at RALP as broadly classified by the NCCN risk groupings.
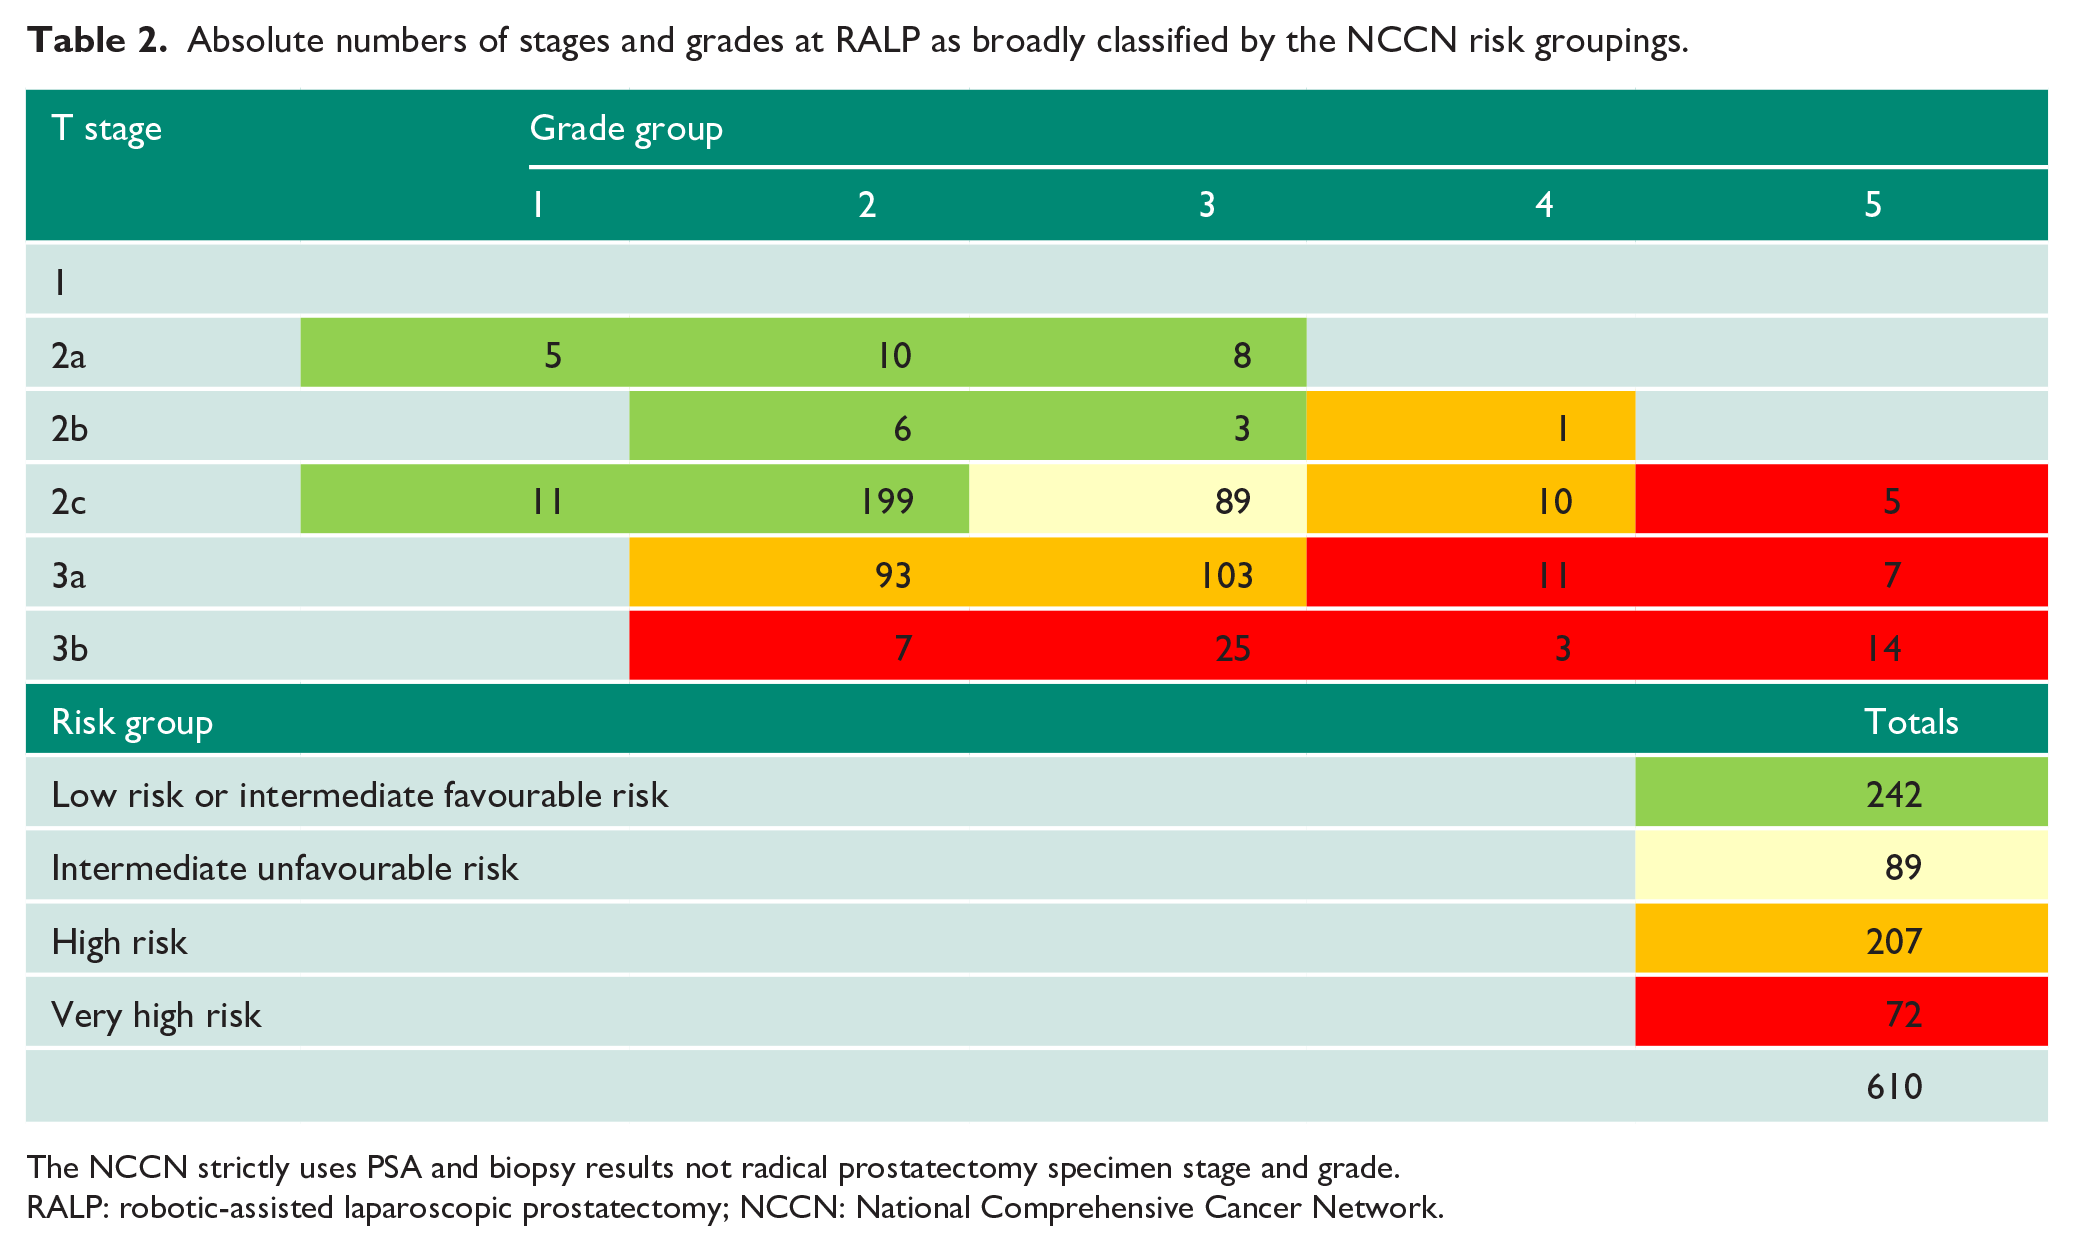
The NCCN strictly uses PSA and biopsy results not radical prostatectomy specimen stage and grade.
RALP: robotic-assisted laparoscopic prostatectomy; NCCN: National Comprehensive Cancer Network.
All patients had pre-biopsy MRI. MRI was performed on a 1.5 Tesla scanner (GE 1.5T Signa; GE Healthcare, Chicago, IL) with no dynamic contrast enhancement. The precise MRI protocol used was: MRI bi-parametric prostate protocol: T2 TSE – sagittal, axial, coronal, FOV 20.0 cm, slice thickness 3.0 mm; T1 axial – FOV 45 cm, slice thickness 6 mm; B1400 – FOV 28 cm, slice thickness 3 mm; matrix ADC – FOV 28 cm, slice thickness 3 mm.
Two uroradiologists (J.G. and L.B.), with 25 and 5 years’ experience, respectively, blinded to the pathology results reviewed all the MRI images in our series for quality and to be sure that as many as possible had a valid prostate volume and Likert score where earlier in the series the reporting of these items was lacking.
After the MRI scan, we followed the 2018 UK consensus guideline in deciding whom to recommend for biopsy. 6 Patients with anterior or apical lesions were recommended to go straight to trans-perineal template (TP) biopsy rather than TRUS biopsy. All TP biopsies (35% of total) and most TRUS biopsies were performed by urology consultants with 5–25 years’ experience. TRUS biopsy used information from the pre-biopsy MRI as to the location of lesion(s) in order to aid in the direction of some of the core samples (cognitive targeting). TP biopsy was performed under general anaesthetic using the Ginsburg protocol and a template grid with 5mm spacing. An 18G spring-loaded core biopsy needle was used. An in-house pathologist following the ISUP Consensus on Gleason grading 2005 and 2014,14,16 and this was reviewed by a second uropathologist prior to multidisciplinary team discussion.
Risk groups based on the radical prostatectomy pathology were defined as per NCCN 2019 risk groupings 17 and colour coded (Table 2). Statistical analysis was performed using chi-square tests in Microsoft Excel using a custom-designed spreadsheet and checked by the trust statistician (C.F.) from the NHS research support team based at Gloucester Royal Hospital.
Results
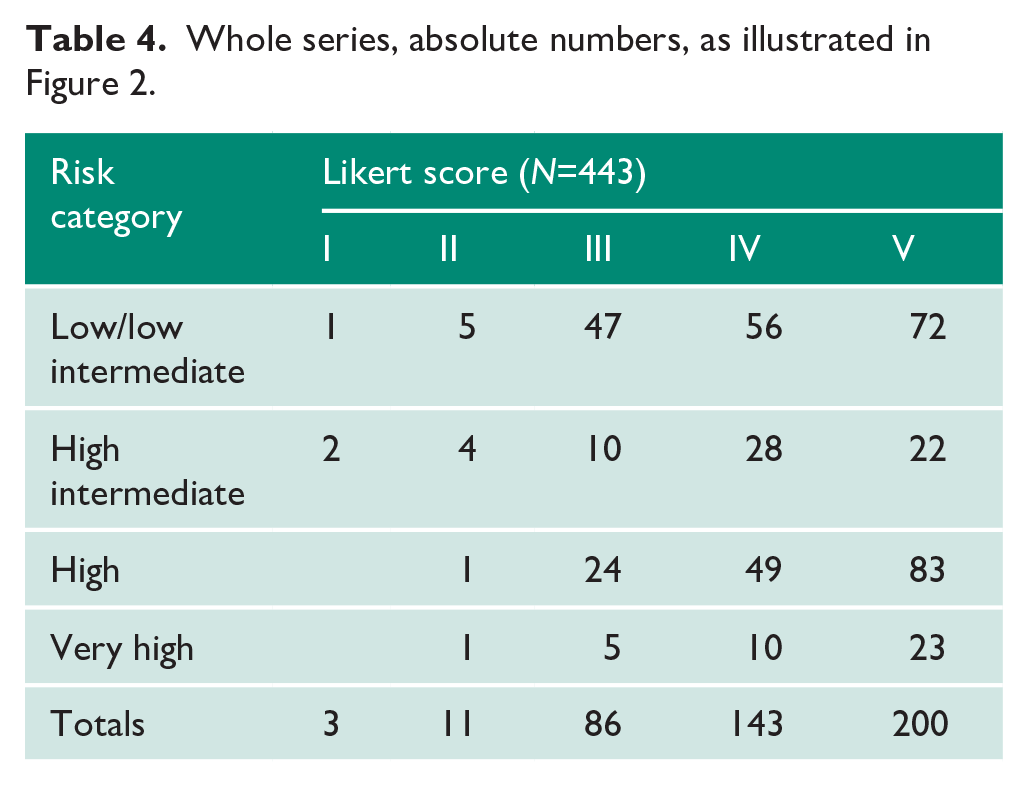
A summary table of p-values is shown in Table 3. Taking all 443 cases (Figure 2 and Table 4), there was a significant correlation of higher-risk cancers with higher Likert scores. There was significantly higher-risk cancer in Likert V than in Likert IV (p=0.018) and in Likert V than in Likert III (p=0.019). Likert III versus Likert IV did not reach significance (p=0.1).
Significance of the difference between the proportions of cancer between Likert scores in the full series and age 60 and PSAD 0.15 (χ2 test).
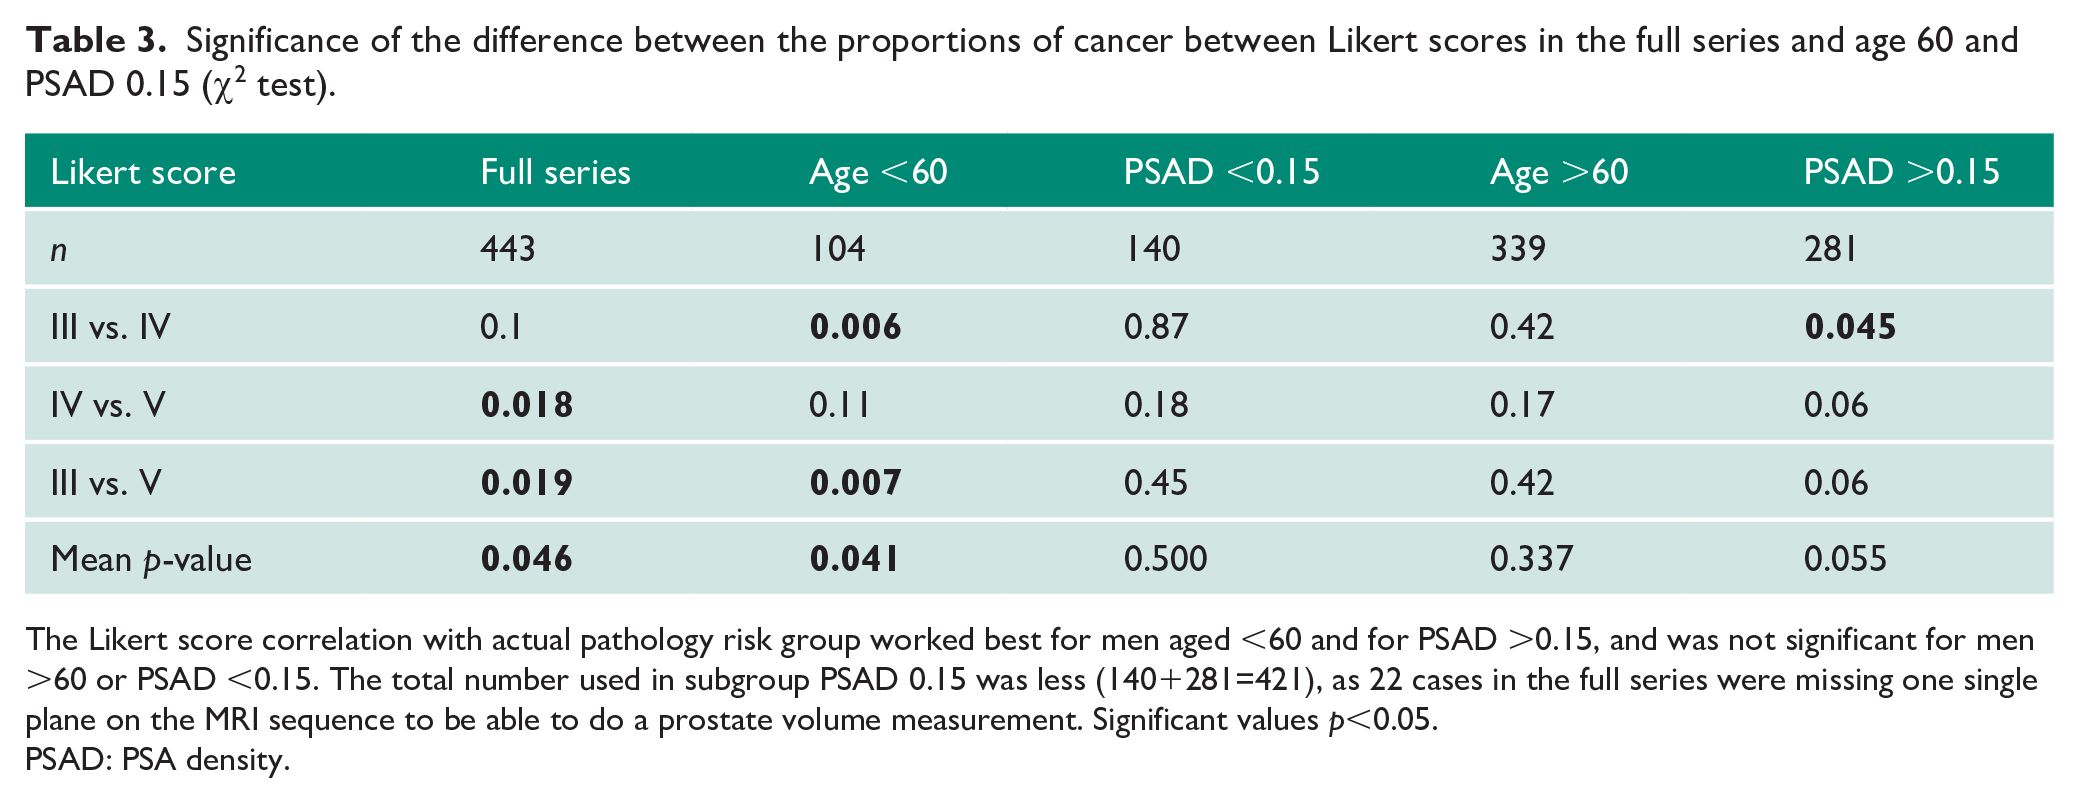
The Likert score correlation with actual pathology risk group worked best for men aged <60 and for PSAD >0.15, and was not significant for men >60 or PSAD <0.15. The total number used in subgroup PSAD 0.15 was less (140+281=421), as 22 cases in the full series were missing one single plane on the MRI sequence to be able to do a prostate volume measurement. Significant values p<0.05.
PSAD: PSA density.
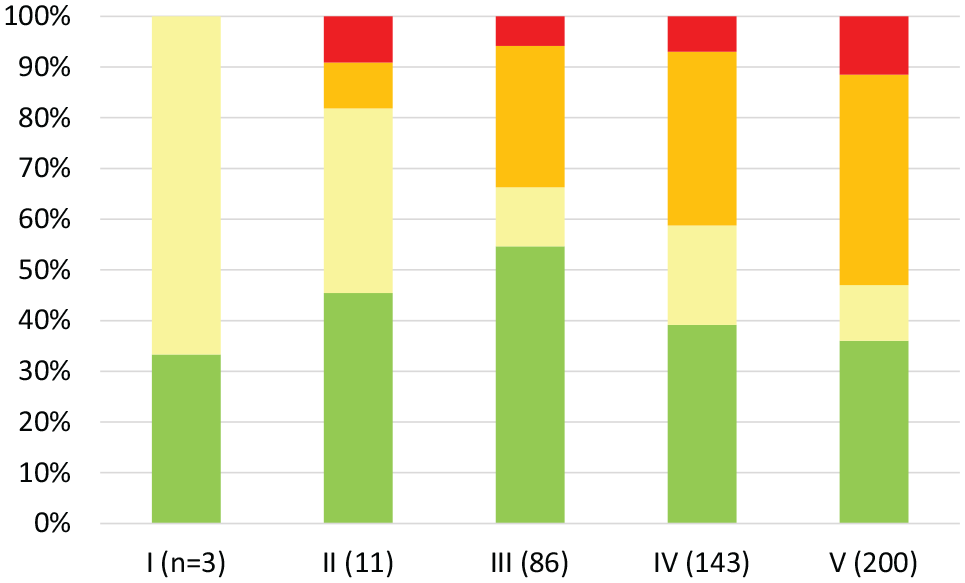
Magnetic resonance imaging Likert score (x-axis) and resulting proportions of radical prostatectomy National Comprehensive Cancer Network prostate cancer risk groups (y-axis) whole series.
Whole series, absolute numbers, as illustrated in Figure 2.
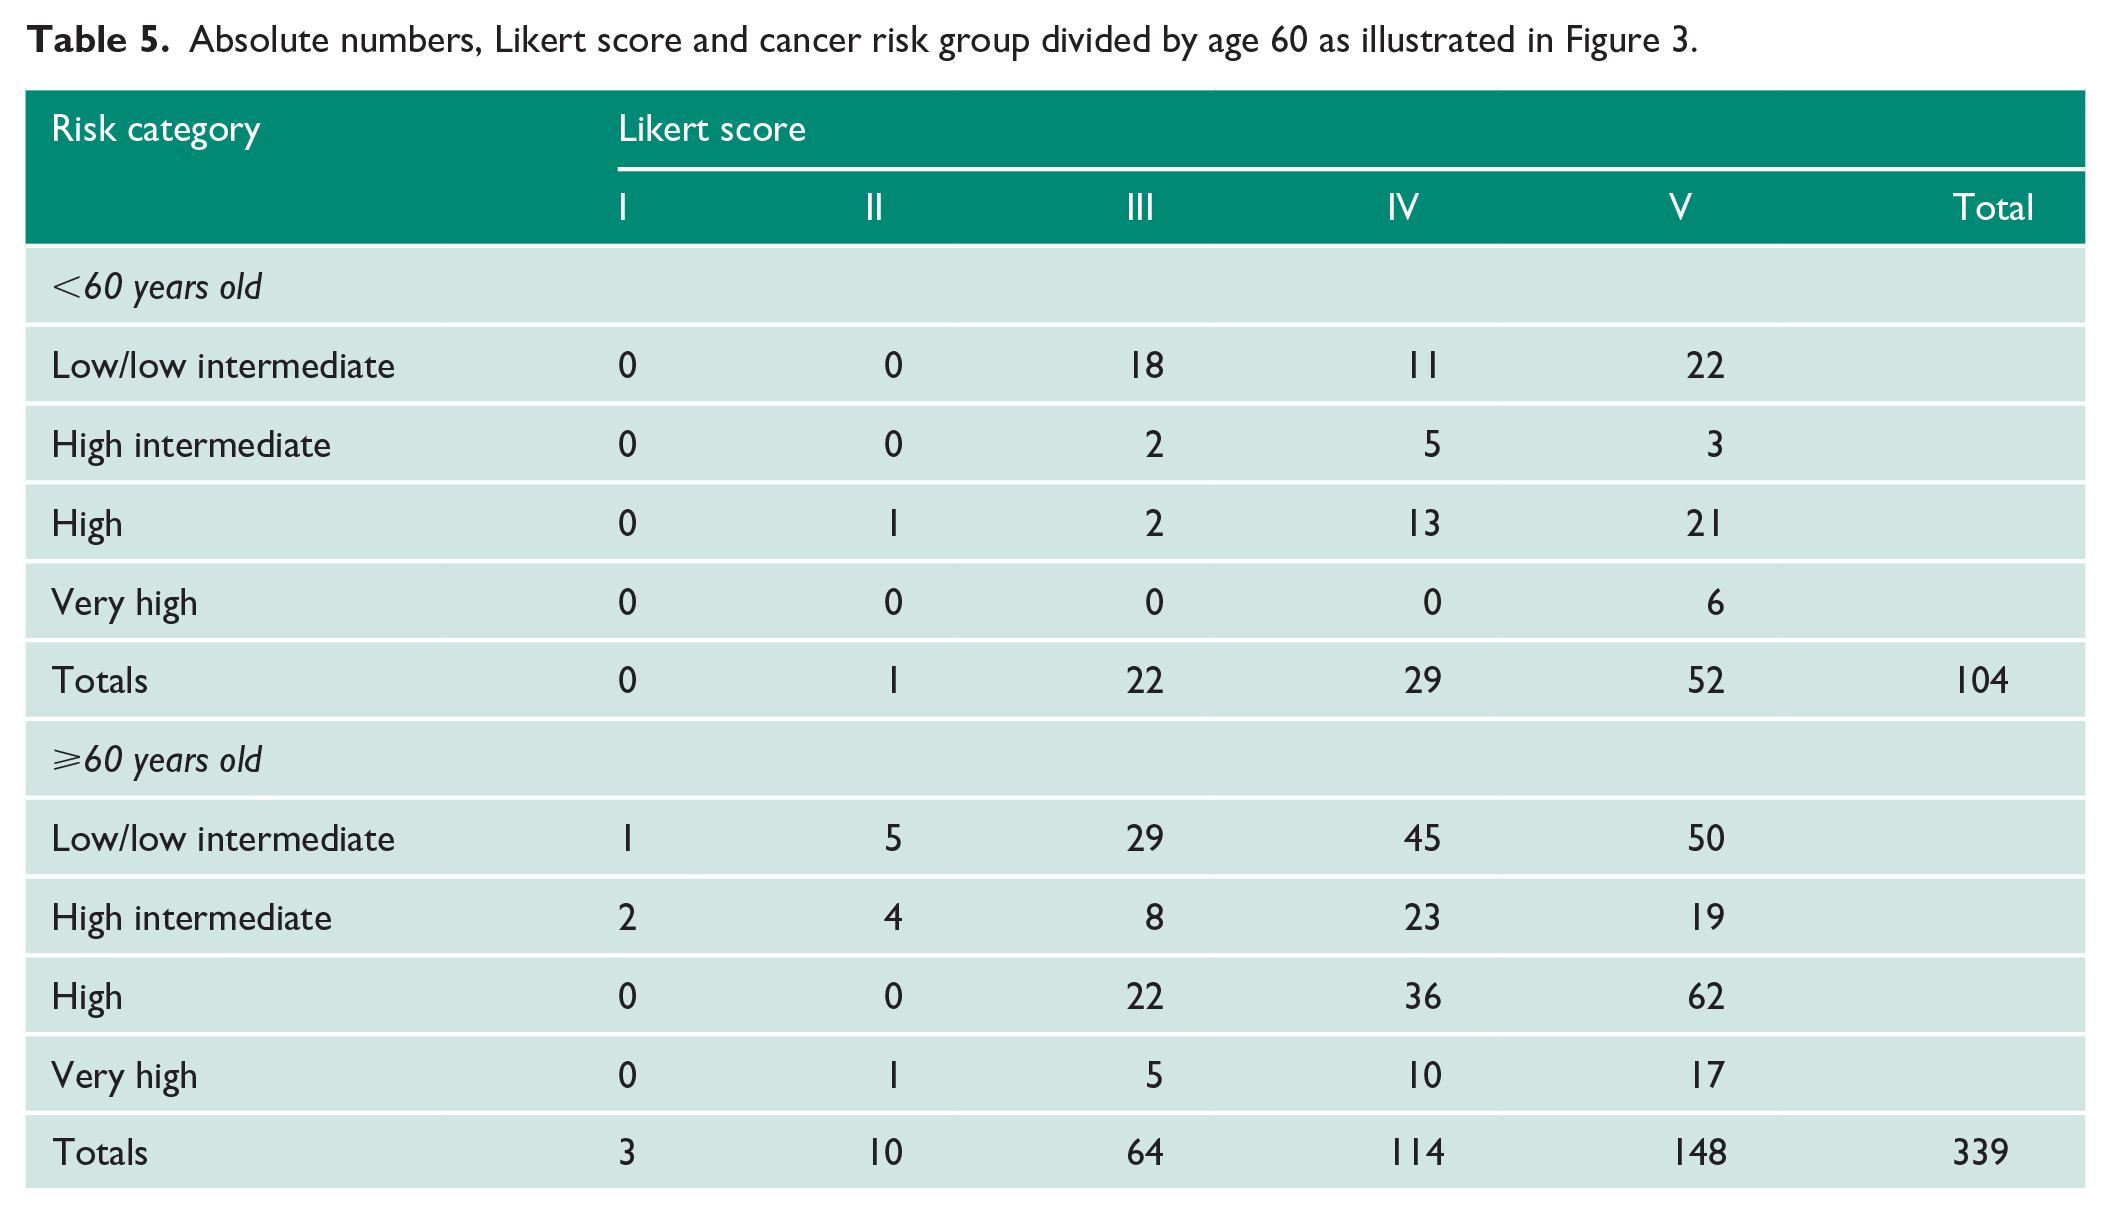
In the group of men split by age 60 (Figure 3 and Table 5), there were 443 cases. In the subgroup age <60, there were 104 cases, with a median PSA of 8.8 (range 3.2–22). In the subgroup age >60, there were 339 cases, a median PSA of 9 (range 1.8–42). There were significantly greater proportions of higher-risk cancers in the Likert III group >60 than in the group <60 (p=0.02), but there was no significant difference for Likert IV (p=0.27) or Likert V (p=0.12). In the subgroup age <60, there was significantly more high-risk cancer in Likert IV than in Likert III (p=0.006), and in Likert V than in Likert III (p=0.007). For age >60, however, this significant difference was lost (p=0.42 for both and p=0.17 for IV and V).
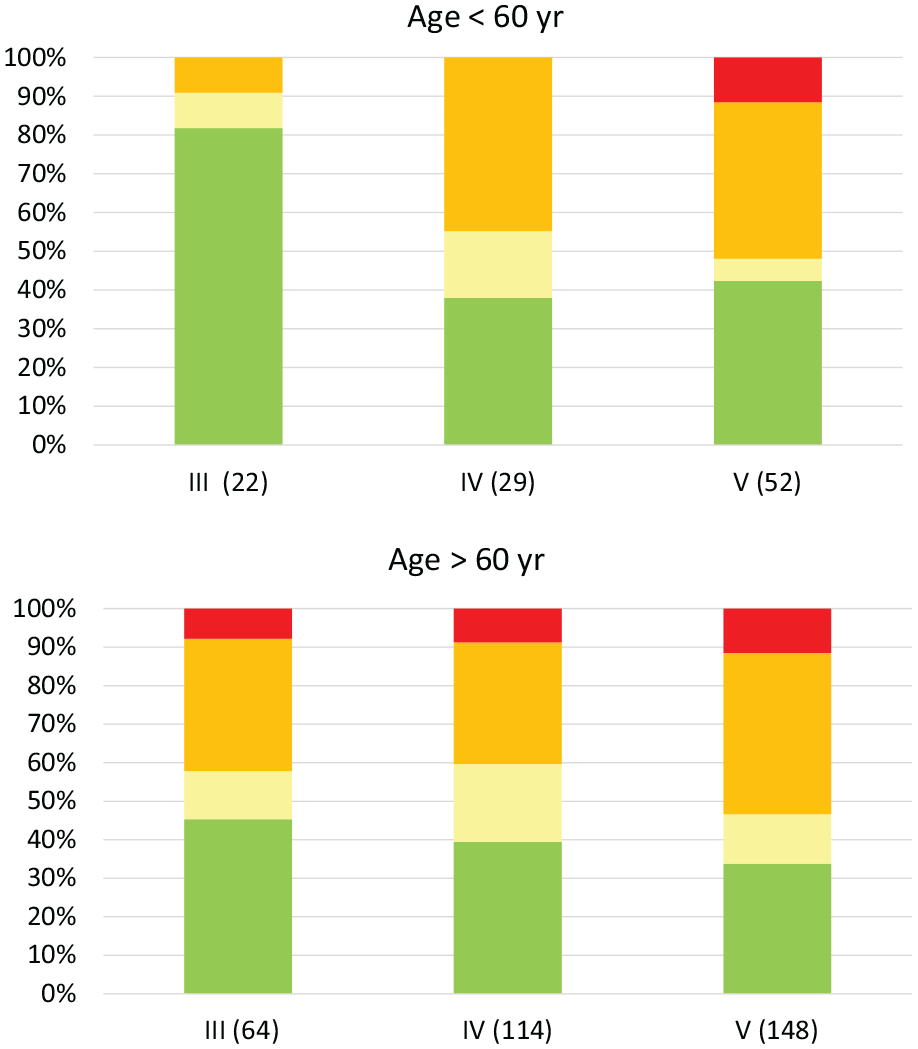
Likert score and resulting cancer risk group divided by age <60 and age >60.
Absolute numbers, Likert score and cancer risk group divided by age 60 as illustrated in Figure 3.
In the subgroup of men split by PSAD 0.15 (Figure 4 and Table 6), there were slightly fewer cases (421 in total) due to the fact that not all of the 443 cases above had complete prostate volume data. Twenty-two cases were missing one single plane on the MRI sequence to be able to do a prostate volume measurement. In the subgroup PSAD <0.15, there were 140 cases, with a median PSA of 6.1 (range 0.6–15). In the subgroup PSAD >0.15, there were 281 cases, with a median PSA of 7.4 (range 3–42). There were significantly greater proportions of higher-risk cancer only in the Likert IV PSAD >0.15 group (p=0.0006; Likert III p=0.78 and Likert V p=0.51). In the subgroup PSAD <0.15, there was no significant difference between any of the three main Likert groups (p=0.18, 0.87 and 0.45).
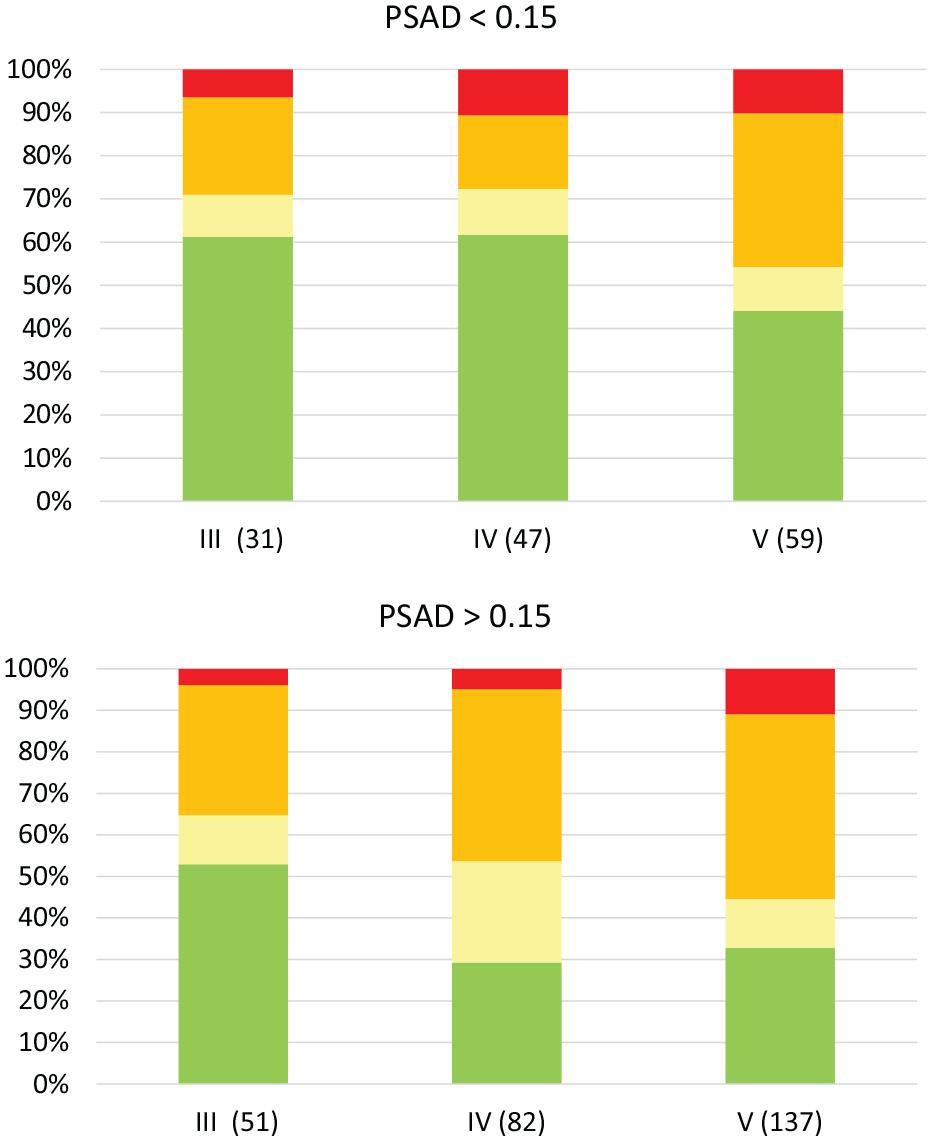
Likert score and resulting proportions of cancer risk groups when divided by prostate-specific antigen density 0.15.
Absolute numbers, Likert score and cancer risk group divided by PSAD <0.15, as illustrated in Figure 4.
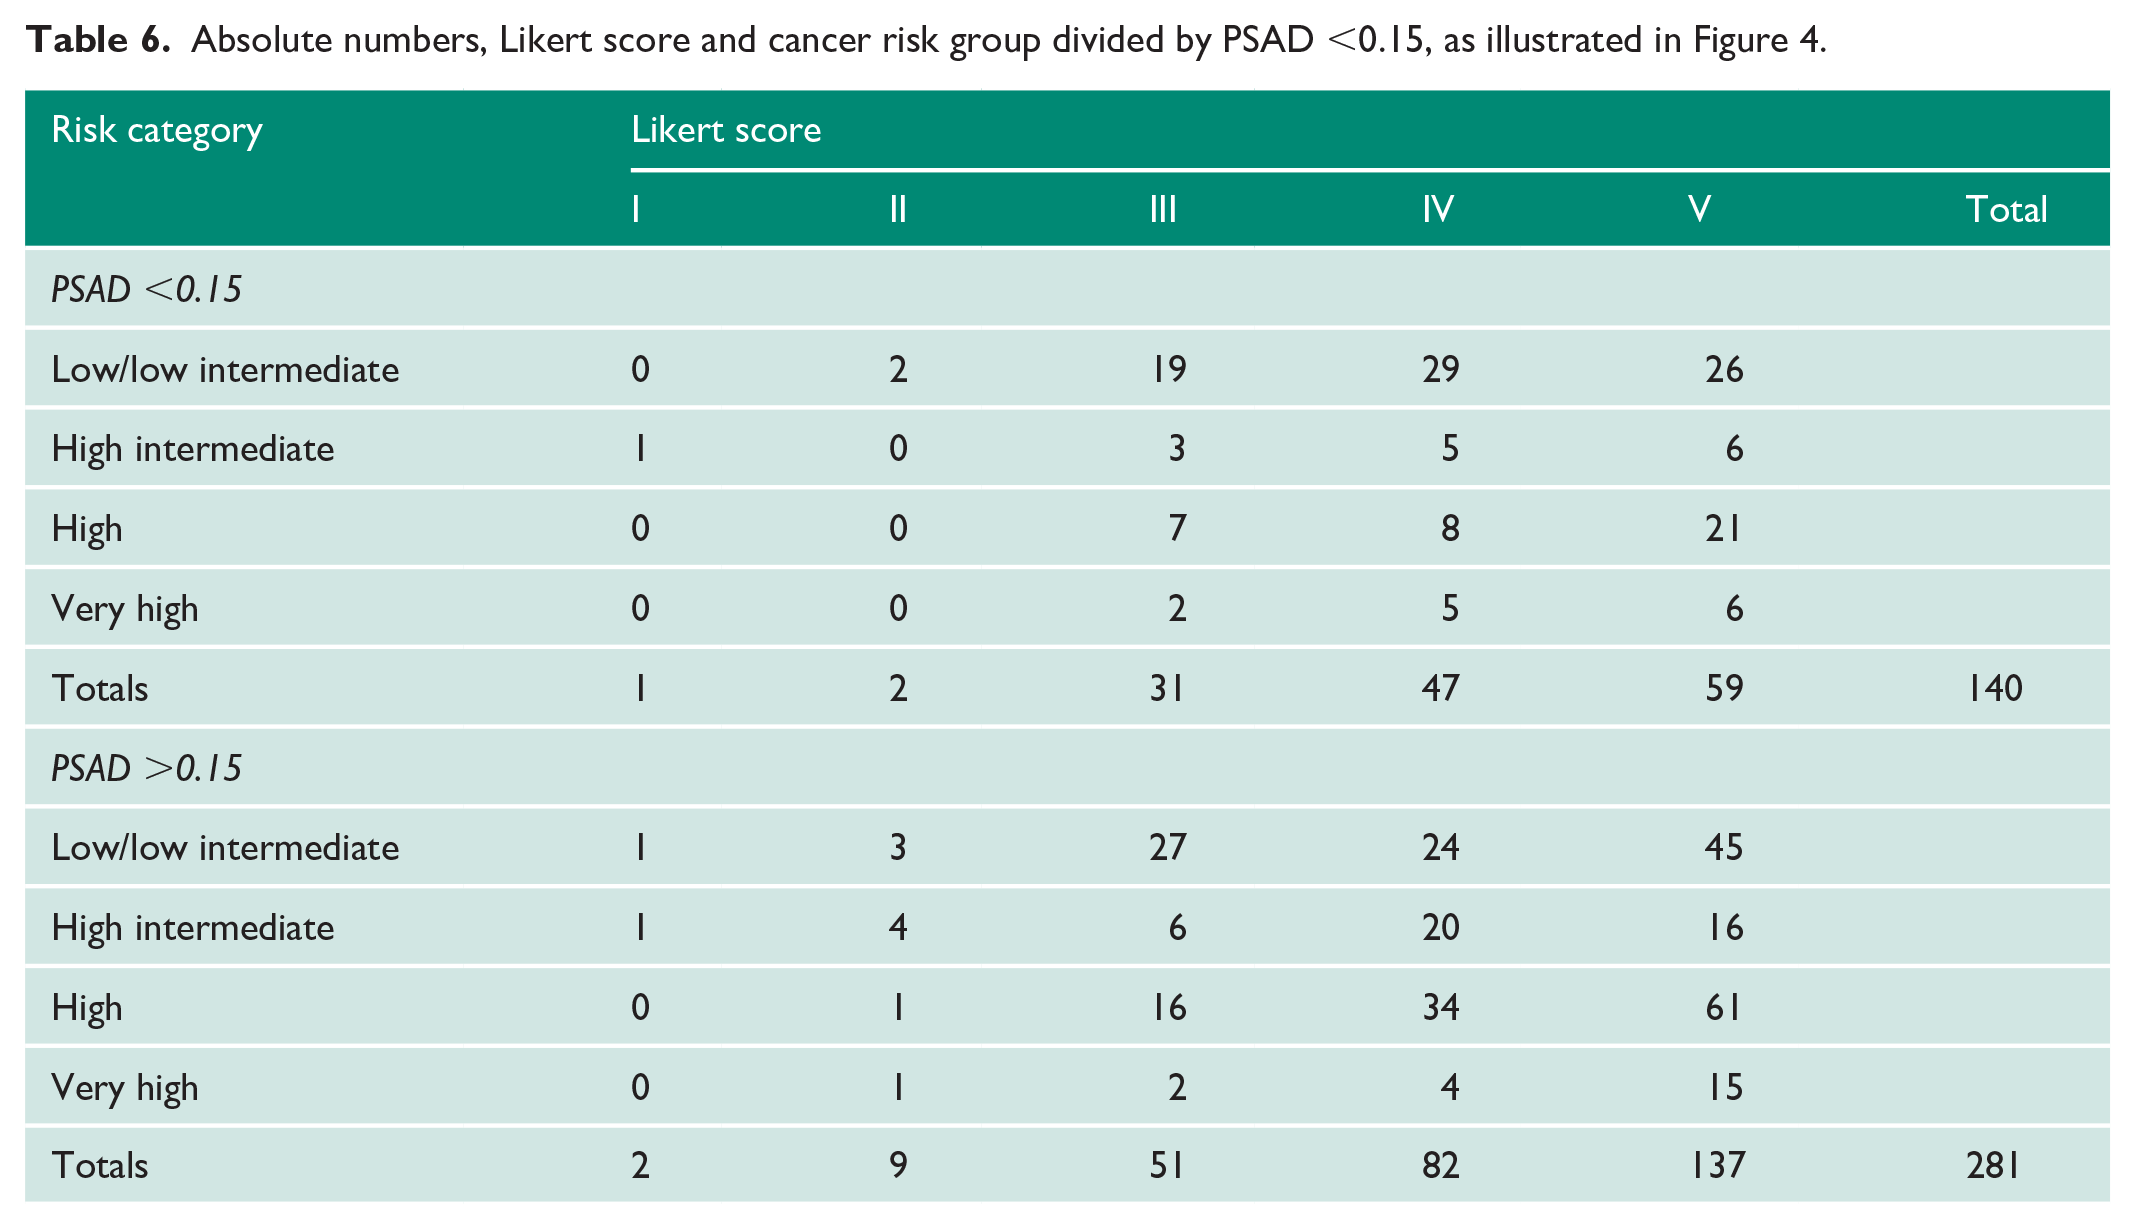
Further subgroup analysis within Likert III (n=86) found that men <60 (n=22) had neither high-grade (G3 or G4 or G5) nor very high-risk disease. There were only two high-risk cases, both of which were G2T3a (2/22; 10%). In men with Likert III and PSAD <0.15 (n=31), there were seven high-risk and two very high-risk cases (9/31; 25%). This difference was not significant (p=0.31).
In men with Likert III and aged >60 (n=64), the rate of high risk disease was 42%. Twenty-two were high risk, and five were very high risk (27/64; 42%). In men with Likert III and PSAD >0.15 (n=51), there were 16 high-risk and two very high-risk cases (18/51; 35%). This difference was also not significant (p=0.76).
The majority of all high-risk or very high-risk cases in men <60 were Likert IV or V (40/43; 93%).
PSAD 0.1, 0.12 and 0.2 were also analysed in an exactly the same way (Supplemental Graphs 5–7). In this series, 10% (45/421) of men had PSAD <0.1, making it the smallest of all the subgroups. Only eight men had Likert III and PSAD <0.1. Within this very small subgroup, there was one high-risk and one very high-risk case.
Discussion
Excluding cases that waited >150 days is very important for a study of this nature. There is good evidence that delay from biopsy to surgery of >150 days for our average risk cancer (G2 or G3 T2) can result in upgrading and or upstaging, and for very high-risk cancers, a delay of even 30 days can make a difference. 18 Our median waiting time of 94 days for surgery should not have affected the overall result. In our department, we prioritise NCCN high-risk cases within 60 days.
Many studies show a significant link between increasing age and increasing proportions of higher-grade and higher-stage prostate cancer. In the Prostate Cancer Prevention Trial, there was an increasing risk of finding high-grade cancer with each five-year increment from 55 to 75 in 5519 men. 19 In the Baltimore Longitudinal Study of Aging (N=745), men developing high-grade cancer were significantly older (median age 60 years) compared to the rest (median age 51 years; p<0.001). 20 Men aged >70 on active surveillance are also at increased risk of progression (n=1625). 21 In our own local audit of 500 TRUS results from 2010 to 2013, we found that approximately 70% of all high-grade cancer occurs in men >70. This perhaps explains why the European screening trial only reduced mortality by 20%. It mostly screened men <70 and not very often (every two years). Given that in the UK, we often radically treat men with good performance status and high-risk disease up to the age of 80, and we now know that high-risk cancer can progress stage within three months, 18 this might explain why the European screening trial was so disappointing. If we had screened men with good performance status age 70–80 more often not less often, perhaps with a PSA every six months, it may have been more effective. PSA can be screened by post now either on a finger-prick sample or by the point-of-care test in development by Surescreen UK that tests positive when PSA is >3 or 10 (pers. commun. from the company to the author).
If older age is a useful risk factor for high-grade cancer, then it follows that younger age should be a useful factor for determining who likely has low-risk cancer; especially if we learn how to combine it usefully with other risk factors such as PSA, prostate volume, PSAD and Likert score results.
Limitations of this study include the fact that the actual numbers of men having RALP in the subcategory Likert III and PSA <0.15 (n=22) and Likert III and age <60 (n=31) were small. However, this is probably because such cases are not often selected for surgery. It may well be that surgeons are already preferentially biopsying men or treating men with PSAD >0.15 and/or Likert IV and V rather than Likert III or PSAD <0.15. A second limitation of this study is that we did not collect information on other important risk factors such as a family history of prostate cancer in first-degree relatives, which clinically is used by some urologists to help in the decision of whether to biopsy, for example, a younger man with Likert III. A third limitation of this study is that we did not examine the effect of lesion size or lesion location. Lesion size on MRI would have been interesting to examine because prostate cancer volume correlates well with stage and grade.22,23 When there is complete information on stage and grade, tumour volume adds nothing to prognostic predictive power. 24 However, at the point when the MRI is performed, we do not have accurate information on stage and grade. So, lesion size on MRI could be very useful in deciding who to biopsy. Some reported Likert IV lesions can be very small (5 mm). A similar but larger multi-centre study including these and other risk factors for low- or high-grade disease would be very informative.
This study sheds some light on one of the main dilemmas in prostate cancer diagnosis: which young men <60 to biopsy. It is very reassuring that Likert score correlation with final pathological risk group in this subgroup of men <60 remains statistically significant compared to the overall series. This can be seen when comparing Figure 3 (age <60) to Figure 2 (overall series) and the p-values (p=0.006 for <60 vs. p=0.02 for the overall series). This suggests that in this subgroup, at least Likert III truly is at significantly lower risk than Likert IV and Likert V, and could in many cases (excluding perhaps those without other risk factors such as a strong family history) safely avoid a biopsy.
The correlation between Likert score (III–V) and prostate cancer risk group was also confirmed in the large subgroup PSAD >0.15 (n=281). As expected, there were significant numbers of high-risk cases in the Likert III and PSAD >0.15 group (18/51), confirming the current UK consensus guidelines that this group should be biopsied. It is reassuring that Likert score is discriminating risk significantly within this group.
The significant correlation of Likert score (III–V) and prostate cancer risk group, however, was no longer significant in the subgroups PSAD <0.15 and men >60. These were not small subgroups (n=140 and n=339, respectively). So, we cannot easily dismiss this result. Perhaps this is because older men >60 with low PSAD <0.15 are more likely to have benign prostatic hyperplasia, so diluting the efficacy of the Likert score correlation. Having said that, in older men with Likert III, there were high rates of high-risk disease (42%), which was not a significantly different rate from that found in older men with PSAD >0.15 (35%). All we can say is that the correlation seems to hold best in men <60 and PSAD >0.15, and >60 Likert III is not low risk enough to recommend avoiding biopsy.
The fact that there was one high-risk and one very high-risk case even in the PSAD <0.1 Likert III group (n=8) suggests that age <60 Likert III may be at least as useful and if not more useful than PSAD <0.1 Likert III in defining a lower-risk group to avoid biopsy or treatment, as it would naturally apply better to younger men.
Of course, our series is a group of highly selected men. However, by correlating Likert scores to definitive radical prostatectomy specimen staging and grading, this study is more precise and accurate than previous studies using biopsy results alone. This study avoids the problem of 25–30% lack of concordance between biopsy grade and true radical prostatectomy grade mentioned in the introduction. Furthermore, there were also large numbers (n=93) in this series of G2 T3a within the high-risk group (n=207) – nearly half of all high-risk cases. Other studies using biopsy grade results alone would have classified this group of patients as intermediate risk not high risk. In fact, 30% (93/315) of all G2 (Gleason 3+4) cases were T3a. Presumably, it must be the 5–50% component of Gleason pattern 4 that is doing the invading rather than the Gleason pattern 3 which is not meant to have any molecular ability to invade.
In summary, age <60 and Likert III (median PSA 8.8; range 3–22) identifies a lower-risk group of prostate cancer at least equivalent to Likert III and PSA density <0.15. This may help in excluding such men from biopsy or treatment. The significant positive correlation of Likert score (III–V) with pathological risk group within the subgroup of men age <60 (p=0.041) but not within the subgroup of men with PSAD <0.15 (p=0.5) supports this conclusion.
Supplemental Material
sj-pdf-1-uro-10.1177_2051415821995107 – Supplemental material for Correlation of Likert scores III–V with increasingly worse pathology in radical prostatectomy specimens significant only for men aged <60 or PSAD >0.15, with age <60 as good as PSAD <0.15 at discriminating lower risk in Likert III
Supplemental material, sj-pdf-1-uro-10.1177_2051415821995107 for Correlation of Likert scores III–V with increasingly worse pathology in radical prostatectomy specimens significant only for men aged <60 or PSAD >0.15, with age <60 as good as PSAD <0.15 at discriminating lower risk in Likert III by Jonathan J Ord, Matthew Crockett, Jes Green, Lawrence TO Bell, Victoria Hicks, Hugh Crawford-Smith, Amanda Morss, Lucinda Poulton, Bilgy Pellisery, Mark Hayes, Linmarie Ludeman, Matthew Beasley, Rahul Fulmali, Mark Anniss, Elizabeth Barnes, Christopher Foy, Richard C Nayar, Faith McMeekin, Hugh Gilbert, Aloysius Okeke, Mehmood Akhtar, Biral Patel and Jonathan Eaton in Journal of Clinical Urology
Supplemental Material
sj-pdf-2-uro-10.1177_2051415821995107 – Supplemental material for Correlation of Likert scores III–V with increasingly worse pathology in radical prostatectomy specimens significant only for men aged <60 or PSAD >0.15, with age <60 as good as PSAD <0.15 at discriminating lower risk in Likert III
Supplemental material, sj-pdf-2-uro-10.1177_2051415821995107 for Correlation of Likert scores III–V with increasingly worse pathology in radical prostatectomy specimens significant only for men aged <60 or PSAD >0.15, with age <60 as good as PSAD <0.15 at discriminating lower risk in Likert III by Jonathan J Ord, Matthew Crockett, Jes Green, Lawrence TO Bell, Victoria Hicks, Hugh Crawford-Smith, Amanda Morss, Lucinda Poulton, Bilgy Pellisery, Mark Hayes, Linmarie Ludeman, Matthew Beasley, Rahul Fulmali, Mark Anniss, Elizabeth Barnes, Christopher Foy, Richard C Nayar, Faith McMeekin, Hugh Gilbert, Aloysius Okeke, Mehmood Akhtar, Biral Patel and Jonathan Eaton in Journal of Clinical Urology
Supplemental Material
sj-pdf-3-uro-10.1177_2051415821995107 – Supplemental material for Correlation of Likert scores III–V with increasingly worse pathology in radical prostatectomy specimens significant only for men aged <60 or PSAD >0.15, with age <60 as good as PSAD <0.15 at discriminating lower risk in Likert III
Supplemental material, sj-pdf-3-uro-10.1177_2051415821995107 for Correlation of Likert scores III–V with increasingly worse pathology in radical prostatectomy specimens significant only for men aged <60 or PSAD >0.15, with age <60 as good as PSAD <0.15 at discriminating lower risk in Likert III by Jonathan J Ord, Matthew Crockett, Jes Green, Lawrence TO Bell, Victoria Hicks, Hugh Crawford-Smith, Amanda Morss, Lucinda Poulton, Bilgy Pellisery, Mark Hayes, Linmarie Ludeman, Matthew Beasley, Rahul Fulmali, Mark Anniss, Elizabeth Barnes, Christopher Foy, Richard C Nayar, Faith McMeekin, Hugh Gilbert, Aloysius Okeke, Mehmood Akhtar, Biral Patel and Jonathan Eaton in Journal of Clinical Urology
Supplemental Material
sj-pdf-4-uro-10.1177_2051415821995107 – Supplemental material for Correlation of Likert scores III–V with increasingly worse pathology in radical prostatectomy specimens significant only for men aged <60 or PSAD >0.15, with age <60 as good as PSAD <0.15 at discriminating lower risk in Likert III
Supplemental material, sj-pdf-4-uro-10.1177_2051415821995107 for Correlation of Likert scores III–V with increasingly worse pathology in radical prostatectomy specimens significant only for men aged <60 or PSAD >0.15, with age <60 as good as PSAD <0.15 at discriminating lower risk in Likert III by Jonathan J Ord, Matthew Crockett, Jes Green, Lawrence TO Bell, Victoria Hicks, Hugh Crawford-Smith, Amanda Morss, Lucinda Poulton, Bilgy Pellisery, Mark Hayes, Linmarie Ludeman, Matthew Beasley, Rahul Fulmali, Mark Anniss, Elizabeth Barnes, Christopher Foy, Richard C Nayar, Faith McMeekin, Hugh Gilbert, Aloysius Okeke, Mehmood Akhtar, Biral Patel and Jonathan Eaton in Journal of Clinical Urology
Supplemental Material
sj-pdf-5-uro-10.1177_2051415821995107 – Supplemental material for Correlation of Likert scores III–V with increasingly worse pathology in radical prostatectomy specimens significant only for men aged <60 or PSAD >0.15, with age <60 as good as PSAD <0.15 at discriminating lower risk in Likert III
Supplemental material, sj-pdf-5-uro-10.1177_2051415821995107 for Correlation of Likert scores III–V with increasingly worse pathology in radical prostatectomy specimens significant only for men aged <60 or PSAD >0.15, with age <60 as good as PSAD <0.15 at discriminating lower risk in Likert III by Jonathan J Ord, Matthew Crockett, Jes Green, Lawrence TO Bell, Victoria Hicks, Hugh Crawford-Smith, Amanda Morss, Lucinda Poulton, Bilgy Pellisery, Mark Hayes, Linmarie Ludeman, Matthew Beasley, Rahul Fulmali, Mark Anniss, Elizabeth Barnes, Christopher Foy, Richard C Nayar, Faith McMeekin, Hugh Gilbert, Aloysius Okeke, Mehmood Akhtar, Biral Patel and Jonathan Eaton in Journal of Clinical Urology
Footnotes
Acknowledgements
We would like to thank Ms K. Davenport for her assistance and guidance in this research.
Conflicting interests
The authors declared no potential conflicts of interest with respect to the research, authorship and/or publication of this article.
Funding
The authors received no financial support for the research, authorship and/or publication of this article. However, we have applied for funding for the article to be published Open Access from Gloucestershire Royal Hospitals NHS Trust.
Ethical approval
Gloucestershire Royal Hospitals NHS Trust Research Support Group does not require ethical approval for reporting case series.
Informed consent
Written informed consent was obtained from a legally authorised representative for anonymised patient information to be published in this article.
Guarantor
J.J.O.
Contributorship
J.J.O. conceived the paper, and wrote most of the drafts, including statistics, illustrations and references. M.C. performed data collection and some Excel spreadsheet analysis, and helped to write a very early draft of the paper jointly with J.J.O. J.G. and L.T.O.B. reported many of the original MRI scans and reviewed all MRI results a second time, and helped write the radiological aspects of the manuscript. V.H. collected the Hereford series of prostate biopsy data from 2010 to 2013, as discussed in the introduction. H.C.S., L.P., B.Pe., M.An. and M.C. did most of the data collection. A.M. and L.P. counselled patients pre and post surgery. M.H., L.L., M.B., R.F. and E.B. reported all the pathology, and M.B. and R.F. advised on the histopathology aspects of the manuscript. C.F. helped advise on the best type of tests to use, checked the working of all the chi-square tests and reviewed and checked the presentation of statistics in the manuscript. He also advised on ethical approval. C.N., F.M., H.G., B.Pa. and J.J.O. performed template prostate biopsies. A.O., M.Ak., B.Pa. and J.E. performed all the robotic radical prostatectomies.
Supplemental material
Supplemental material for this article is available online.
References
Supplementary Material
Please find the following supplemental material available below.
For Open Access articles published under a Creative Commons License, all supplemental material carries the same license as the article it is associated with.
For non-Open Access articles published, all supplemental material carries a non-exclusive license, and permission requests for re-use of supplemental material or any part of supplemental material shall be sent directly to the copyright owner as specified in the copyright notice associated with the article.