
Abstract
Objective:
To update and externally validate a magnetic resonance imaging (MRI)-based nomogram for predicting prostate biopsy outcomes with a multi-centre cohort.
Materials and methods:
Prospective data from five UK-based centres were analysed. All men were biopsy naïve. Those with missing data, no MRI, or prostate-specific antigen (PSA) > 30 ng/mL were excluded. Logistic regression analysis was used to confirm predictors of prostate cancer outcomes including MRI-PIRADS (Prostate Imaging Reporting and Data System) score, PSA density, and age. Clinically significant disease was defined as International Society of Urological Pathology (ISUP) Grade Group ⩾ 2 (Gleason grade ⩾ 7). Biopsy strategy included transrectal and transperineal approaches. Nomograms were produced using logistic regression analysis results.
Results:
A total of 506 men were included in the analysis with median age 66 (interquartile range (IQR) = 60–69). Median PSA was 6.6 ng/mL (IQR = 4.72–9.26). PIRADS ⩾ 3 was reported in 387 (76.4%). Grade Group ⩾ 2 detection was 227 (44.9%) and 318 (62.8%) for any cancer. Performance of the MRI-based nomogram was an area under curve (AUC) of 0.84 (95% confidence interval (CI) = 0.81–0.88) for Grade Group ⩾ 2% and 0.85 (95% CI = 0.82–0.88) for any prostate cancer.
Conclusion:
We present external validation of a novel MRI-based nomogram in a multi-centre UK-based cohort, showing good discrimination in identifying men at high risk of having clinically significant disease. These findings support this risk calculator use in the prostate biopsy decision-making process.
Level of evidence:
2c
Introduction
Investigation of men with suspected prostate cancer has undergone significant changes in recent years. Multiparametric magnetic resonance imaging (mpMRI) has been shown to have high sensitivity and negative predictive value in detection of prostate cancer. 1 Its use has seen growing interest and is now recommended as part of the diagnostic pathway before biopsy is undertaken, in both the UK and European guidelines.2,3 Despite these advances, no single test can provide absolute certainty and a positive mpMRI finding does not guarantee the presence of clinically significant cancer. The prostate biopsy decision-making process between the clinician and patient can therefore be very complex. Detection of indolent disease may lead to overtreatment or active surveillance; the subsequent investigations or monitoring can potentially increase patient anxiety as well as subject them to the possible complications of biopsy.4–6 Appropriate counselling on when to biopsy is therefore highly important; different nomograms (or risk calculators) have been developed, utilising a variety of clinical parameters to predict the likelihood of prostate cancer detection in order to improve the diagnostic pathway and reduce unnecessary biopsy.
In a previous study, we had successfully developed an internally validated MRI-based nomogram with high accuracy for predicting systematic transperineal prostate biopsy outcomes using MRI Likert-type score, MRI-based prostate-specific antigen (PSA) density, patient age, and biopsy history as predictive parameters. 7 This nomogram has been incorporated locally and has proved an invaluable tool in counselling patients, thereby potentially reducing biopsies and their associated cost and morbidity. In this study, we used data gathered as part of a previously published prospective five-centre diagnostic cohort study to externally validate our nomogram. 8
Materials and methods
Full details for the methodology of data acquisition, cohort characteristics, and ethics are published elsewhere and are summarised here. 8 Prospective diagnostic data from five UK-based centres were analysed from the ‘Phi to refine MRI (PRIM) study’ (REC 03/018). All included men had upfront mpMRI and were biopsy naïve. Exclusion criteria in addition to the PRIM study were PSA > 30 ng/mL or any missing data required for the logistic regression analysis, such as prostate volume and mpMRI without Prostate Imaging Reporting and Data System (PIRADS) assessment; this left 506 men for analysis.
The mpMRI was performed on either 1.5T or 3T systems. Sequences included T2W, diffusion weighted imaging, and dynamic contrast enhancement (DCE) following local protocols. Images were all scored using PIRADS version 2 (PIRADSv2). Prostate volumes were calculated from mpMRI using ellipsoid approximation. Positive mpMRI was considered as PIRADS score ⩾ 3.
All men with a positive mpMRI had image-guided targeted biopsy (cognitive or fusion) in addition to systematic sampling. Men with negative mpMRI findings were offered systematic biopsy only. Biopsy modality was site dependent and consisted of both transrectal ultrasound (TRUS) and transperineal approaches. Cancer detected in any biopsy core (targeted or systematic) was considered as a positive result.
Data analysis was performed using STATA version 15.1 (StataCorp LLC, College Station, TX, USA). Logistic regression analysis was used to determine predictors of prostate cancer diagnosis for any cancer and clinically significant disease, which was defined as Gleason grade ⩾ 7 (International Society of Urological Pathology (ISUP) Grade Group ⩾ 2). Predictive characteristics used were age, PSA density, and PIRADS score. PSA density was calculated using pre-MRI PSA levels and MRI-derived prostate volumes. Receiver operating characteristic (ROC) curves were plotted for each centre and the area under the curve (AUC) values were compared using chi-square analysis. Performance was also evaluated using internal validation by generating 200 bootstrap samples. Nomograms for predicting prostate biopsy outcomes were developed for any cancer and Grade Group ⩾ 2. Sensitivity analysis was performed to re-calculate the AUC after exclusion of each site to assess for outliers.
Results
A total of 506 men were included in the analysis. The median age was 66 years (interquartile range (IQR): 60–69), median PSA was 6.6 ng/mL (IQR: 4.72–9.26), and median PSA density was 0.14 ng/mL2 (IQR: 0.10–0.25). PIRADS ⩾ 3 was reported in 387 (76.4%) cases. Overall detection of any prostate cancer was 318 (62.8%) and for Grade Group ⩾ 2 was 227 (44.9%). Full descriptive data are shown in Table 1; site-specific descriptive data are shown in Supplementary Table 1.
Study population details.
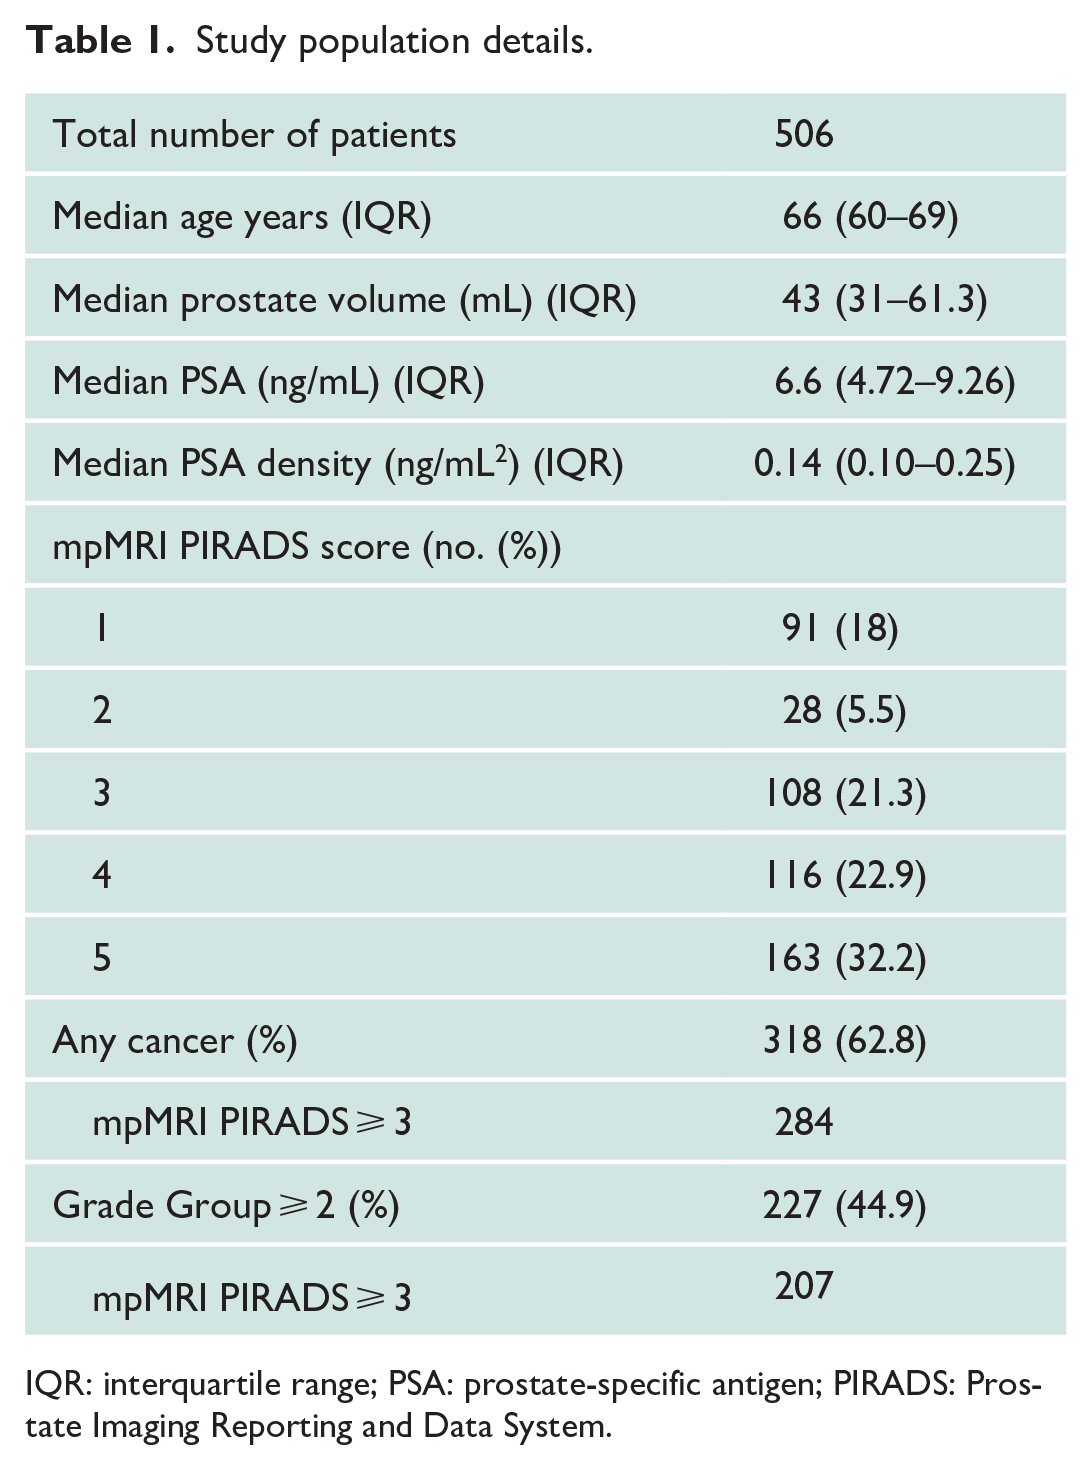
IQR: interquartile range; PSA: prostate-specific antigen; PIRADS: Prostate Imaging Reporting and Data System.
On logistic regression analysis, age, PSA density > 0.10 ng/mL2, and PIRADS score ⩾ 3 were found to be significant predictors for detection of any cancer on prostate biopsy. For Grade Group ⩾ 2, PSA density reached significance with results ⩾0.14 ng/mL2 and mpMRI was significant for PIRADS score 4 and above (Table 2).
Logistic regression analysis of predictive variables of prostate cancer.
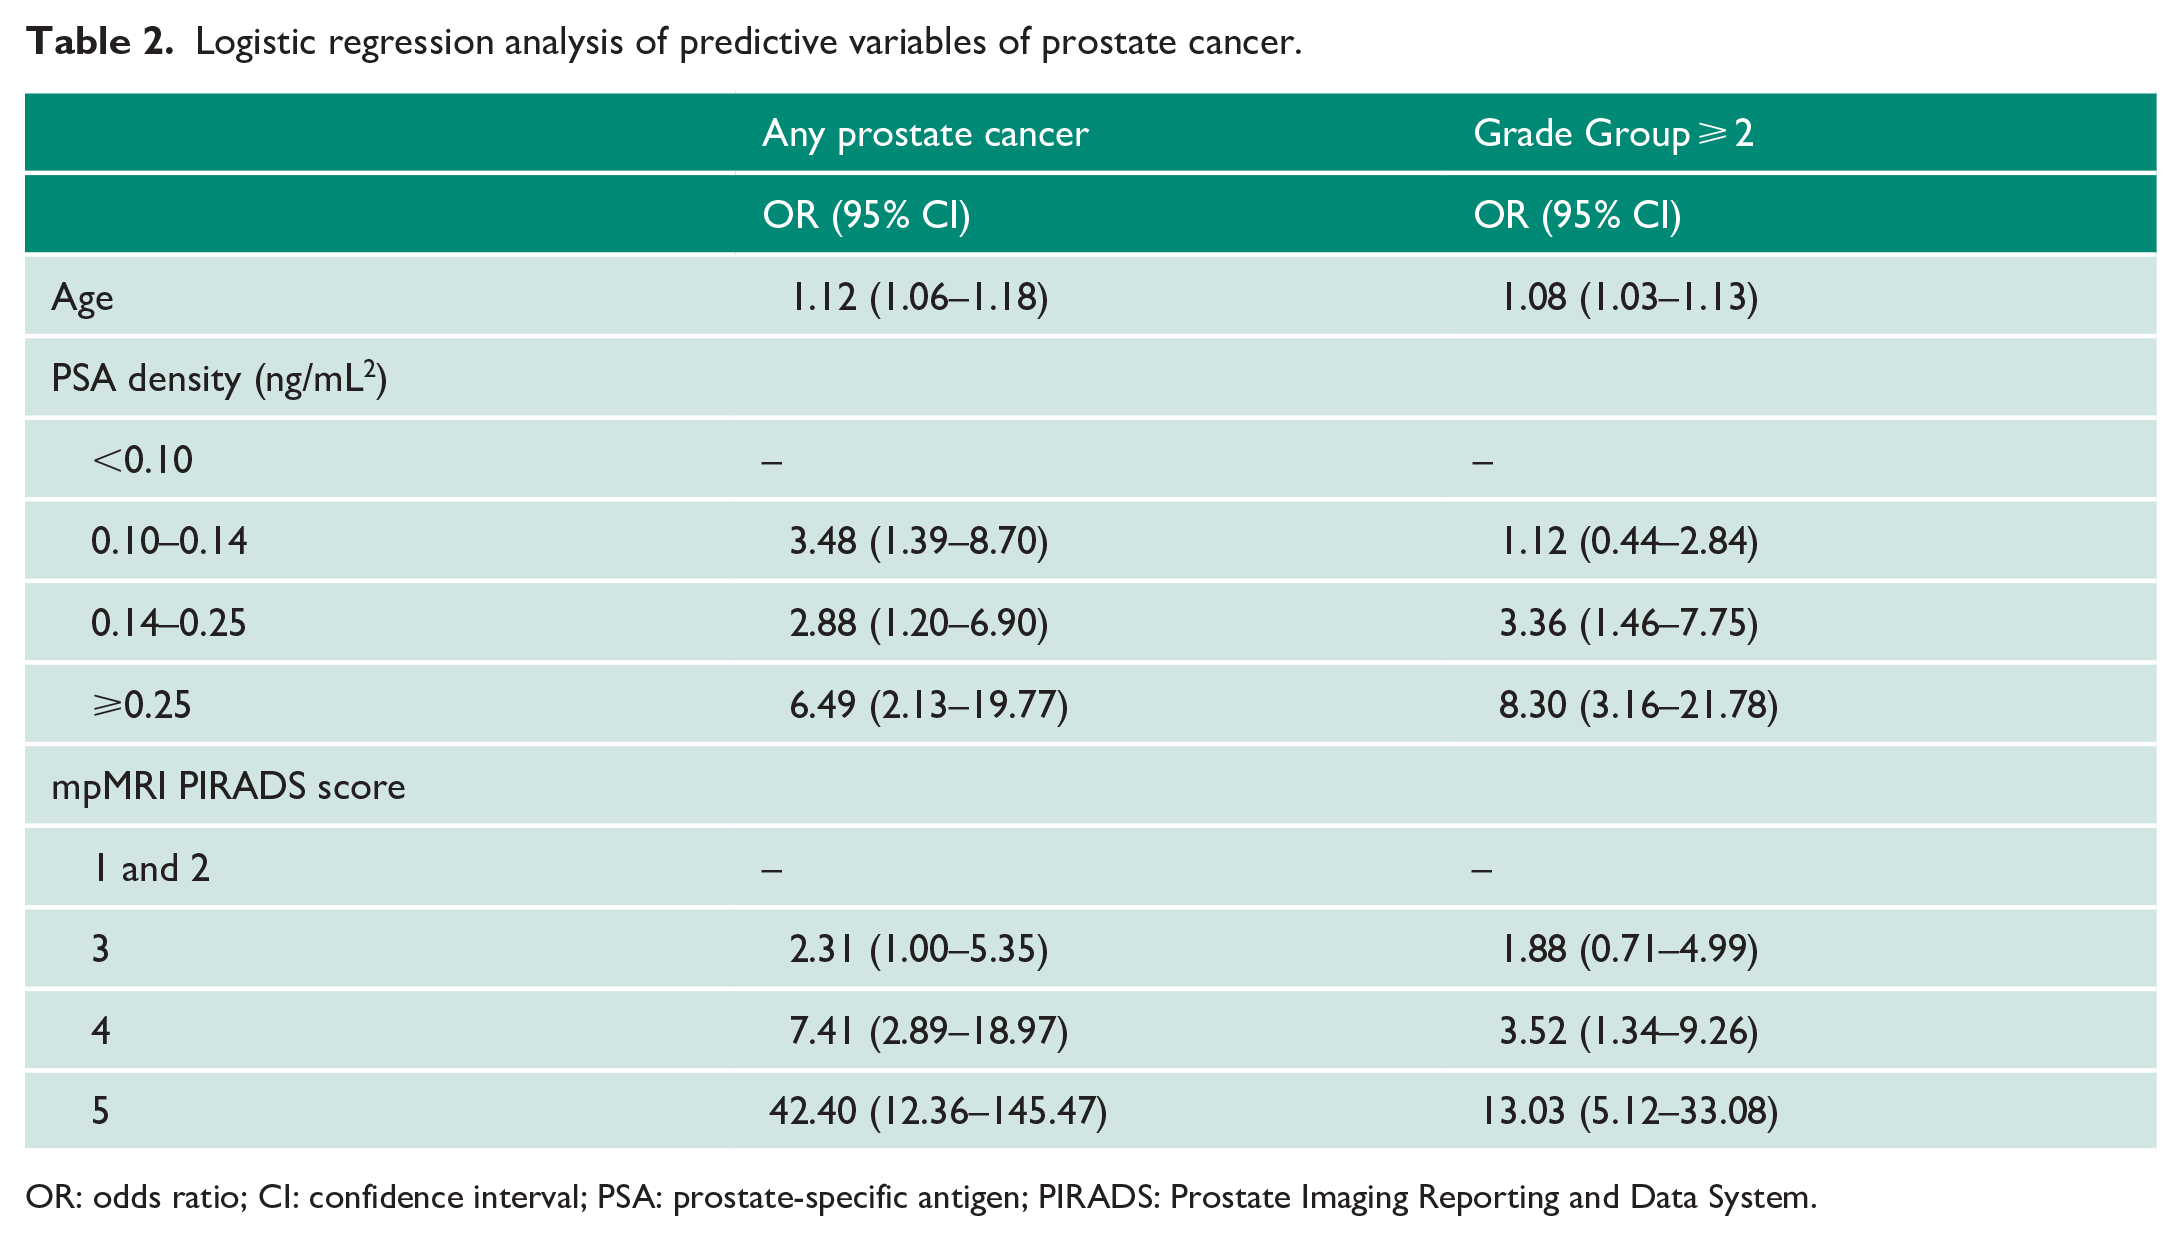
OR: odds ratio; CI: confidence interval; PSA: prostate-specific antigen; PIRADS: Prostate Imaging Reporting and Data System.
These factors were used in a combined predictive model and ROC curves were plotted for detection of significant and any prostate cancer. AUC values for significant cancer were 0.84 (95% confidence interval (CI) = 0.81–0.88) and for any prostate cancer 0.85 (95% CI = 0.82–0.88). These were also internally validated using 200 bootstrap samples with no significant differences found between data set or validation results, for either definition (Figure 1).
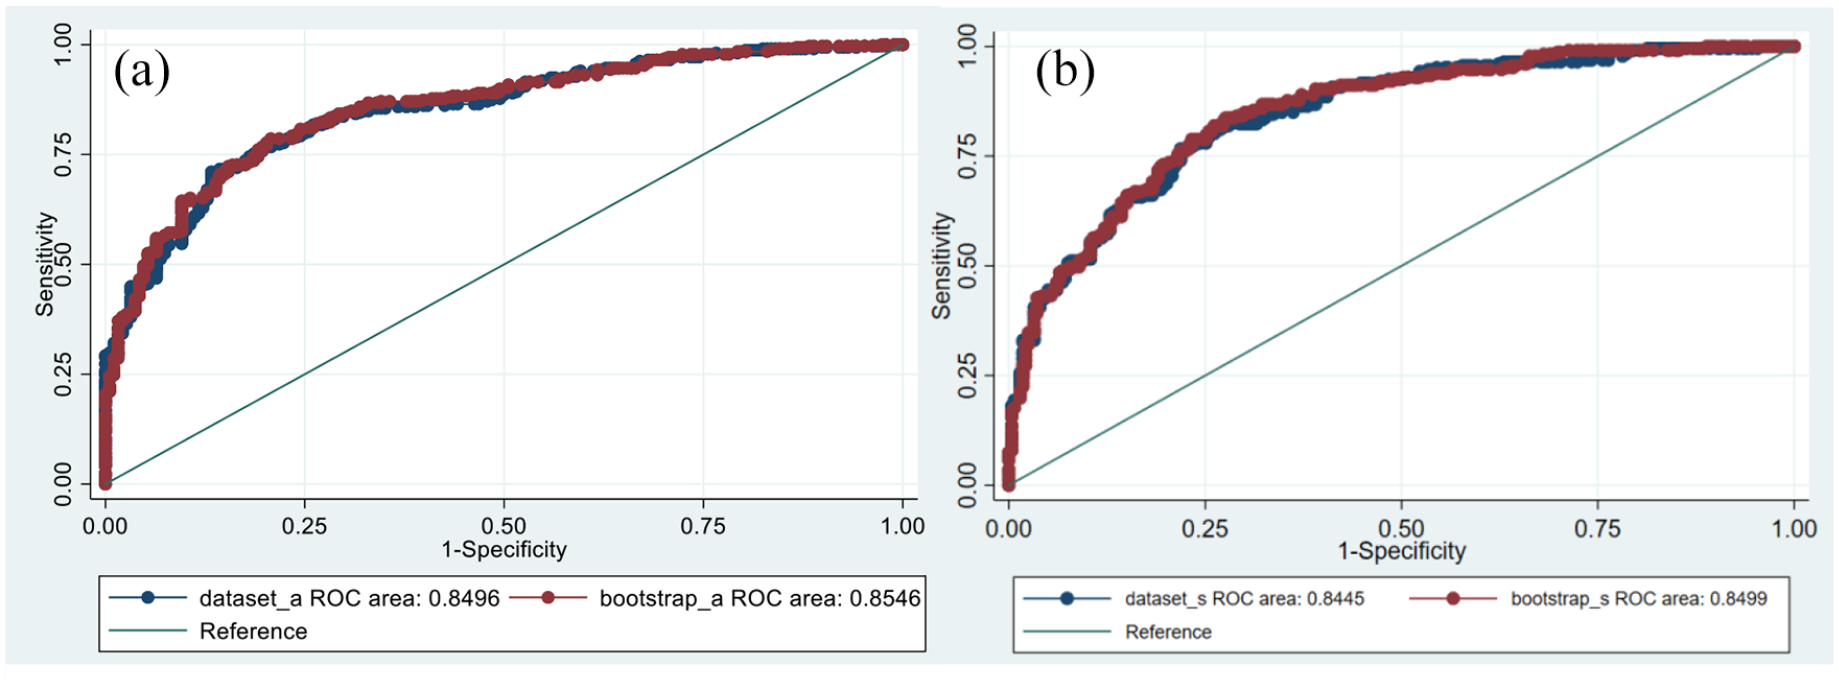
(a) ROC curve for detection of any prostate cancer. AUC 0.8496 for data set and 0.8546 for bootstrap samples (n = 200), p = 0.2174. (b) ROC curve for detection of Grade Group ⩾ 2. AUC 0.8445 for data set and 0.850 for bootstrap samples (n = 200), p = 0.1106.
AUC values were also compared between TRUS and transperineal prostate biopsy for both definitions, with no significant difference found. For any prostate cancer, AUC was 0.85 (95% CI = 0.82–0.89) and 0.85 (95% CI = 0.82–0.89) for TRUS and transperineal, respectively (p = 0.646). For Grade Group ⩾ 2, AUC was 0.84 (95% CI = 0.81–0.87) and 0.84 (95% CI = 0.80–0.87) for TRUS and transperineal, respectively (p = 0.733).
ROC curves were re-plotted with exclusion of each site for both definitions (Figure 2) and respective AUC values calculated, which are shown in Table 3. For prediction of any prostate cancer, no statistical difference was found between results (p = 0.1195). For Grade Group ⩾ 2, the chi-square p value was 0.0012. Further analysis was conducted between these ROC curves with the only significant comparison found after exclusion of Site 3 (AUC = 0.8213, 95% CI = 0.78–0.86, p = 0.012).
AUC values after exclusion of each site from the data set.
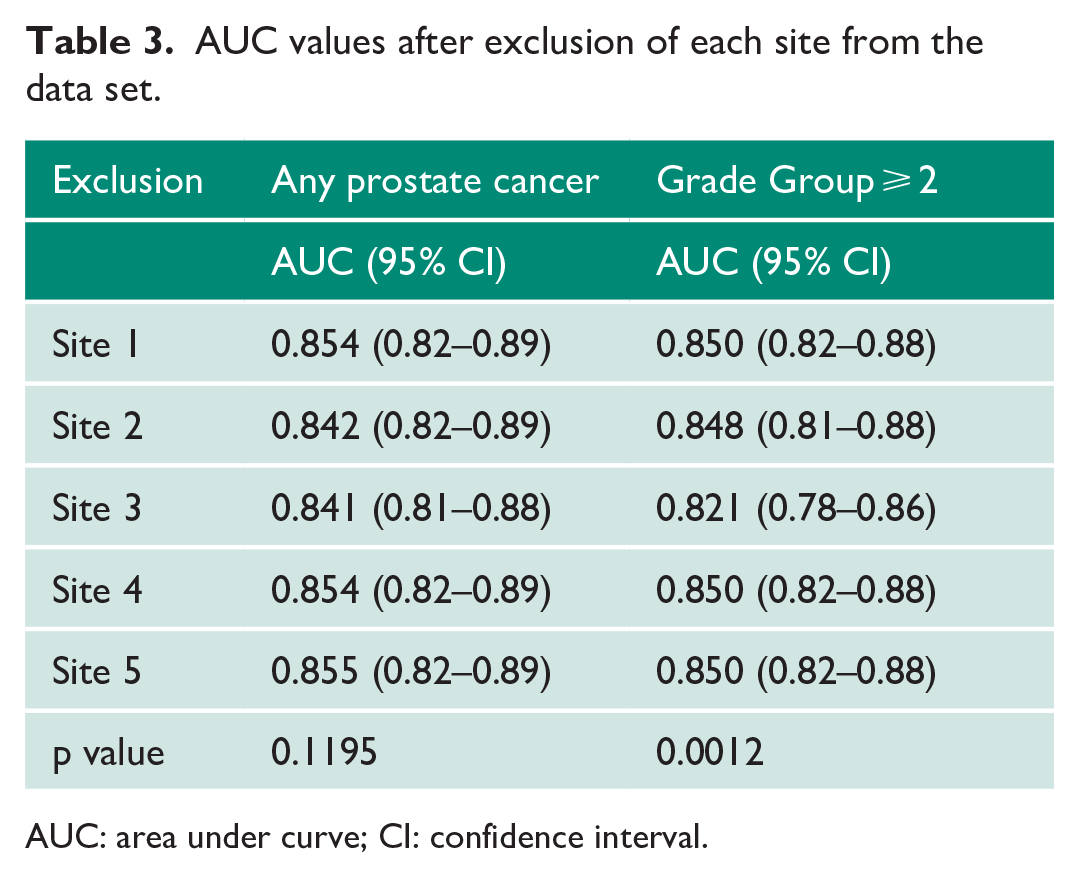
AUC: area under curve; CI: confidence interval.
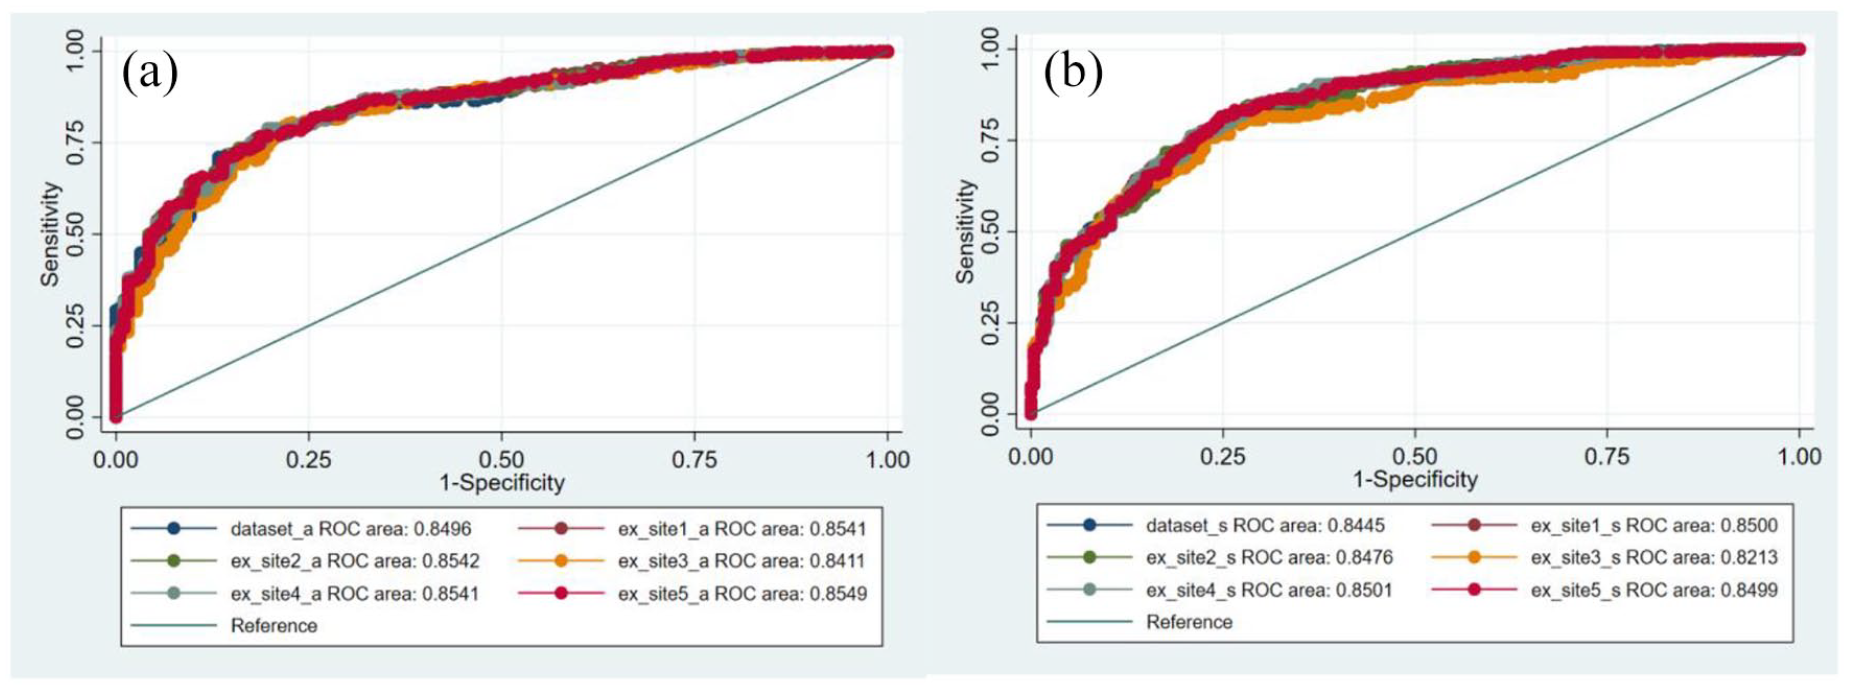
(a) ROC curves for detection of any prostate cancer with exclusion of each site. (b) ROC curves for detection of Grade Group ⩾ 2 with exclusion of each site.
The generated nomogram is shown in Figure 3. To use it, the individual variables are marked along the relevant scale and a vertical line is drawn to obtain a score. PSA density is divided into the four ranges as listed in Table 2. The total score is then used to show the probability of the chosen cancer outcome according to the patient’s results.
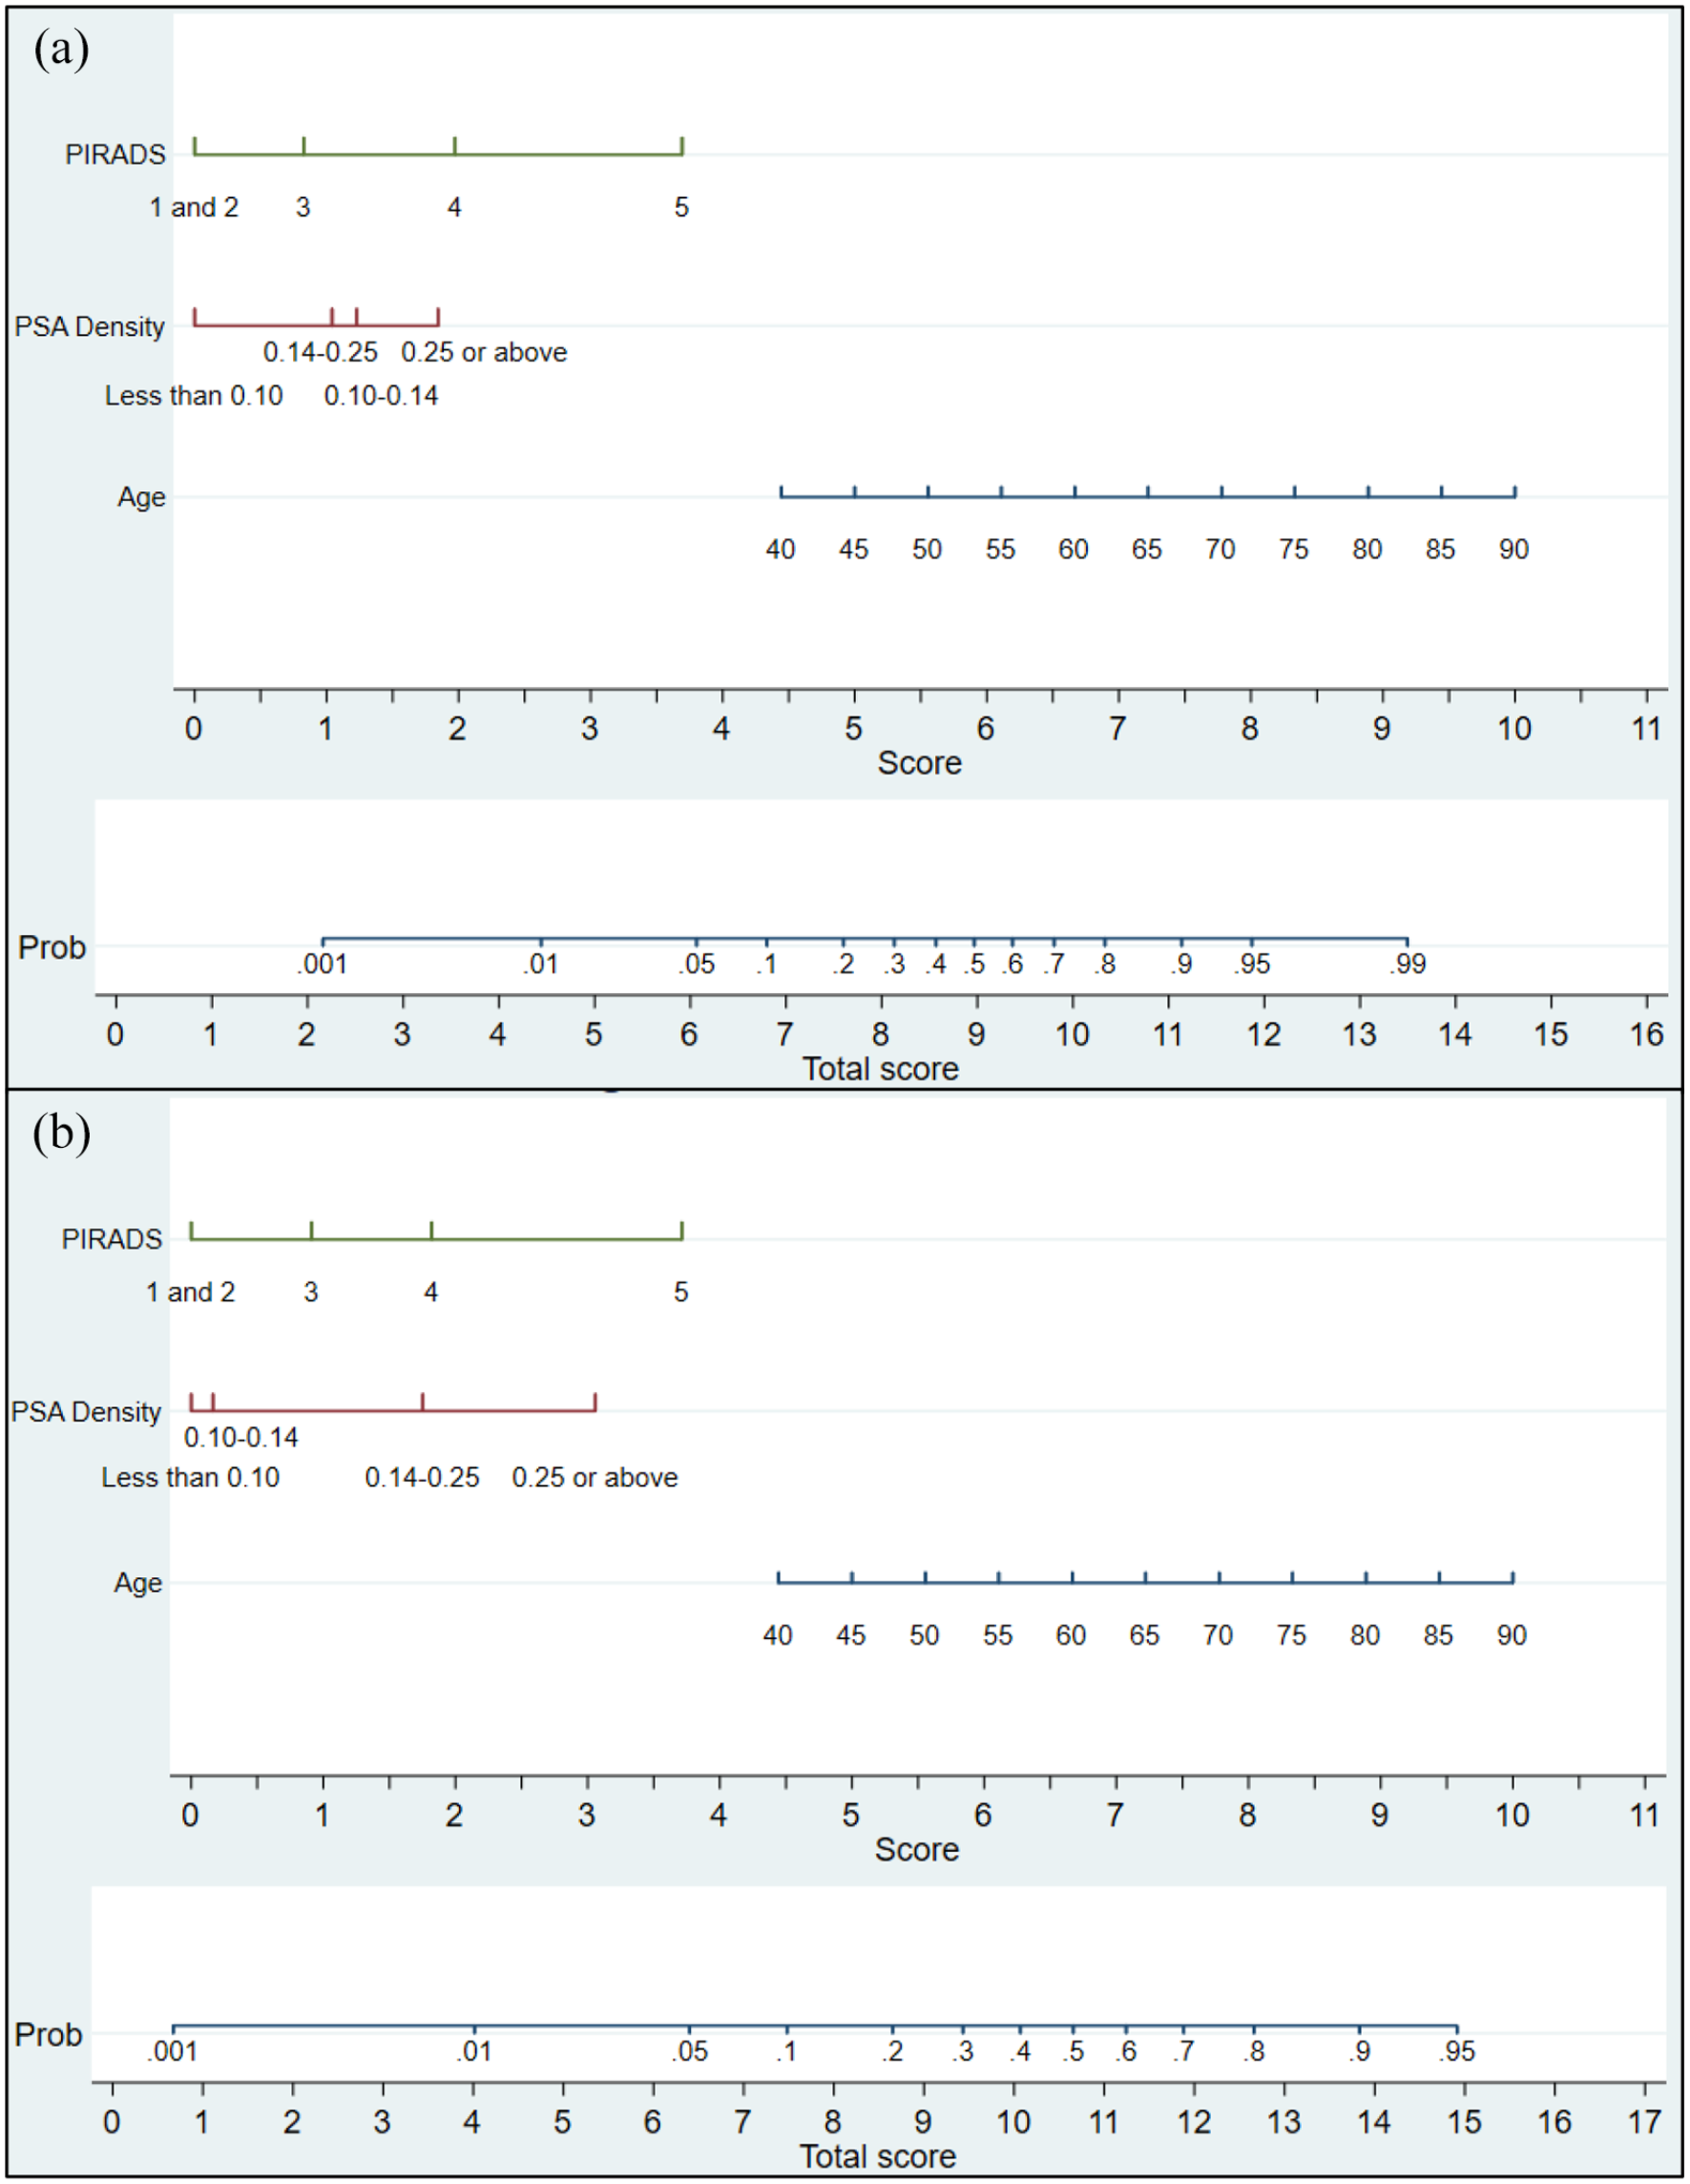
Nomograms for predicting the risk of prostate cancer on prostate biopsy (transrectal or transperineal): (a) detection of any prostate cancer and (b) detection of significant prostate cancer (ISUP Grade Group ⩾ 2).
Discussion
This externally validated, multi-centre, MRI-based nomogram demonstrates a high predictive accuracy for prostate biopsy outcomes. The key findings were AUC values of 0.85 (95% CI = 0.82–0.88) and 0.84 (95% CI = 0.81–0.88) for detection of any prostate cancer and Grade Group ⩾ 2, respectively. Clinical variables used are patient age, PSA density, and mpMRI PIRADSv2 score. The nomogram can be used in the decision-making progress prior to biopsy in order to counsel a man’s risk of prostate cancer diagnosis, either significant or non-significant. For example, a 55-year-old man who presents with a PSA of 6.5 ng/mL and has a 40cc gland with a PIRADS 4 lesion could be counselled a 33% risk of significant cancer and likely opt for biopsy. However, the same man with an mpMRI showing a 60cc gland scored as PIRADS 2 can be informed of a less than 5% risk of significant cancer on biopsy and may instead opt for surveillance.
For the detection of Grade Group ⩾ 2, the AUC for phi was 0.82 in the PRIM study. While comparable, this study demonstrates little added benefit of the phi biomarker if mpMRI and PSA density are available. 8 The AUCs for PSA and PSA density alone were 0.7 and 0.79, respectively, illustrating the advantage of combining MRI into the model.
Decision of whether to perform prostate biopsy is risk-based in clinical practice, either by clinical judgement or the use of risk calculators. The latter of these can be used to easily convey the risk to the patient in order to help guide their decision-making process, although how useful patients find this in practice is an area still to be explored. Avoidance of biopsy is often attractive to both patient and clinician due to its associated morbidity as well as detection of indolent disease. Nomograms therefore can provide an appealing option to facilitate this within the diagnostic pathway. 6
The use of varying clinical, biochemical, and radiological factors in risk calculators has been deployed. The mpMRI has been one of the more recent advances in technology, showing high sensitivity and negative predictive values.1,9,10 Its incorporation into nomograms has been shown to increase accuracy, with numerous risk calculators published, although few of these have been externally validated.
One of the largest data sets comes from the SWOP Prostate Cancer Research Foundation risk calculator, which is available online (www.prostatecancer-riskcalculator.com). This is based on the Rotterdam arm of the European Randomized Study of Screening for Prostate Cancer (ERSPC) and has advantages of external validation in other European countries (albeit excluding the United Kingdom) as well as Canada and Korea with AUC values ranging from 0.71 to 0.80.11–14 Its latest iteration by Alberts et al. also incorporates mpMRI PIRADS version 1 (PIRADSv1) scores for men being investigated for suspicion of prostate cancer. They used a multi-centre development cohort of 961 men from four centres based in the Netherlands and a single institute in Germany. 15 Parameters used were PSA, digital rectal examination (DRE) findings, prior negative biopsy, TRUS prostate volume, and PIRADSv1 score. For the biopsy naïve cohort, the MRI-based model had a significantly improved AUC of 0.84 compared to the baseline value of 0.76. However, this nomogram only applies to TRUS biopsy and has yet to be externally validated, with neither the baseline model nor MRI-based version being applied to a UK population. In addition, the calculator has been calibrated with an mpMRI-positive predictive value of 20% for detecting Grade Group ⩾ 2, which is notably lower in comparison with other studies.1,9,10,16
Alongside this, in the United States, Mehralivand et al. developed an MRI-based risk calculator for predicting MRI-TRUS fusion biopsy outcome based on age, African American ethnicity, prior negative biopsy, abnormal DRE, PSA, and PIRADSv2 score. 17 This was derived from one development cohort of 400 men in a single institution and further external validation using a cohort of 251 men from two independent centres. Reported AUC value was high at 0.84 for both the development and validation cohorts, although it remains to be seen how well this performs in a UK setting and whether all of these parameters are significant predictors outside the tested populations. In addition, the use of image fusion technology may limit its current applicability in the United Kingdom as this technique is yet to be widely utilised.
The major strength of the presented study is that the data utilised are ‘real-life’ and at the same time collected in a robust prospective manner within a multi-centre trial. The real-life nature makes the data applicable to any unit that incorporates mpMRI into its prostate cancer diagnostic pathway. These aspects are becoming more available and the results further justify the use of mpMRI prior to biopsy.
As demonstrated in our previous work and in the literature, age, PIRADS score ⩾ 4, and high PSA density were all found to be significant predictors of biopsy outcome.7,11,12,14,18 For Grade Group ⩾ 2, PSA density and PIRADS score reached statistical significance at values ⩾0.14 ng/mL2 and ⩾4, respectively.
In order to assess how the different centres responded to the nomogram, additional analysis was conducted to calculate AUC values after exclusion of each site. This determined the only statistical difference was after exclusion of site 3 (AUC = 0.8213, 95% CI = 0.78–0.86, p = 0.012) for detecting significant cancer. However, given the 95% CIs all overlap, it was felt that the nomogram was still of high clinical value to all centres and could be extrapolated for use elsewhere. The impact of this outlier also was very low with the nomogram continuing to perform well with an AUC of more than 82% when this centre was excluded.
We recognise that there are limitations with this study. Biopsy protocols were dictated locally and therefore consisted of both transrectal and transperineal approaches. However, no difference in the nomogram performance was found between biopsy modality and reassuringly cancer detection rates were similar across all sites (Supplementary Table 1), which may be due to the use of targeted biopsies in addition to systematic approaches. In the pre-MRI era, systematic transperineal biopsies were shown to have high detection rates as well as lower complication rates, such as urosepsis, compared to transrectal approach. 5 However, TRUS is still widely in use and therefore its inclusion within this analysis allows our risk calculators to be used across the UK population regardless of biopsy technique, but with emphasis on targeting MRI lesions, either by cognitive or fusion methods.
We were unable to provide a prediction for saved unnecessary biopsies since patients entered into the trial were selected on the basis of those undergoing biopsy, that is, patients deemed low risk after MRI who chose not to have a biopsy were not included.
The use of DCE has been disputed and our previous nomogram used bi-parametric MRI due to its shorter acquisition time. 7 However, with the latest PIRADS version 2.1, DCE is utilised to evaluate equivocal peripheral zone lesions, with upgrading to PIRADS score 4 if DCE is deemed positive. 19 Therefore, this work validates our existing nomogram using external multi-centre data as well as updates and confirms its validity for mpMRI. Furthermore, DCE is more widely available now than previously.
In addition, in our previous nomogram, a mixed biopsy status cohort was used. History of prior negative biopsy was found to be a significant predictor and therefore included in that calculator. This current data set consists of biopsy naïve men only and thus this factor was not included. However, these calculators still provide an extremely useful aid in the decision-making process for the initial investigations of suspected prostate cancer. While there may be concern of missing significant disease, as long as men who choose not to undergo biopsy are kept under PSA surveillance, risk calculators can still play a powerful role in the diagnostic pathway.
Conclusion
In conclusion, we present an externally validated multi-centre nomogram for predicting prostate biopsy outcome in biopsy naïve men. Our findings demonstrate a high accuracy using age, PSA density, and mpMRI PIRADSv2 score as prognostic variables. This work supports the use of these risk calculators in the decision-making process of whether or not to perform prostate biopsy and can be used for both TRUS and transperineal approaches.
Supplemental Material
sj-docx-1-uro-10.1177_20514158211065949 – Supplemental material for MRI-based nomogram for the prediction of prostate cancer diagnosis: A multi-centre validated patient–physician decision tool
Supplemental material, sj-docx-1-uro-10.1177_20514158211065949 for MRI-based nomogram for the prediction of prostate cancer diagnosis: A multi-centre validated patient–physician decision tool by Edwin M Chau, Beth Russell, Aida Santaolalla, Mieke Van Hemelrijck, Stuart McCracken, Toby Page, Sidath H Liyanage, Jonathan Aning, Vincent J Gnanapragasam and Peter Acher in Journal of Clinical Urology
Footnotes
Acknowledgements
All authors confirm that they have no acknowledgements to declare.
Conflicting interests
The author(s) declared no potential conflicts of interest with respect to the research, authorship, and/or publication of this article.
Funding
The author(s) received no financial support for the research, authorship, and/or publication of this article.
Ethical approval
Ethical approval for analysis of the data set was not required. Acquisition of the data was conducted under ethics (REC 03/018) and published elsewhere (‘Phi to refine MRI (PRIM) study’).
Informed consent
Written informed consent was obtained from patients for participation in the ‘Phi to refine MRI (PRIM) study’. Additional consent was not required for further retrospective analysis of the data.
Guarantor
E.M.C. is the guarantor for this article.
Contributorship
All authors have made significant contribution.
Supplemental material
Supplemental material for this article is available online.
References
Supplementary Material
Please find the following supplemental material available below.
For Open Access articles published under a Creative Commons License, all supplemental material carries the same license as the article it is associated with.
For non-Open Access articles published, all supplemental material carries a non-exclusive license, and permission requests for re-use of supplemental material or any part of supplemental material shall be sent directly to the copyright owner as specified in the copyright notice associated with the article.