
Abstract
Background
Increasing efforts are being put into new treatment options for coeliac disease (CeD), a chronic disorder of the small intestine induced by gluten. Interleukin-2 (IL-2) and gluten-specific CD4 + T cells increase in the blood after four hours and six days, respectively, following a gluten challenge in CeD patients. These responses are unique to CeD and are not seen in controls. We aimed to evaluate different markers reflecting a recall response to gluten exposure that may be used to monitor therapy.
Methods
CeD patients on a gluten-free diet underwent a one- (n = 6) or three-day (n = 7) oral gluten challenges. We collected blood samples at several time points between baseline and day 8, and monitored gluten-specific CD4 + T cells for their frequency and CD38 expression using HLA-DQ:gluten tetramers. We assessed the IL-2 concentration in plasma four hours after the first gluten intake.
Results
The frequency of gut-homing, tetramer-binding, CD4 + effector memory T (tetramer + β7 + TEM) cells and the IL-2 concentration measured shortly after the first dose of gluten increased significantly after the one- and three-day gluten challenges, but large interindividual differences were exhibited. The frequency of tetramer + β7 + TEM plateaued between days 6 and 8 and was lower after the one-day challenge. We observed a consistent increase in CD38 expression on tetramer + β7 + TEM cells and did not find a significant difference between the one- and three-day challenges.
Conclusions
The optimal time points for monitoring therapy response in CeD after a three-day oral gluten challenge is four hours for plasma IL-2 or six to eight days for the frequency of tetramer + β7 + TEM cells, but both these parameters involved large interindividual differences. In contrast, CD38 expression on tetramer + β7 + TEM cells increased uniformly and irrespectively of the length of gluten challenge, suggesting that this parameter is more suited for monitoring drug efficacy in clinical trials for CeD.
Introduction
Coeliac disease (CeD) is a human leucocyte antigen (HLA)-associated autoimmune enteropathy driven by an immune response upon consumption of foodstuff containing gluten proteins from wheat, rye or barley. 1 Gluten-specific CD4 + T cells preferentially recognise deamidated gluten epitopes that are selectively presented by the disease-associated HLA-DQ2 (DQ2.5/DQ2.2) or HLA-DQ8 molecules. Gluten-specific CD4 + T cells orchestrate immune responses that lead to the formation of small intestinal lesions, to the production of antibodies to transglutaminase 2 (TG2) and anti-deamidated gluten peptides (DGP) as well as to expansion of gluten-specific CD4 + T-cell clones.2,3 A growing interest in the development of new therapies for CeD has created a need for robust surrogate markers to assess biological effect of treatment in addition to the mandatory monitoring of patient-reported outcomes.4–6 Many of those surrogate markers constitute a challenge, as their values display large interindividual variation, thus necessitating large sample sizes of study groups to assess treatment efficacy.7–10 Surrogate markers that reflect activation of gluten-specific CD4 + T cells would have particular promise, given the central role of these cells in the disease pathogenesis. 11 Gluten-specific CD4 + T cells can be detected in an interferon-γ secretion assay (ELISPOT) and by flow cytometry in the blood of treated CeD patients on day 6 after the onset of a three-day gluten challenge using HLA-DQ:gluten tetramers.10,12,13 These responses are exclusively seen in CeD patients.8,13,14 Some results from kinetic analysis of interferon γ-secreting T cells using ELISPOT 10 and sequential measurements of HLA-DQ:gluten tetramer-positive T cells 15 have been reported. However, day-by-day kinetic analysis of HLA-DQ:gluten tetramer-positive T cells in blood after gluten challenge has not been performed. Since gluten-specific T cells may be used for diagnostic and therapeutic purposes,7,8,16 a more detailed understanding of their kinetics and cell biology is needed.
T cells expressing high levels of CD38 have been shown to exhibit an improved potential to produce the cytokines interleukin-2 (IL-2) and interferon-γ, despite a reduced proliferative capacity. 17 CD38 is a multifunctional enzyme playing a role in cellular and tissue nicotinamide adenine dinucleotide homeostasis and in the generation of second messengers involved in intracellular calcium signalling. 18 In T cells, CD38 ligation leads to cellular signalling that involves pathways also downstream of TCR-CD3 ligation,19,20 thus suggesting a role of CD38 during antigen-induced activation of T cells. 21 Du Pré et al. were the first to describe CD38 + gluten-specific T cells in blood from CeD patients. 22 Subsequently, CD38 has been identified as a consistent marker on activated gut-homing gluten-specific T cells in CeD, which could have diagnostic relevance.7,8
Recent studies provide insights on fast-rising cytokine levels within few hours after a gluten challenge in treated CeD patients.8,9 Here, IL-2 in particular stands out as the cytokine with the most robust increase. 9 IL-2 is to a large extent produced by T cells themselves, but also natural killer (NK) cells, NK T cells, dendritic cells and mast cells. It acts in an auto- and paracrine manner and exerts crucial functions during immune homeostasis. 23
In this study, we assessed the potential of IL-2 and CD38 as surrogate markers for gluten re-exposure compared to the increase of gluten-specific T cells in the blood in response to an antigen challenge. In addition, we examined the kinetics of gluten-specific CD4 + T-cell frequency after a gluten challenge over three days in a detailed manner and assessed patient-reported outcome measures (PROM).
Methods
Patient recruitment and inclusion
Participants were recruited by direct invitation and announcements on hospital employee websites, a public health website, the K.G. Jebsen Coeliac Disease Research Centre website and social media.
Inclusion and exclusion criteria.
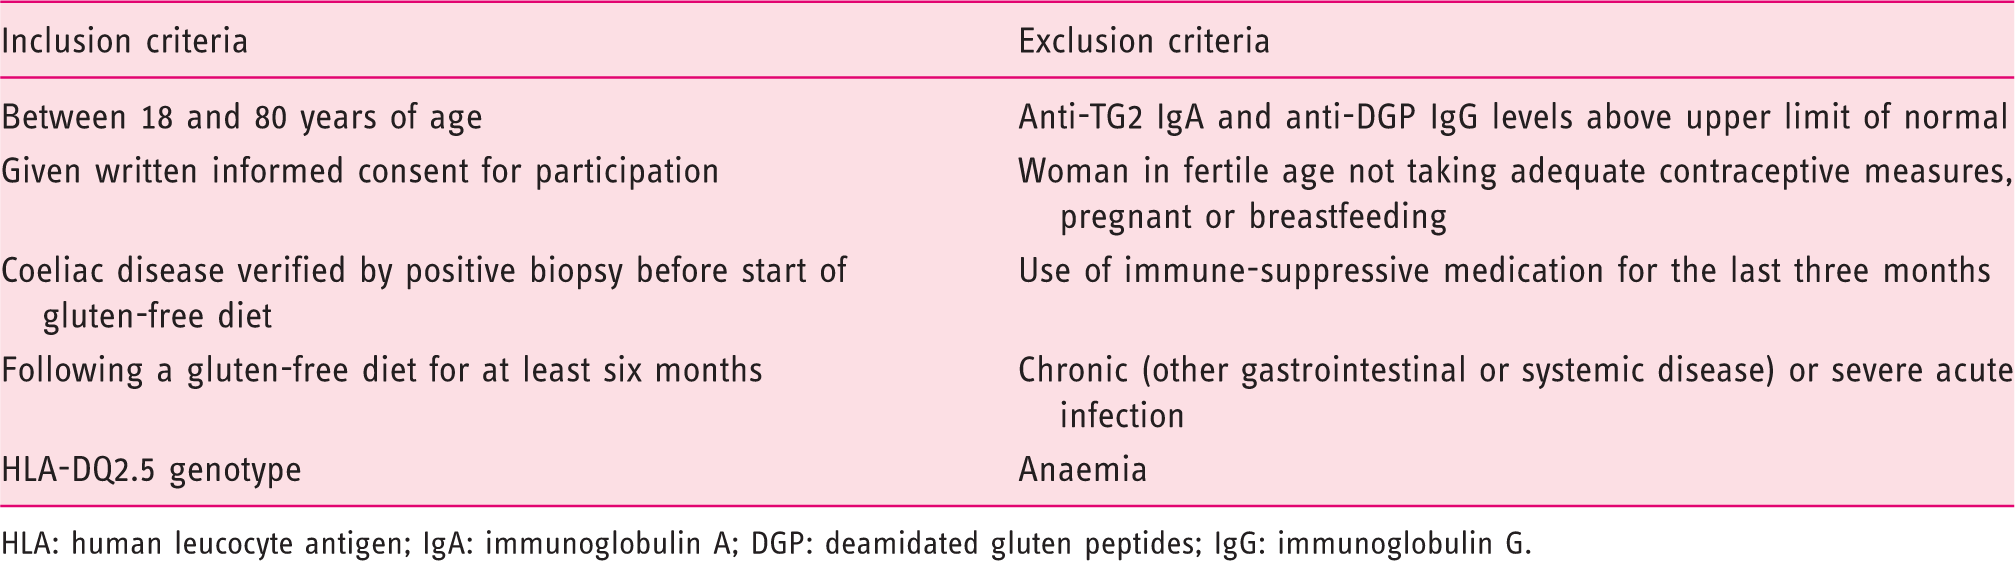
HLA: human leucocyte antigen; IgA: immunoglobulin A; DGP: deamidated gluten peptides; IgG: immunoglobulin G.
Sixteen subjects were invited to participate in either a one-day gluten challenge study or a three-day gluten challenge study protocol. One patient in the three-day challenge group dropped out after the first day of challenge. Due to technical issues, samples from one patient in the one-day challenge group could not be analysed. Samples from the three-day challenge had to be analysed several times by flow cytometry, which resulted in a lack of one sample at baseline and one on day 7. Together, 13 (12 female) patients were included in the analysis (Supplemental Figure S1).
Gluten challenge protocol
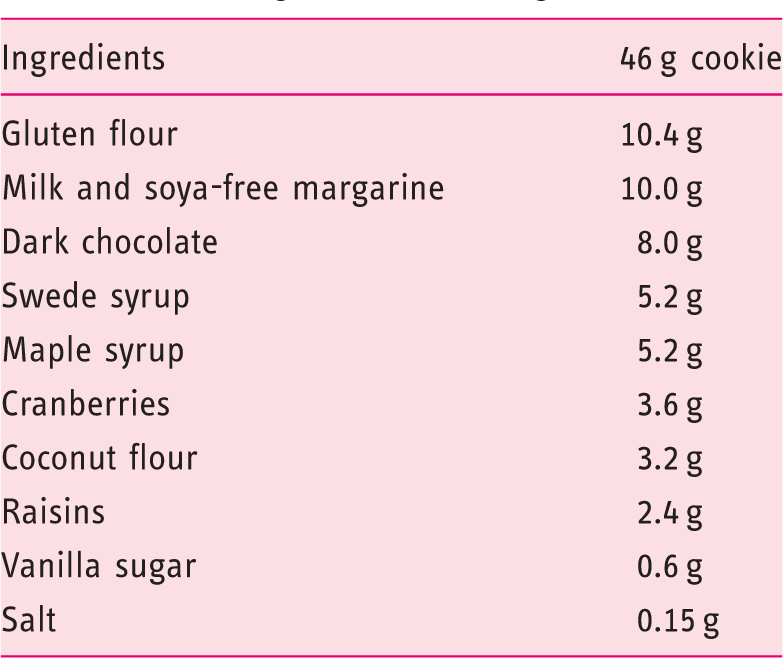
All participants ingested one 46 g cookie daily for either one or three days and gave a baseline blood sample. Individuals participating in the three-day challenge protocol gave additional blood samples on day 1 (four hours after challenge) and on days 4–8. Individuals participating in the one-day challenge protocol gave additional samples on day 1 (four hours after challenge) and on day 6 (Supplemental Figure S2).
List of ingredients in a 46 g cookie.
Characteristics of included participants.
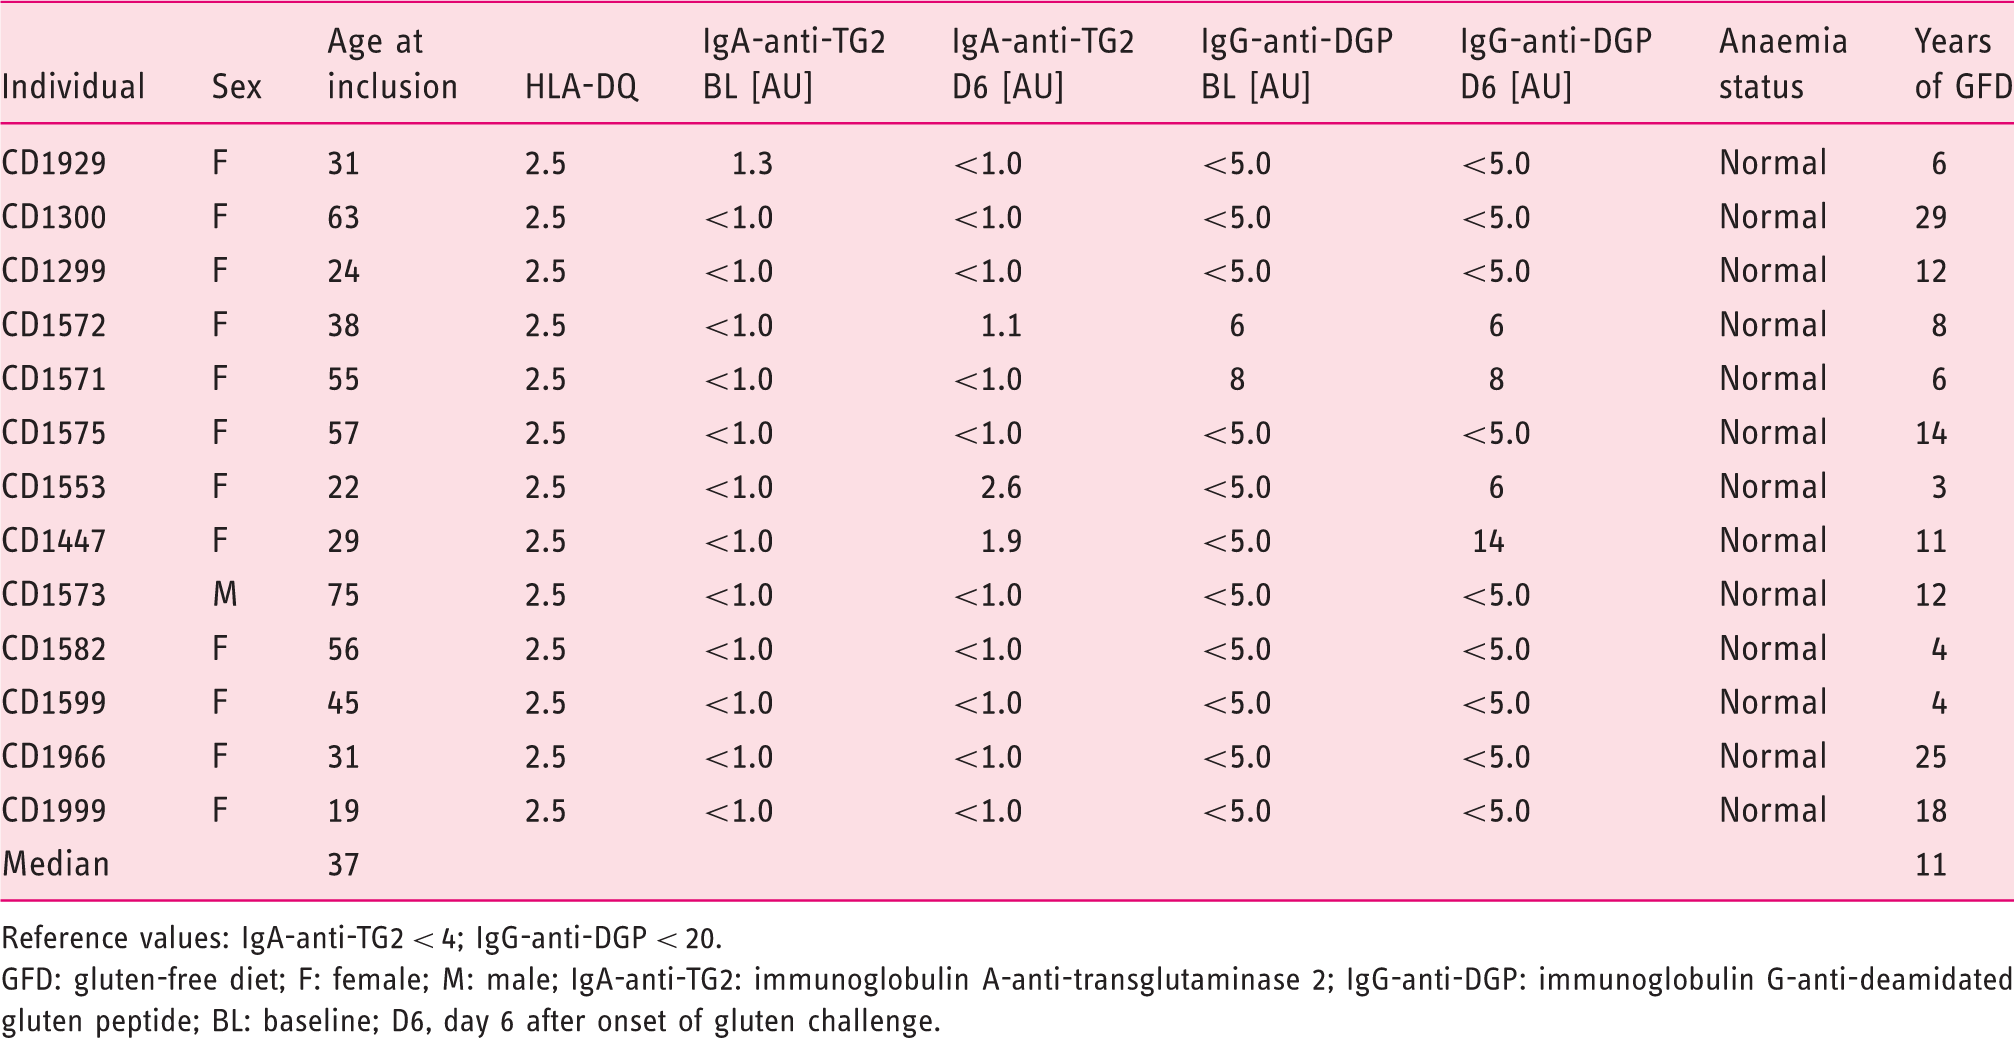
Reference values: IgA-anti-TG2 < 4; IgG-anti-DGP < 20.
GFD: gluten-free diet; F: female; M: male; IgA-anti-TG2: immunoglobulin A-anti-transglutaminase 2; IgG-anti-DGP: immunoglobulin G-anti-deamidated gluten peptide; BL: baseline; D6, day 6 after onset of gluten challenge.
PROM
Symptoms were scored using a visual analogue scale (VAS; Supplemental Figure S3) for gastrointestinal symptoms over a period of two to three days before gluten challenge until the day before the last blood sample. Scores were obtained for pain, bloating, flatulence, nausea, stool consistency and overall symptoms. In addition, the Gastrointestinal Symptom Rating Scale modified for patients with irritable bowel syndrome (GSRS-IBS) 25 was measured before gluten challenge, on day 3 and at the time point of the last blood sample drawing (day 6 or day 8).
Antibody tests, HLA typing and cytokine analysis
Measurements of IgA-anti-TG2 (normal < 4 IU/mL; QUANTA Lite R h-tTG IgA ELISA) and IgG-anti-DGP IgG (normal < 20 IU/mL; QUANTA Lite Gliadin IgG II; both INOVA Diagnostics, San Diego, CA) were performed in serum at baseline and on day 6 after the start of challenge (Supplemental Table S1). All included participants were typed for HLA-DQA1 and HLA-DQB1 alleles (full genomic HLA typing, LABType SSO; ONE LAMBDA, Los Angeles, CA).
Plasma samples for cytokine measurements (n = 13) were collected at baseline and four hours after the onset of challenge (day 1). Samples were kept frozen at −80℃ and were later analysed in duplicate with a V-PLEX assay for IL-2 at a 1:1 dilution according to the manufacturer's instructions on a MSD QuickPlex SQ 120 (Meso Scale Diagnostics, Rockville, MD). The values presented are the means of the duplicates.
Peripheral blood mononuclear cell isolation, tetramer staining and surface marker staining
Immediately after drawing between 40 mL (days 1–8) and 100 mL of blood at baseline, peripheral blood mononuclear cells (PBMC) were isolated from cell preparation tubes (BD Vacutainer® CPT™ Mononuclear Cell Preparation Tubes; BD Biosciences, San Jose, CA). PBMC collected for the three-day challenge protocol were frozen and kept in a liquid-nitrogen tank until cell staining and analysis. PBMC collected for the one-day challenge protocol were processed immediately. Samples were incubated with an equal mixture of HLA-DQ2.5:gluten tetramers, 26 representing the epitopes DQ2.5-glia-α1a, DQ2.5-glia-α2, DQ2.5-glia-ω1, DQ2.5-glia-ω2 and DQ2.5-hor3 (10 µg/mL of each tetramer). HLA-DQ:gluten tetramer-binding cells underwent manual (for frozen samples) or automated (for fresh samples) bead enrichment, as described previously,7,27 and were stained with the following antibody mixture: CD38-FITC, CD45RA-PE-Cy7 and LIFE/DEAD® Fixable Dead Cell Violet Stain (eBioscience, Thermo Fisher Scientific, Waltham, MA); CD4-APC-H7, CD62L-PerCP/Cy5.5, Integrin β7-APC, CD11c-Pacific Blue (PB; BD Biosciences), CD14-PB, CD19-PB, CD56-PB and CD3-Brilliant Violet 605 (BioLegend, San Diego, CA); or CD3-Superbright 605 (eBioscience, Thermo Fisher Scientific). CD4 + T cells were analysed by flow cytometry for CD3 + CD4 + CD11c–CD14–CD19–CD56–CD45RA–CD62L–integrin β7 + HLA-DQ:gluten tetramer + (tetramer + β7 + TEM) cells. Flow cytometry was performed using either BD LSRFortessa™ or BD FACSAria™ IIu (BD Biosciences). The gating strategy is shown in Supplementary Figure S4. The number of tetramer + β7 + TEM was normalised to 106 CD4 + cells estimated from a pre-enriched sample.
Data analysis
Flow cytometry data were analysed with FlowJo v10.5 (FlowJo, LLC, Ashland, OR). GraphPad Prism v8 (GraphPad Software, San Diego, CA) was used assess significant differences and correlations. The Wilcoxon signed-rank test was used to compare groups. The significance level was set at p < 0.05 and was adjusted for multiple testing where applicable. Missing values were excluded list-wise.
Results
Patient characteristics
All included participants (n = 13) were HLA-DQ2.5-positive and seronegative (IgA-anti-TG2 and IgG-anti-DGP) at inclusion. None of them showed parameters of blood indicating anaemia or other relevant diseases. Participants had been on a gluten-free diet for a median of 11 years (range 3–29 years). The median age of the patients was 37 years (range 19–75 years) at inclusion (Table 3).
PROM
After ingesting gluten-containing cookies, the participants reported their gastrointestinal symptoms daily in a symptom diary in the form of a VAS. For the three-day challenge, the median VAS score peaked on days 1–2 or days 6–7 (pain: 22/100 mm on day 1; nausea: 4/100 mm on day 1; satisfaction with defecation: 18/100 mm on day 2; bloating: 16/100 mm on day 6; flatulence: 24/100 mm on day 7). The highest total symptom score was reported on day 2 (20/100 mm; Supplemental Figure S5(a)). The median GSRS-IBS score increased to a maximum of 30/91 points on day 3 and remained stable until day 8. Pain increased marginally from 5 to 6 points (minimum 2 points) and bloating from 6 to 9 points (minimum 4 points). Diarrhoea peaked on day 3 (10 points; minimum 4 points) and constipation increased from a minimum of 2 to 3 points until day 8, while satiety remained at a minimum score of 2 points (Supplemental Figure S5(b)).
For the one-day gluten challenge, symptoms occurred almost exclusively on the day of challenge (pain: 16/100 mm; bloating: 3/100 mm; nausea: 48/100 mm). Flatulence symptoms decreased over time (16/100 mm at baseline), while satisfaction with defecation increased (17/100 mm at baseline). The score for total complaints peaked on day 1 (27/100 mm; Supplemental Figure S5(c)). The median GSRS score increased slightly to a maximum score of 28/91 points on day 3. Pain, constipation (both 5 points) and diarrhoea (8 points) peaked on day 3. Bloating decreased from 9 to 6 points, while satiety remained unchanged at 3 points (Supplemental Figure S5(d)). An overview over all individual symptoms is given in Supplemental Table S1.
T-cell kinetics in response to gluten challenge
Analysis of sequential blood samples after the three-day gluten challenge revealed an increased number of tetramer + β7 + TEM cells from day 5 to day 8, with a plateau forming in most individuals, while the total number of CD4 + T cells was steady over the course of the experiment (Supplemental Figure S6). The median tetramer + β7 + TEM cell number increased from 7 at baseline to 71 tetramer + β7 + TEM cells/million CD4 + T cells on day 8. We found a significant increase in cell numbers between days 4 and 7 (5 vs. 65 tetramer + β7 + TEM cells/million CD4 + T cells; p < 0.05) and observed large interindividual differences in cell numbers (Figure 1(a)). For subjects undergoing a one-day challenge, tetramer + β7 + TEM cells from all participants increased to a lower extent compared to subjects receiving a three-day challenge (a median of 3–19 tetramer + β7 + TEM cells/106 CD4 + T cells from baseline to day 6; p < 0.05; Figure 1(b)).
T-cell kinetics and interleukin-2 (IL-2) concentration in plasma. (a) Tetramer+β7 + TEM/106 CD4 + T-cell numbers over time plateauing between days 6 and 8 and (b) tetramer+β7 + TEM/106 CD4 + T-cell numbers at baseline and on day 6 after the one-day gluten challenge. (c) IL-2 concentration in plasma before and four hours after the first gluten exposure. Horizontal lines represent median values. (d) No significant correlation of tetramer+β7 + TEM cells on day 8 with IL-2 concentration four hours after the first gluten exposure. Horizontal lines represent median values. Coloured symbols represent individuals in the three-day challenge group. Circles represent individuals in the one-day challenge group.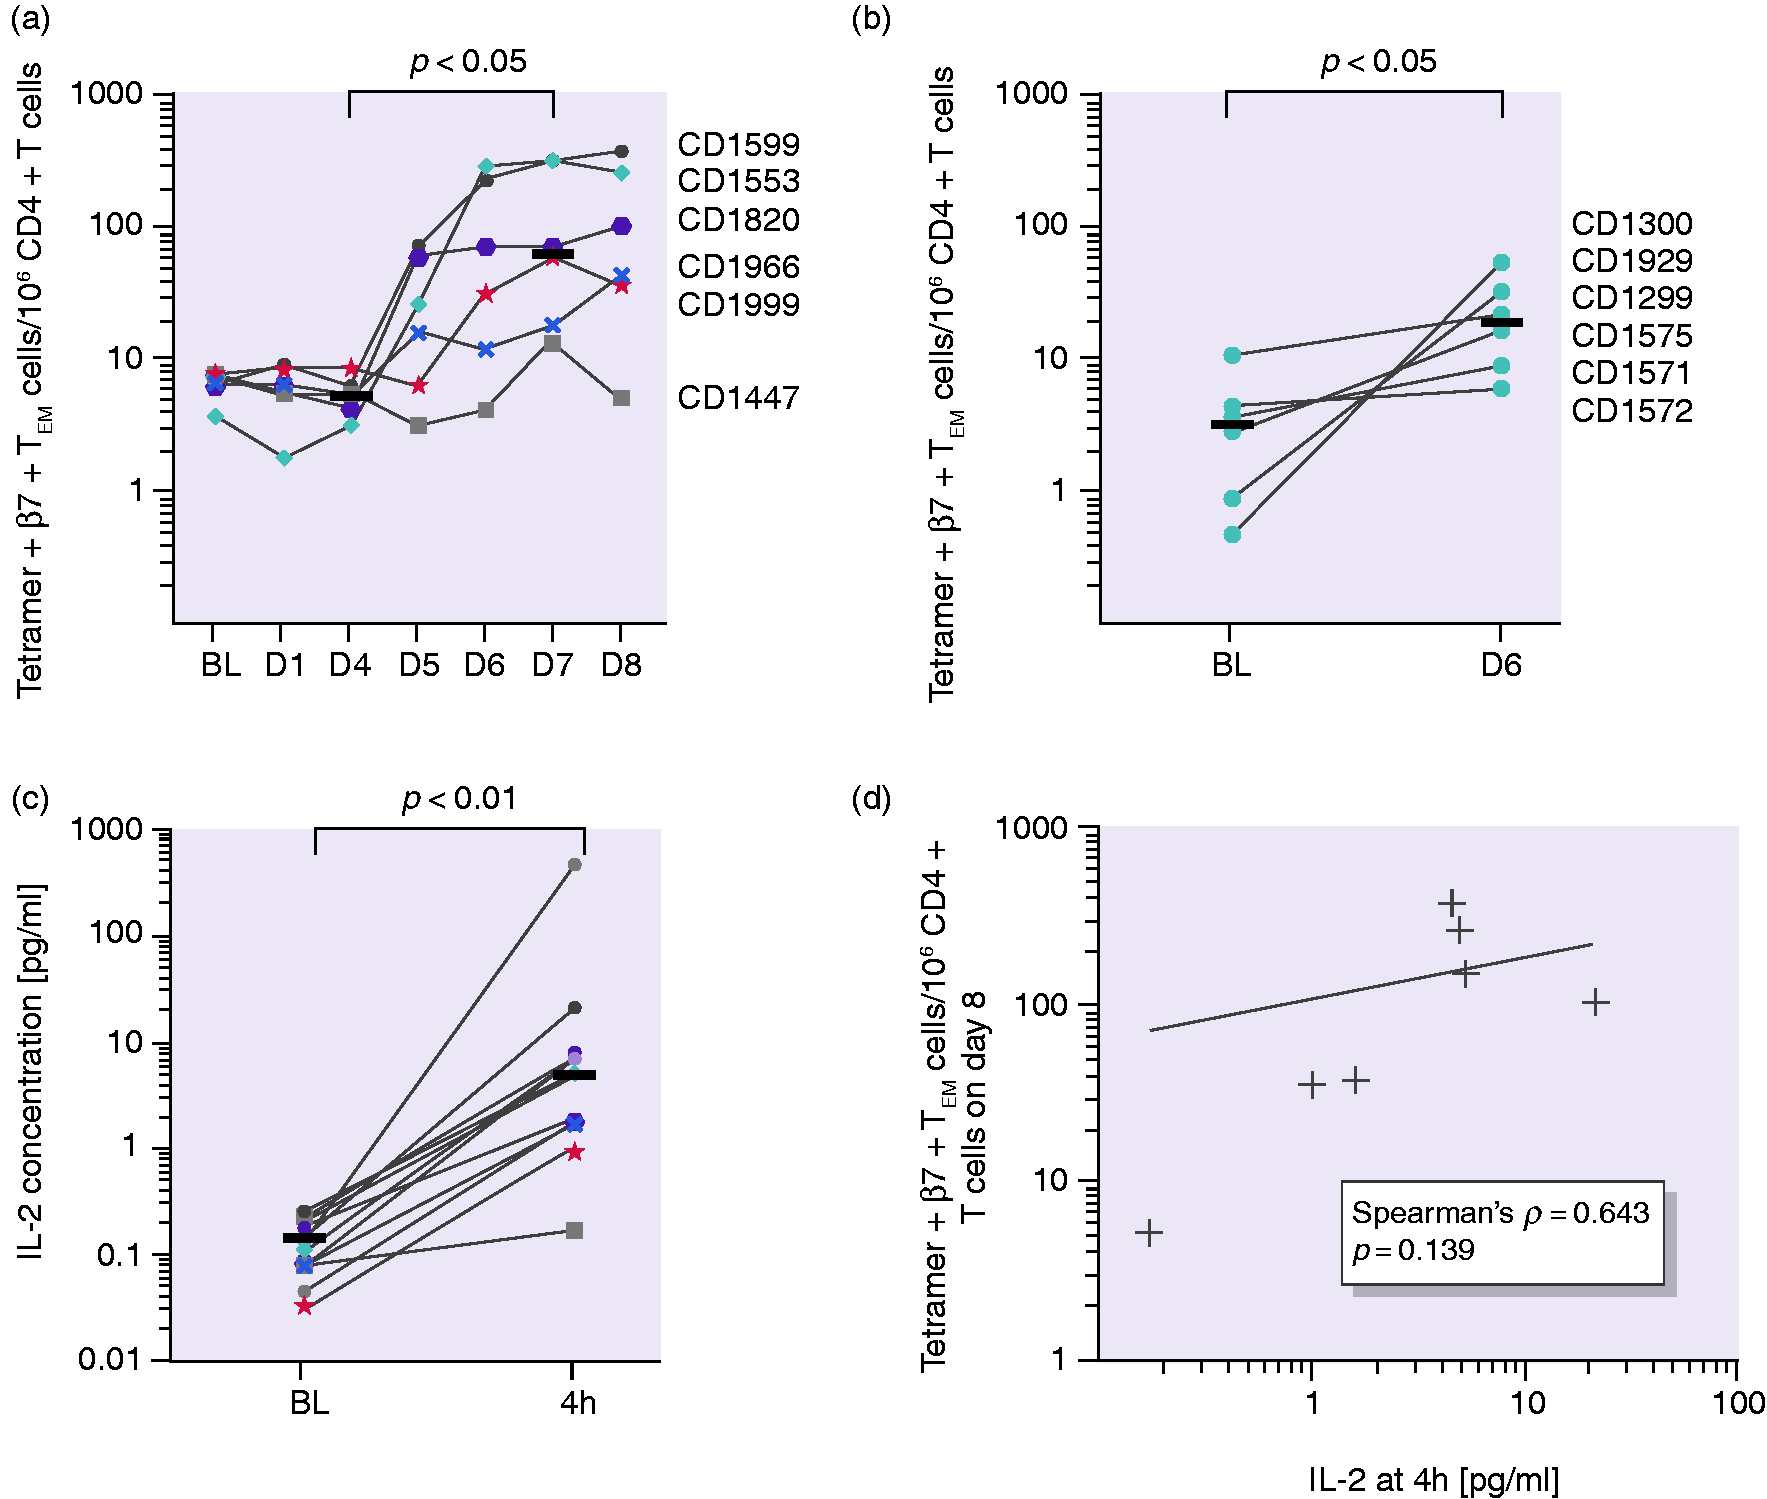
IL-2 concentration in plasma
We aimed to test if early immune cell activation reflected by IL-2 release serves as a more uniform marker than the tetramer + β7 + TEM cell numbers. After four hours, the IL-2 concentration in plasma increased in all participants in response to a single dose of gluten (p < 0.001; Figure 1(c)). However, we observed a large interindividual variation, ranging from a 2- to more than a 150-fold increase in IL-2 concentrations in plasma. We did not find a significant correlation of the IL-2 concentration at four hours after the first gluten exposure with tetramer + β7 + TEM cell numbers (shown for day 8; Figure 1(d)) but with total symptoms (VAS) on day 1 (p < 0.05). Further, the correlation between IL-2 fold change and baseline numbers of tetramer + β7 + TEM cells was not significant.
CD38 expression in response to gluten challenge
The activation status of tetramer + β7 + TEM cells was assessed by the percentage of cell surface expression of CD38 on tetramer + β7 + TEM cells. In contrast to the large interindividual variation of both tetramer + cell numbers and the IL-2 response after gluten challenge, CD38 expression increased after the three-day challenge in a consistent manner from a median of 2.0% at baseline to a maximum of 93.6% on day 6, with continuous elevation until day 8 (p < 0.05, baseline vs. days 6–8; Figure 2(a)). Even the individual with the weakest tetramer + β7 + TEM cell response (CD1447) revealed a clear increase in CD38 expression. For the one-day challenge, a median of 83.0% of the tetramer + β7 + TEM cells expressed CD38 + compared to 6.5% at baseline (p < 0.05; Figure 2(b)). There was no significant difference in the percentage of CD38 + cells after the one-day challenge compared to the three-day challenge.
CD38 expression on tetramer+β7 + TEM in response to gluten challenge. Percentage CD38 + of all tetramer+β7 + TEM after (a) the three-day challenge and (b) the one-day challenge. Horizontal lines represent median values.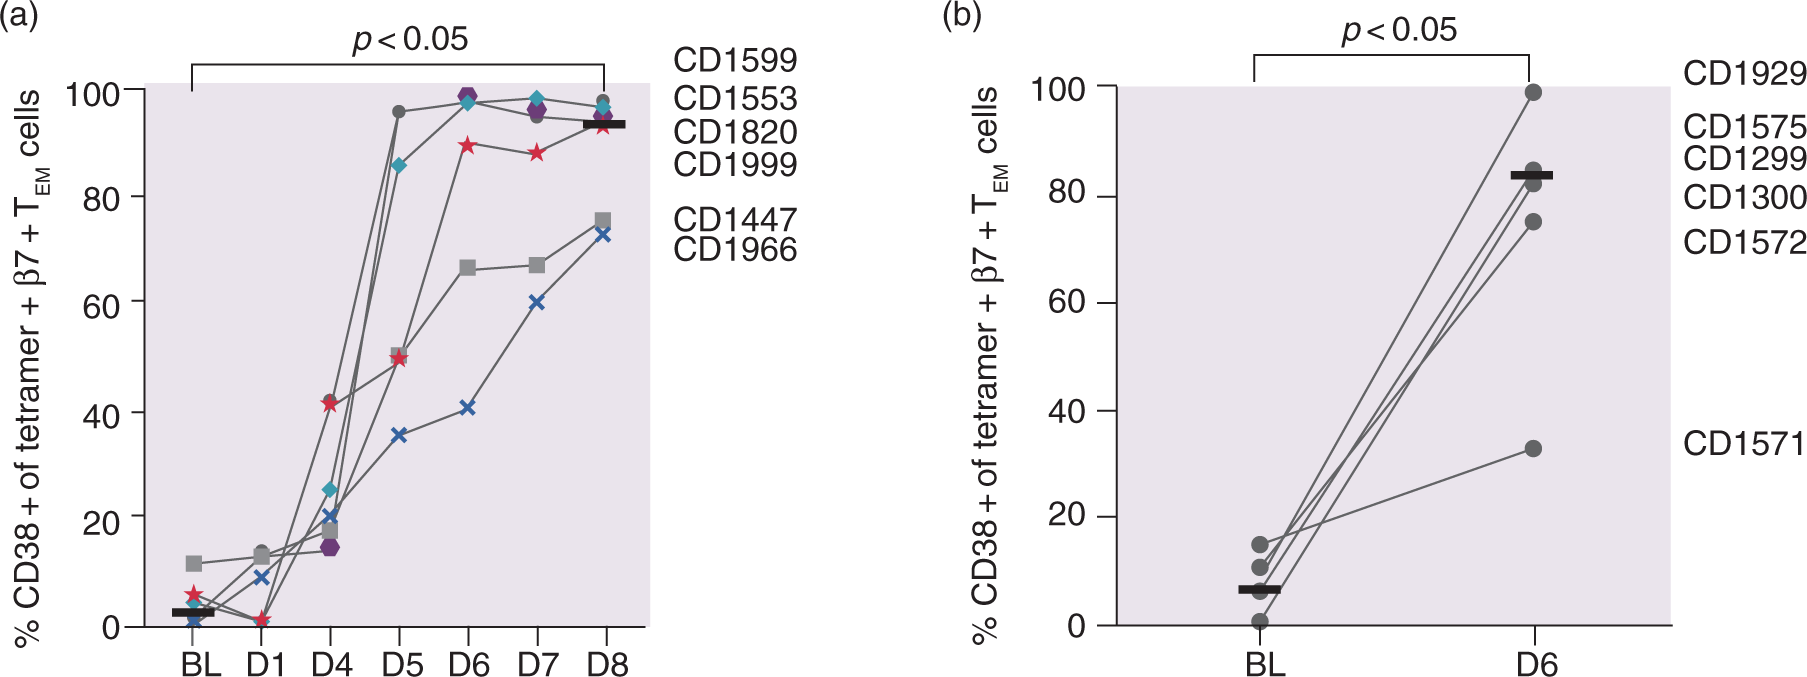
Discussion
In this study, we assessed the suitability of T-cell-related parameters for monitoring the efficacy of intervention as part of oral gluten challenge in treated CeD patients. Specifically, we assessed the numbers of gluten-specific T cells in peripheral blood, the percentage of these cells expressing the activation marker CD38, as well as the concentration of IL-2 in plasma. We also determined the kinetics of appearance of gluten-specific T cells in blood and investigated the effect of challenge with a single dose of gluten. The findings on oral challenge–induced surrogate markers were complemented with PROM recordings.
We monitored symptoms in response to gluten challenge using the GSRS-IBS questionnaire and a VAS for five different gastrointestinal symptoms. 8 Symptoms reported in the GSRS questionnaire increased mildly after gluten exposure. Symptoms reported on the VAS peaked on days 1–2 and days 6–7 after gluten challenge over three days. The symptoms after the one-day challenge almost exclusively peaked on the day of challenge. Based on previous documentation of PROM after gluten challenge,8,28 we expected symptom peaks during challenge. The strong symptom response after the one-day challenge might also be explained by psychological or physical responses to the single intervention due to a lack of blinding 29 in this study or due to a longer observation period after the three-day challenge.
In accordance with earlier studies,8,12,13,27 we found that an oral gluten challenge induces a significant increase in the number of gluten-specific β7 + TEM CD4 + T cells in the blood. However, there is wide interindividual variation in terms of both fold increase and absolute numbers of cells at plateau. The increase in gluten-specific T cells was less pronounced after one single dose of gluten compared to challenge over three days. We further tested if plasma IL-2 measured at four hours after gluten challenge could serve as a surrogate marker for immune cell activation, and we found a highly significant increase in IL-2. Yet, there were large interindividual differences in both fold increase and absolute levels of the cytokine. We did not find a statistically significant correlation of IL-2 concentration and tetramer + β7 + TEM cell numbers and hence failed to reproduce the newly reported finding that the tetramer + β7 + TEM cell frequency at baseline correlates with the fold change of IL-2 concentration. 30 This finding may relate to the small sample size of this study due to a demanding protocol. However, we could reproduce the previously reported correlation of IL-2 increase and symptoms after gluten challenge. 8
In contrast to high quantitative variability in numbers of gluten-specific T cells and levels of IL-2, the induction of CD38 expression by gluten-specific β7 + TEM CD4 + T cells was strikingly uniform. A similar uniform response of CD38 expression has been shown previously on day 6 under ongoing gluten challenge for 14 days. 8 Here, we demonstrate that after day 6, the expression of CD38 further increases until day 8 in individuals with a weaker response to gluten challenge. In the case of participant CD1571, assessment of CD38 expression on day 8 would likely have given a better indication if this patient was a slow responder (as CD1447 and CD1966) or a non-responder to gluten challenge. Thus, measurement of the percentage of CD38 + cells among gluten-specific T cells is an attractive surrogate marker for assessing drug efficacy after gluten challenge, and the assessment should be performed on day 8 rather than day 6 after the onset of gluten challenge.
In conclusion, the frequency of gluten-specific T cells plateaus between days 6 and 8 after gluten challenge over three days, indicating the appropriate time window for collecting gluten-specific T cells in future studies. The IL-2 concentration in plasma increased in all participants but with a large interindividual range, while the CD38 expression on gluten-specific T cells incremented in a robust manner. A single gluten challenge was sufficient to induce a response of gluten-specific T cells and was not inferior to the three-day challenge regarding CD38 expression. This study promotes a role for assessment of CD38 expression as a consistent alternative to contemporary outcome measures for upcoming clinical trials.
Supplemental Material
Supplemental material for CD38 expression on gluten-specific T cells is a robust marker of gluten re-exposure in coeliac disease
Supplemental Material for CD38 expression on gluten-specific T cells is a robust marker of gluten re-exposure in coeliac disease by Stephanie Zühlke, Louise Fremgaard Risnes, Shiva Dahal-Koirala, Asbjørn Christophersen, Ludvig M Sollid and Knut EA Lundin in United European Gastroenterology Journal
Footnotes
Acknowledgements
We thank Bjørg Simonsen, Marie K. Johannesen, Stine R. Lund, Carina Hinrichs, Marte Hulbaklien Bakke and Khaledeh Samimi for technical assistance, and Siv Furholm for administrative assistance. We are thankful to Kjersti Langballe Rolfsen for testing and baking the gluten-containing cookies and muesli bars, and the Proteomics Core Facility at Oslo University Hospital Rikshospitalet for analysis of the cookies. We also thank Shuo-Wang Qiao for productive input and discussions in the start of the kinetics project. Finally, we thank Jens Pahnke and his lab for kindly providing access to the MSD QuickPlex SQ 120 and for useful advice.
Declaration of conflicting interests
The authors declare that there is no conflict of interest.
Funding
This work was funded by the K.G. Jebsen Coeliac Disease Research Centre. No funding source had any role in the design, conduct or reporting of this study.
Ethics approval
The study was approved by the Norwegian regional ethics committee (2013/1237) and was published on ClinicalTrials.gov (NCT02464150).
Informed consent
Written, informed consent was obtained from each patient included in the study. The study protocol conforms to the ethical guidelines of the 1975 Declaration of Helsinki as reflected in a priori approval by the Norwegian regional ethics committee.
Supplemental material
Supplemental material for this article is available online.
References
Supplementary Material
Please find the following supplemental material available below.
For Open Access articles published under a Creative Commons License, all supplemental material carries the same license as the article it is associated with.
For non-Open Access articles published, all supplemental material carries a non-exclusive license, and permission requests for re-use of supplemental material or any part of supplemental material shall be sent directly to the copyright owner as specified in the copyright notice associated with the article.